Energy
Who’s Still Buying Russian Fossil Fuels in 2023?
![]() Subscribe to the Elements free mailing list for more like this
Subscribe to the Elements free mailing list for more like this
The Countries Buying Fossil Fuels from Russia in 2023
This was originally posted on Elements. Sign up to the free mailing list to get beautiful visualizations on real assets and resource megatrends each week.
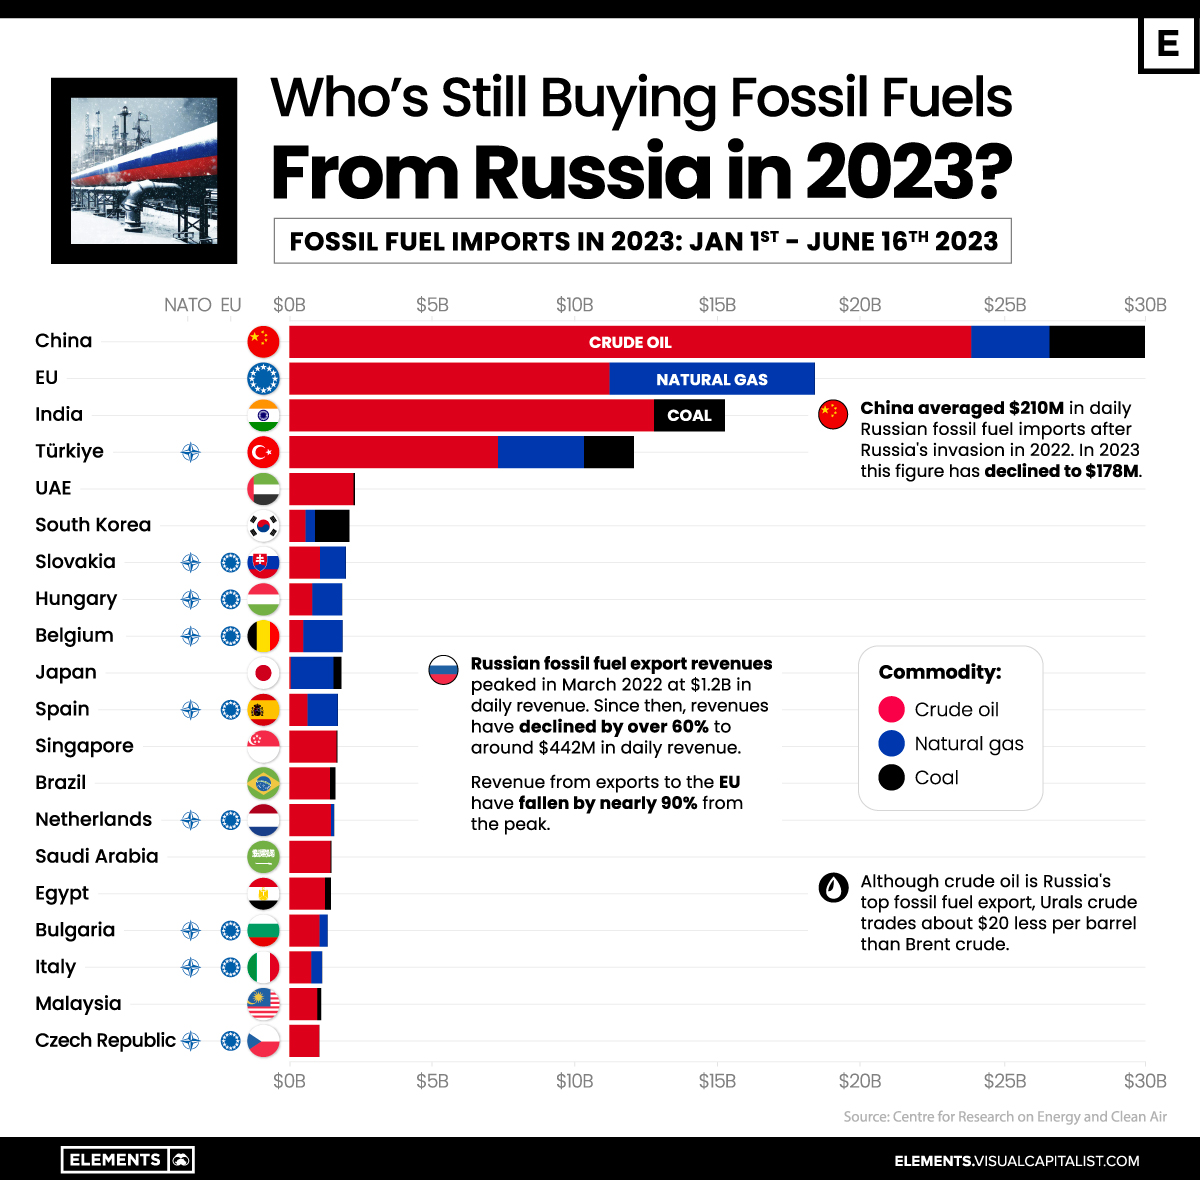
While Russia’s revenues from fossil fuel exports have declined significantly since their peak in March of 2022, many countries are still importing millions of dollars a day worth of fossil fuels from Russia.
Revenue from fossil fuels exported to the EU has declined more than 90% from their peak, but in 2023 the bloc has still imported more than $18 billion of crude oil and natural gas so far.
This graphic uses data from the Centre for Research on Energy and Clean Air (CREA) to visualize the top-importing countries of fossil fuels from Russia so far this year.
China Remains Russia’s Top Fossil Fuel Importer
China continues to be Russia’s top buyer of fossil fuels, with imports reaching $30 billion in 2023 up until June 16, 2023.
With nearly 80% of China’s fuel imports being crude oil, Russia’s average daily revenues from Chinese fossil fuel imports have declined from $210 million in 2022 to $178 million in 2023 largely due to the falling price of Russian crude oil.
Following China are EU nations collectively, which despite no longer importing coal from Russia since August of 2022, still imported $18.4 billion of fossil fuels in a 60/40 split of crude oil and natural gas respectively.
| Country | Russian Fossil Fuel Imports* (Total) | Crude Oil | Natural Gas | Coal | |||||||||
|---|---|---|---|---|---|---|---|---|---|---|---|---|---|
| 🇨🇳 China | $30B | $23.9B | $2.7B | $3.3B | |||||||||
| 🇪🇺 EU | $18.4B | $11.2B | $7.2B | $0 | |||||||||
| 🇮🇳 India | $15.2B | $12.8B | $0 | $2.5B | |||||||||
| 🇹🇷 Türkiye | $12.1B | $7.3B | $3B | $1.7B | |||||||||
| 🇦🇪 UAE | $2.3B | $2.3B | $0 | $0 | |||||||||
| 🇰🇷 South Korea | $2.1B | $0.6B | $0.3B | $1.2B | |||||||||
| 🇸🇰 Slovakia | $2.0B | $1.1B | $0.9B | $0 | |||||||||
| 🇭🇺 Hungary | $1.9B | $0.8B | $1.1B | $0 | |||||||||
| 🇧🇪 Belgium | $1.9B | $0.5B | $1.4B | $0 | |||||||||
| 🇯🇵 Japan | $1.8B | $0 | $1.5B | $0.3B | |||||||||
| 🇪🇸 Spain | $1.7B | $0.6B | $1.1B | $0 | |||||||||
| 🇸🇬 Singapore | $1.7B | $1.7B | $0 | $0 | |||||||||
| 🇧🇷 Brazil | $1.6B | $1.4B | $0 | $0.2B | |||||||||
| 🇳🇱 Netherlands | $1.6B | $1.5B | $0.1B | $0 | |||||||||
| 🇸🇦 Saudi Arabia | $1.5B | $1.4B | $0 | $0 | |||||||||
| 🇪🇬 Egypt | $1.4B | $1.3B | $0 | $0.2B | |||||||||
| 🇧🇬 Bulgaria | $1.3B | $1.1B | $0.3B | $0 | |||||||||
| 🇮🇹 Italy | $1.2B | $0.8B | $0.4B | $0 | |||||||||
| 🇲🇾 Malaysia | $1.1B | $1.0B | $0 | $0.1B | |||||||||
| 🇨🇿 Czech Republic | $1.0B | $1.1B | $0 | $0 |
*Over the time period of Jan 1, 2023 to June 16, 2023 in U.S. dollars
After China and the EU bloc, India is the next-largest importer of Russian fossil fuels, having ramped up the amount of fossil fuels imported by more than 10x since before Russia’s invasion of Ukraine, largely due to discounted Russian oil.
Türkiye is the only other nation to have imported more than $10 billion worth of Russian fossil fuels in 2023, with every other country having imported fewer than $3 billion worth of fuels from Russia this year.
Navigating the Crude Reality of Oil Exports
Although crude oil is Russia’s chief fossil fuel export, the nation’s Urals crude traded at a $20 per barrel discount to Brent crude throughout most of 2023. While this discount has narrowed to around $16 following Russia’s announcement of further oil export cuts of 500,000 bpd (barrels per day), the price of Urals crude oil remains just 40 cents below the $60 price cap put in place by G7 and EU nations.
Alongside Russia, Saudi Arabia also announced it would extend its cut of 1 million bpd until the end of August, with Saudi Energy Minister Prince Abdulaziz bin Salman commenting on the country’s solidarity with Russia and saying it would do “whatever is necessary” to support the oil market.
While OPEC and OPEC+ nations’ cuts are an attempt at pushing crude oil prices up, increased production from the U.S. has counteracted this. The EIA forecasts 2023 U.S. production to be 12.6 million bpd, surpassing the high in 2019 of 12.3 million bpd.


Energy
Charted: 4 Reasons Why Lithium Could Be the Next Gold Rush
Visual Capitalist has partnered with EnergyX to show why drops in prices and growing demand may make now the right time to invest in lithium.


4 Reasons Why You Should Invest in Lithium
Lithium’s importance in powering EVs makes it a linchpin of the clean energy transition and one of the world’s most precious minerals.
In this graphic, Visual Capitalist partnered with EnergyX to explore why now may be the time to invest in lithium.
1. Lithium Prices Have Dropped
One of the most critical aspects of evaluating an investment is ensuring that the asset’s value is higher than its price would indicate. Lithium is integral to powering EVs, and, prices have fallen fast over the last year:
| Date | LiOH·H₂O* | Li₂CO₃** |
|---|---|---|
| Feb 2023 | $76 | $71 |
| March 2023 | $71 | $61 |
| Apr 2023 | $43 | $33 |
| May 2023 | $43 | $33 |
| June 2023 | $47 | $45 |
| July 2023 | $44 | $40 |
| Aug 2023 | $35 | $35 |
| Sept 2023 | $28 | $27 |
| Oct 2023 | $24 | $23 |
| Nov 2023 | $21 | $21 |
| Dec 2023 | $17 | $16 |
| Jan 2024 | $14 | $15 |
| Feb 2024 | $13 | $14 |
Note: Monthly spot prices were taken as close to the 14th of each month as possible.
*Lithium hydroxide monohydrate MB-LI-0033
**Lithium carbonate MB-LI-0029
2. Lithium-Ion Battery Prices Are Also Falling
The drop in lithium prices is just one reason to invest in the metal. Increasing economies of scale, coupled with low commodity prices, have caused the cost of lithium-ion batteries to drop significantly as well.
In fact, BNEF reports that between 2013 and 2023, the price of a Li-ion battery dropped by 82%.
| Year | Price per KWh |
|---|---|
| 2023 | $139 |
| 2022 | $161 |
| 2021 | $150 |
| 2020 | $160 |
| 2019 | $183 |
| 2018 | $211 |
| 2017 | $258 |
| 2016 | $345 |
| 2015 | $448 |
| 2014 | $692 |
| 2013 | $780 |

3. EV Adoption is Sustainable
One of the best reasons to invest in lithium is that EVs, one of the main drivers behind the demand for lithium, have reached a price point similar to that of traditional vehicle.
According to the Kelly Blue Book, Tesla’s average transaction price dropped by 25% between 2022 and 2023, bringing it in line with many other major manufacturers and showing that EVs are a realistic transport option from a consumer price perspective.
| Manufacturer | September 2022 | September 2023 |
|---|---|---|
| BMW | $69,000 | $72,000 |
| Ford | $54,000 | $56,000 |
| Volkswagon | $54,000 | $56,000 |
| General Motors | $52,000 | $53,000 |
| Tesla | $68,000 | $51,000 |
4. Electricity Demand in Transport is Growing
As EVs become an accessible transport option, there’s an investment opportunity in lithium. But possibly the best reason to invest in lithium is that the IEA reports global demand for the electricity in transport could grow dramatically by 2030:
| Transport Type | 2022 | 2025 | 2030 |
|---|---|---|---|
| Buses 🚌 | 23,000 GWh | 50,000 GWh | 130,000 GWh |
| Cars 🚙 | 65,000 GWh | 200,000 GWh | 570,000 GWh |
| Trucks 🛻 | 4,000 GWh | 15,000 GWh | 94,000 GWh |
| Vans 🚐 | 6,000 GWh | 16,000 GWh | 72,000 GWh |
The Lithium Investment Opportunity
Lithium presents a potentially classic investment opportunity. Lithium and battery prices have dropped significantly, and recently, EVs have reached a price point similar to other vehicles. By 2030, the demand for clean energy, especially in transport, will grow dramatically.
With prices dropping and demand skyrocketing, now is the time to invest in lithium.
EnergyX is poised to exploit lithium demand with cutting-edge lithium extraction technology capable of extracting 300% more lithium than current processes.

-

 Lithium5 days ago
Ranked: The Top 10 EV Battery Manufacturers in 2023
Asia dominates this ranking of the world’s largest EV battery manufacturers in 2023.
-

 Energy1 week ago
The World’s Biggest Nuclear Energy Producers
China has grown its nuclear capacity over the last decade, now ranking second on the list of top nuclear energy producers.
-

 Energy1 month ago
The World’s Biggest Oil Producers in 2023
Just three countries accounted for 40% of global oil production last year.
-

 Energy1 month ago
How Much Does the U.S. Depend on Russian Uranium?
Currently, Russia is the largest foreign supplier of nuclear power fuel to the U.S.
-

 Uranium2 months ago
Charted: Global Uranium Reserves, by Country
We visualize the distribution of the world’s uranium reserves by country, with 3 countries accounting for more than half of total reserves.
-

 Energy3 months ago
Visualizing the Rise of the U.S. as Top Crude Oil Producer
Over the last decade, the United States has established itself as the world’s top producer of crude oil, surpassing Saudi Arabia and Russia.


-

 Science1 week ago
Visualizing the Average Lifespans of Mammals
-

 Markets2 weeks ago
The Top 10 States by Real GDP Growth in 2023
-

 Demographics2 weeks ago
The Smallest Gender Wage Gaps in OECD Countries
-

 United States2 weeks ago
Where U.S. Inflation Hit the Hardest in March 2024
-

 Green2 weeks ago
Top Countries By Forest Growth Since 2001
-

 United States2 weeks ago
Ranked: The Largest U.S. Corporations by Number of Employees
-

 Maps2 weeks ago
The Largest Earthquakes in the New York Area (1970-2024)
-

 Green2 weeks ago
Ranked: The Countries With the Most Air Pollution in 2023