Energy
Ranked: The World’s Top Cobalt Producing Countries
![]() Subscribe to the Elements free mailing list for more like this
Subscribe to the Elements free mailing list for more like this


Ranked: The World’s Top Cobalt Producing Countries
This was originally posted on Elements. Sign up to the free mailing list to get beautiful visualizations on real assets and resource megatrends each week.
Cobalt, an essential component of key chemistries of the rechargeable lithium-ion batteries used in EVs, has seen a significant shift in its global production landscape.
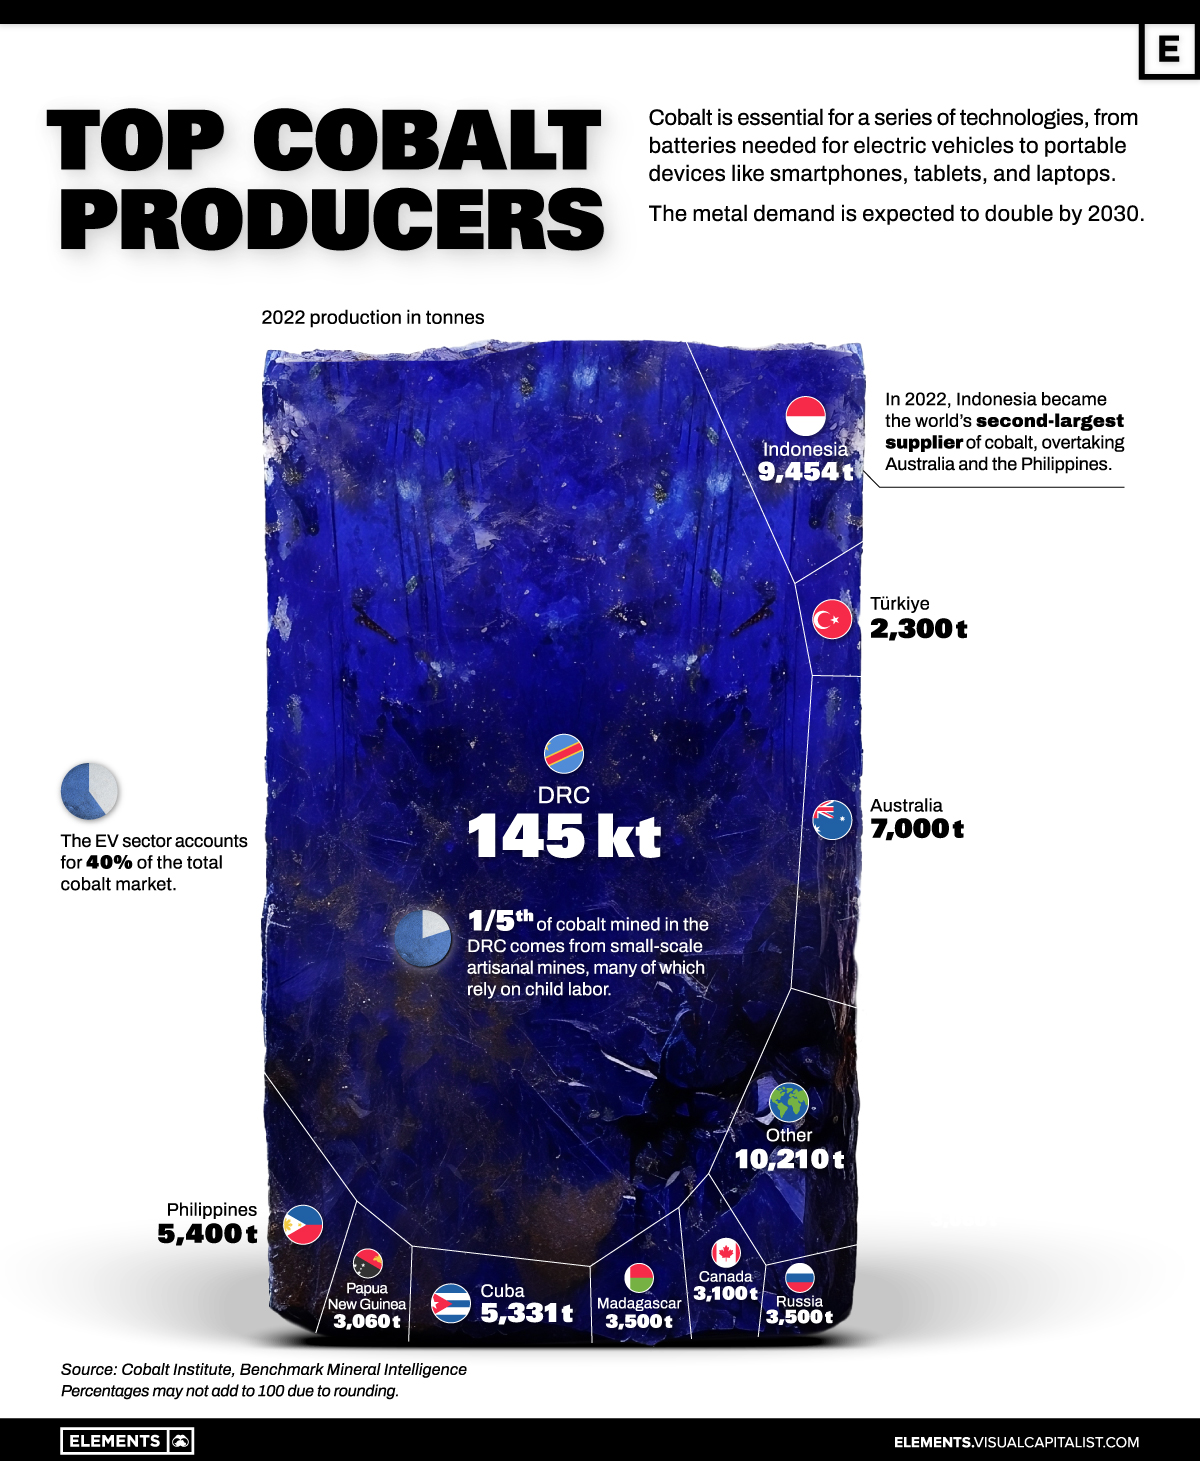
The Democratic Republic of Congo (DRC) has long been the world’s largest cobalt producer, accounting for 73% of global output in 2022.
However, according to the Cobalt Institute, the DRC’s dominance is projected to decrease to 57% by 2030 as Indonesia ramps up its cobalt production as a byproduct from its rapidly expanding nickel industry.
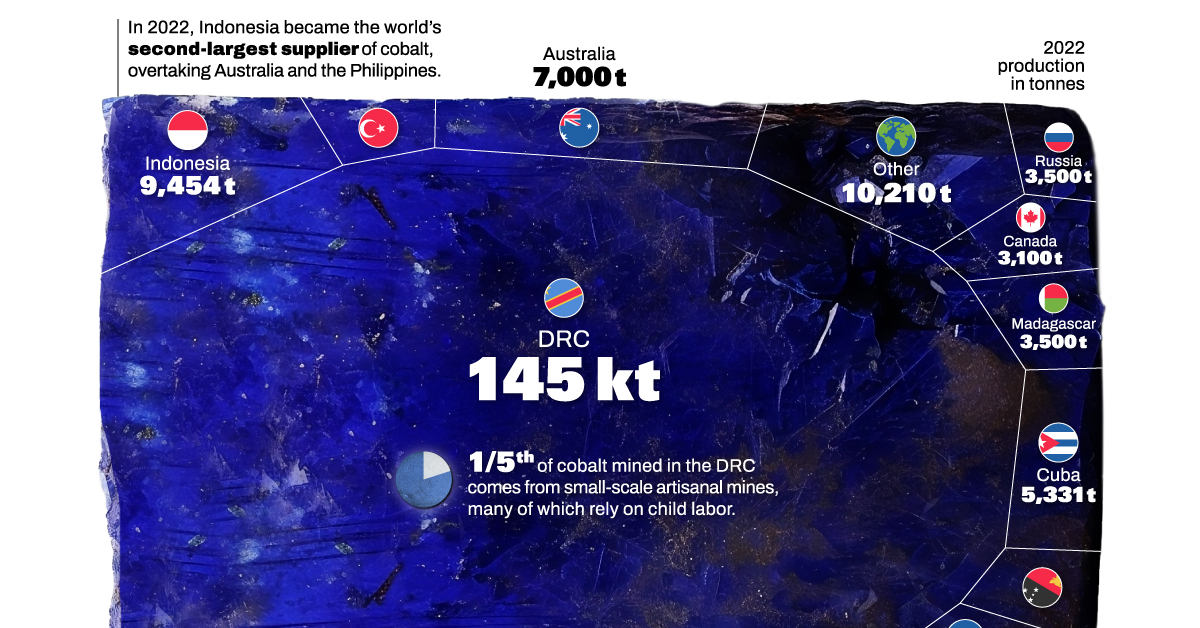
Indonesia Became Second Largest Cobalt Producer in 2022
Indonesia accounts for nearly 5% of global cobalt production today, surpassing established producers like Australia and the Philippines.
In 2022, Indonesia’s cobalt production surged to almost 9,500 tonnes from 2,700 tonnes in 2021, with the potential to increase production by tenfold by 2030.
| Country | 2022 Production (tonnes) | % of Total Production |
|---|---|---|
| 🇨🇩 DRC | 144,936 | 73.3% |
| 🇮🇩 Indonesia | 9,454 | 4.8% |
| 🇦🇺 Australia | 7,000 | 3.5% |
| 🇵🇭 Philippines | 5,400 | 2.7% |
| 🇨🇺 Cuba | 5,331 | 2.7% |
| 🇷🇺 Russia | 3,500 | 1.8% |
| 🇲🇬 Madagascar | 3,500 | 1.8% |
| 🇨🇦 Canada | 3,100 | 1.6% |
| 🇵🇬 Papua New Guinea | 3,060 | 1.5% |
| 🇹🇷 Türkiye | 2,300 | 1.2% |
| 🌐 Other | 10,210 | 5.2% |
| Total | 197,791 | 100.0% |
Percentages may not add to 100 due to rounding.
In total, global cobalt production reached 197,791 tonnes, with the DRC contributing just under 145,000 tonnes of that mix.
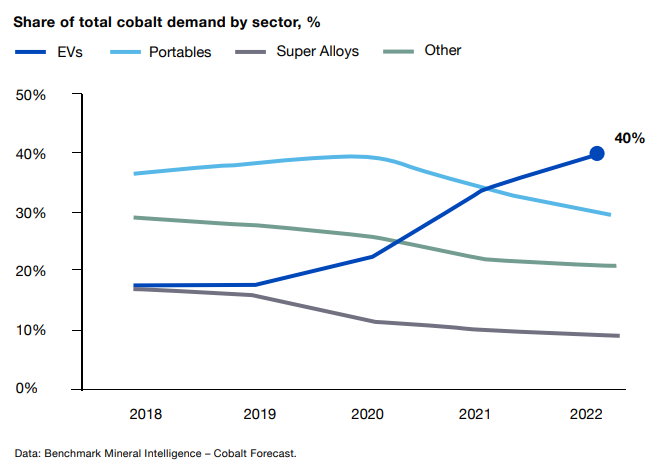
The EV industry is the largest consumer of cobalt, accounting for approximately 40% of total demand. The exponential growth of the EV sector is expected to drive a doubling of global cobalt demand by 2030.
While the shift in cobalt production is notable, it is not without challenges. Plummeting cobalt prices, which fell almost 30% this year to $13.90 a pound, have severely impacted the DRC.
Furthermore, the longer-term prospects of cobalt could face hurdles due to efforts to reduce its use in batteries, partly driven by human rights concerns associated with artisanal cobalt mining in the DRC and related child labor and human rights abuses.
In a 2021 ruling by a federal court in Washington, Google parent Alphabet, Apple, Dell, Microsoft, and Tesla were relieved from a class action suit claiming their responsibility for alleged child labor in Congolese cobalt mines.
The Future of Cobalt
Despite ongoing efforts to substitute cobalt in battery applications, cobalt is expected to remain a vital raw material for the entire battery supply chain in the near future.
The demand for cobalt is forecasted to more than double by 2030 to 388,000 tonnes.


Energy
Charted: 4 Reasons Why Lithium Could Be the Next Gold Rush
Visual Capitalist has partnered with EnergyX to show why drops in prices and growing demand may make now the right time to invest in lithium.


4 Reasons Why You Should Invest in Lithium
Lithium’s importance in powering EVs makes it a linchpin of the clean energy transition and one of the world’s most precious minerals.
In this graphic, Visual Capitalist partnered with EnergyX to explore why now may be the time to invest in lithium.
1. Lithium Prices Have Dropped
One of the most critical aspects of evaluating an investment is ensuring that the asset’s value is higher than its price would indicate. Lithium is integral to powering EVs, and, prices have fallen fast over the last year:
| Date | LiOH·H₂O* | Li₂CO₃** |
|---|---|---|
| Feb 2023 | $76 | $71 |
| March 2023 | $71 | $61 |
| Apr 2023 | $43 | $33 |
| May 2023 | $43 | $33 |
| June 2023 | $47 | $45 |
| July 2023 | $44 | $40 |
| Aug 2023 | $35 | $35 |
| Sept 2023 | $28 | $27 |
| Oct 2023 | $24 | $23 |
| Nov 2023 | $21 | $21 |
| Dec 2023 | $17 | $16 |
| Jan 2024 | $14 | $15 |
| Feb 2024 | $13 | $14 |
Note: Monthly spot prices were taken as close to the 14th of each month as possible.
*Lithium hydroxide monohydrate MB-LI-0033
**Lithium carbonate MB-LI-0029
2. Lithium-Ion Battery Prices Are Also Falling
The drop in lithium prices is just one reason to invest in the metal. Increasing economies of scale, coupled with low commodity prices, have caused the cost of lithium-ion batteries to drop significantly as well.
In fact, BNEF reports that between 2013 and 2023, the price of a Li-ion battery dropped by 82%.
| Year | Price per KWh |
|---|---|
| 2023 | $139 |
| 2022 | $161 |
| 2021 | $150 |
| 2020 | $160 |
| 2019 | $183 |
| 2018 | $211 |
| 2017 | $258 |
| 2016 | $345 |
| 2015 | $448 |
| 2014 | $692 |
| 2013 | $780 |

3. EV Adoption is Sustainable
One of the best reasons to invest in lithium is that EVs, one of the main drivers behind the demand for lithium, have reached a price point similar to that of traditional vehicle.
According to the Kelly Blue Book, Tesla’s average transaction price dropped by 25% between 2022 and 2023, bringing it in line with many other major manufacturers and showing that EVs are a realistic transport option from a consumer price perspective.
| Manufacturer | September 2022 | September 2023 |
|---|---|---|
| BMW | $69,000 | $72,000 |
| Ford | $54,000 | $56,000 |
| Volkswagon | $54,000 | $56,000 |
| General Motors | $52,000 | $53,000 |
| Tesla | $68,000 | $51,000 |
4. Electricity Demand in Transport is Growing
As EVs become an accessible transport option, there’s an investment opportunity in lithium. But possibly the best reason to invest in lithium is that the IEA reports global demand for the electricity in transport could grow dramatically by 2030:
| Transport Type | 2022 | 2025 | 2030 |
|---|---|---|---|
| Buses 🚌 | 23,000 GWh | 50,000 GWh | 130,000 GWh |
| Cars 🚙 | 65,000 GWh | 200,000 GWh | 570,000 GWh |
| Trucks 🛻 | 4,000 GWh | 15,000 GWh | 94,000 GWh |
| Vans 🚐 | 6,000 GWh | 16,000 GWh | 72,000 GWh |
The Lithium Investment Opportunity
Lithium presents a potentially classic investment opportunity. Lithium and battery prices have dropped significantly, and recently, EVs have reached a price point similar to other vehicles. By 2030, the demand for clean energy, especially in transport, will grow dramatically.
With prices dropping and demand skyrocketing, now is the time to invest in lithium.
EnergyX is poised to exploit lithium demand with cutting-edge lithium extraction technology capable of extracting 300% more lithium than current processes.

-

 Lithium4 days ago
Ranked: The Top 10 EV Battery Manufacturers in 2023
Asia dominates this ranking of the world’s largest EV battery manufacturers in 2023.
-

 Energy1 week ago
The World’s Biggest Nuclear Energy Producers
China has grown its nuclear capacity over the last decade, now ranking second on the list of top nuclear energy producers.
-

 Energy1 month ago
The World’s Biggest Oil Producers in 2023
Just three countries accounted for 40% of global oil production last year.
-

 Energy1 month ago
How Much Does the U.S. Depend on Russian Uranium?
Currently, Russia is the largest foreign supplier of nuclear power fuel to the U.S.
-

 Uranium2 months ago
Charted: Global Uranium Reserves, by Country
We visualize the distribution of the world’s uranium reserves by country, with 3 countries accounting for more than half of total reserves.
-

 Energy3 months ago
Visualizing the Rise of the U.S. as Top Crude Oil Producer
Over the last decade, the United States has established itself as the world’s top producer of crude oil, surpassing Saudi Arabia and Russia.


-

 Misc1 week ago
How Hard Is It to Get Into an Ivy League School?
-

 Technology2 weeks ago
Ranked: Semiconductor Companies by Industry Revenue Share
-

 Markets2 weeks ago
Ranked: The World’s Top Flight Routes, by Revenue
-

 Demographics2 weeks ago
Population Projections: The World’s 6 Largest Countries in 2075
-

 Markets2 weeks ago
The Top 10 States by Real GDP Growth in 2023
-

 Demographics2 weeks ago
The Smallest Gender Wage Gaps in OECD Countries
-

 United States2 weeks ago
Where U.S. Inflation Hit the Hardest in March 2024
-

 Green2 weeks ago
Top Countries By Forest Growth Since 2001