Countries
Mapped: How Global Housing Prices Have Changed Since 2010
Article/Editing:
How Global Housing Prices Have Changed Since 2010
In many countries around the world, it seems like house prices have been constantly climbing.
Houses fulfill a rare mix of necessity, utility, sentimentality, and for many, also act as a primary investment to build wealth. And it’s that last angle, combined with increasing demand in many countries, that is driving housing prices skyward.
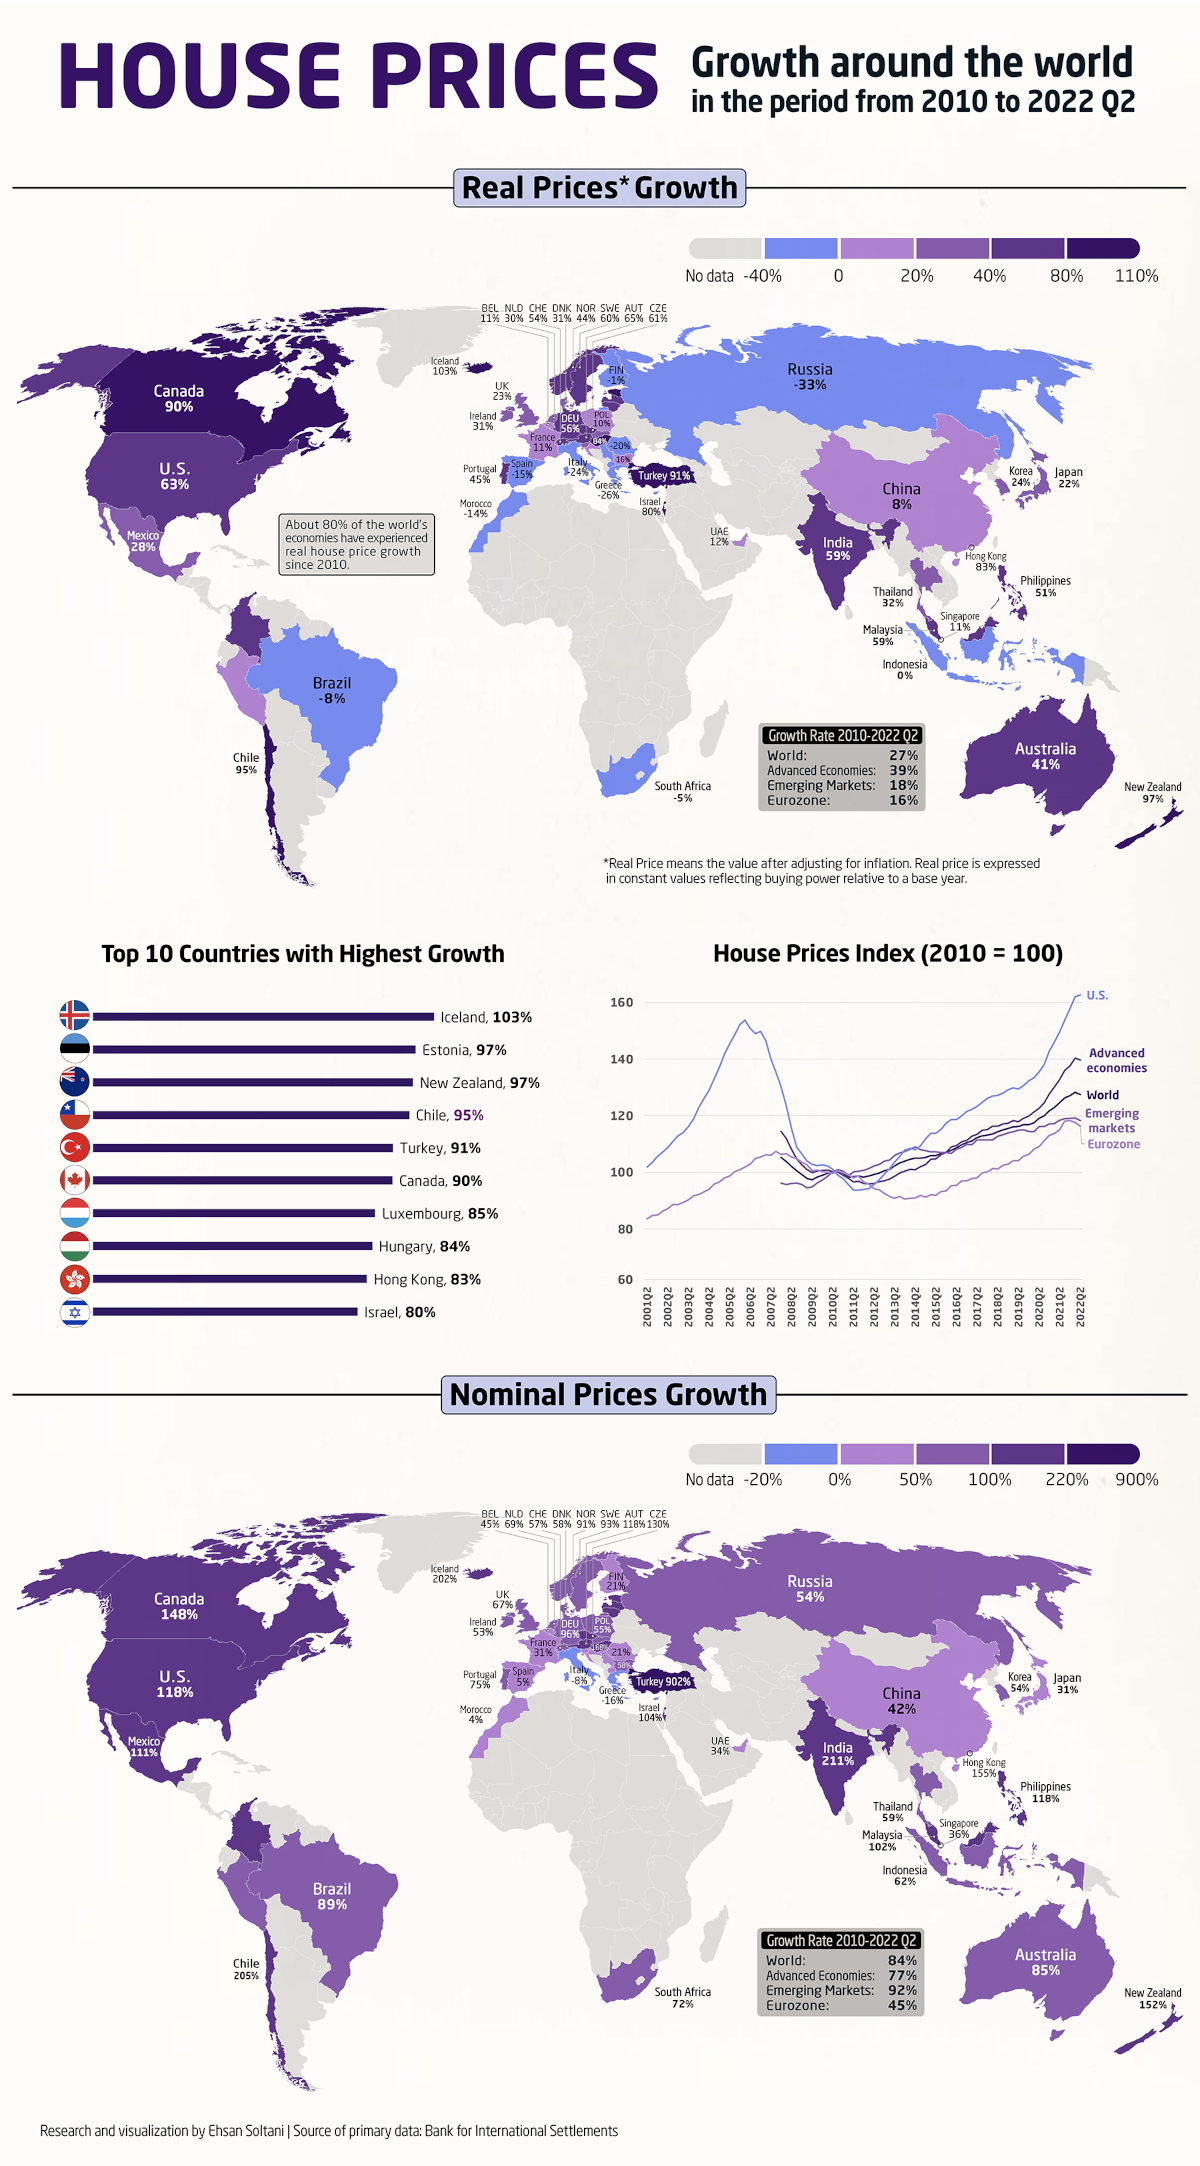
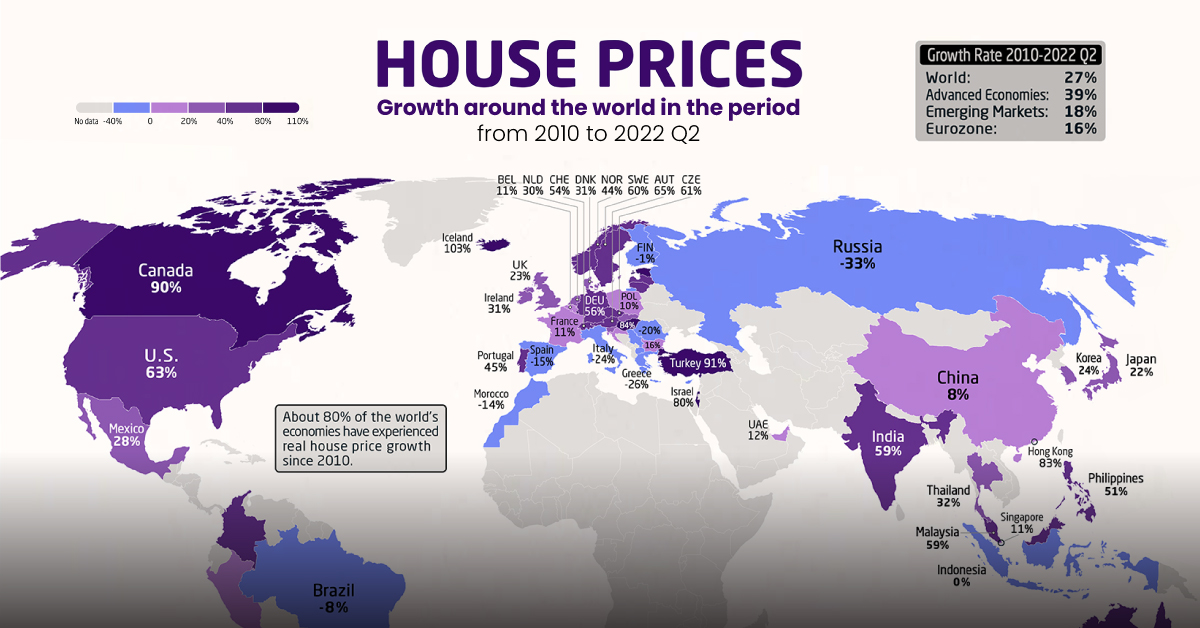
Using data from the Bank of International Settlements, Ehsan Soltani has ranked the change in real residential property prices for 57 countries from 2010 to 2022.
In the dataset of 57 countries, 80% have seen increases in housing prices in the last 12 years.
| Real Price Growth | Nominal Price Growth | |
|---|---|---|
| Advanced economies | 39% | 77% |
| World | 27% | 84% |
| Emerging market economies | 18% | 92% |
| Eurozone | 16% | 45% |
Advanced economies, or the most developed countries in the world, have seen the highest increases. But across all measured countries, the real price of housing has increased nearly 30% on average since 2010.
Countries with Increased Housing Prices (2010‒2022)
Leading the group of 45 countries with increased housing prices is Iceland, with local real prices more than doubling since 2010.
| Housing Prices by Country | Real Price Growth | Nominal Price Growth |
|---|---|---|
| 🇮🇸 Iceland | 103% | 202% |
| 🇪🇪 Estonia | 97% | 196% |
| 🇳🇿 New Zealand | 97% | 152% |
| 🇨🇱 Chile | 95% | 205% |
| 🇹🇷 Turkey | 91% | 902% |
| 🇨🇦 Canada | 90% | 148% |
| 🇱🇺 Luxembourg | 85% | 135% |
| 🇭🇺 Hungary | 84% | 168% |
| 🇭🇰 Hong Kong | 83% | 155% |
| 🇮🇱 Israel | 80% | 104% |
| 🇱🇻 Latvia | 66% | 131% |
| 🇦🇹 Austria | 65% | 118% |
| 🇺🇸 United States | 63% | 118% |
| 🇨🇿 Czechia | 61% | 130% |
| 🇸🇪 Sweden | 60% | 93% |
| 🇮🇳 India | 59% | 211% |
| 🇲🇾 Malaysia | 59% | 102% |
| 🇱🇹 Lithuania | 57% | 130% |
| 🇩🇪 Germany | 56% | 96% |
| 🇨🇭 Switzerland | 54% | 57% |
| 🇵🇭 Philippines | 51% | 118% |
| 🇵🇹 Portugal | 45% | 75% |
| 🇳🇴 Norway | 44% | 91% |
| 🇨🇴 Colombia | 43% | 133% |
| 🇦🇺 Australia | 41% | 85% |
| 🇸🇰 Slovak Republic | 34% | 81% |
| 🇹🇭 Thailand | 32% | 59% |
| 🇩🇰 Denmark | 31% | 58% |
| 🇮🇪 Ireland | 31% | 53% |
| 🇲🇹 Malta | 30% | 59% |
| 🇳🇱 Netherlands | 30% | 69% |
| 🇲🇽 Mexico | 28% | 111% |
| 🇰🇷 South Korea | 24% | 54% |
| 🇬🇧 United Kingdom | 23% | 67% |
| 🇯🇵 Japan | 22% | 31% |
| 🇸🇮 Slovenia | 20% | 47% |
| 🇵🇪 Peru | 18% | 73% |
| 🇧🇬 Bulgaria | 16% | 58% |
| 🇭🇷 Croatia | 15% | 43% |
| 🇦🇪 United Arab Emirates | 12% | 34% |
| 🇧🇪 Belgium | 11% | 45% |
| 🇫🇷 France | 11% | 31% |
| 🇸🇬 Singapore | 11% | 36% |
| 🇵🇱 Poland | 10% | 55% |
| 🇨🇳 China | 8% | 42% |
Other countries with a 85% or higher increases in housing prices include Estonia, New Zealand, Chile, Turkey, Canada, and Luxembourg. As emerging market economies, Turkey and Chile are the outliers in this group of mostly advanced economies.
Many other emerging market economies also saw housing prices increase. In India and Malaysia, housing prices are up by 59%. Likewise, the Philippines (50%) and Colombia (40%) also saw real prices increase faster than the global average.
However, not all countries logged big housing price increases. Some countries in Europe, including France, Belgium, and Croatia, and Asia, including China, and Singapore, all saw less than 20% growth in real prices.
Countries with Decreased Housing Prices (2010‒2022)
Some countries bucked the global trend and actually saw real housing prices fall over the last 12 years:
| Housing Prices by Country | Real Price Growth | Nominal Price Growth |
|---|---|---|
| 🇮🇩 Indonesia | 0% | 62% |
| 🇫🇮 Finland | -1% | 21% |
| 🇿🇦 South Africa | -5% | 72% |
| 🇲🇰 North Macedonia | -7% | 23% |
| 🇧🇷 Brazil | -8% | 89% |
| 🇷🇸 Serbia | -11% | 49% |
| 🇲🇦 Morocco | -14% | 4% |
| 🇪🇸 Spain | -15% | 5% |
| 🇷🇴 Romania | -20% | 21% |
| 🇮🇹 Italy | -24% | -8% |
| 🇬🇷 Greece | -26% | -16% |
| 🇷🇺 Russia | -33% | 54% |
Russia, Greece, and Italy saw the largest contractions in prices, all with housing price drops of more than 20%.
But these cases also allow us to see inflation in action. In Russia for example, despite real housing prices contracting by 33%, nominal prices (which don’t account for inflation) are up more than 50%. In South Africa, where real prices have fallen 5%, nominal prices are up 72%.
Is Your Country in a Housing Bubble?
From the housing prices of countries listed above, the data can point to the emergence of potential housing bubbles in Iceland, New Zealand, and Canada.
However, bubbles are usually only fully identified and measured after they have burst (or have started to). Otherwise, if their inflated values hold through sudden changes in market conditions, they can simply point to more accurately-priced demand.
There are a variety of reasons that can lead to housing price growth. Some of them are listed below, taken from a speech delivered by the deputy governor of the Bank of Canada back in 2015:
| Macroeconomic | Rising disposable incomes, lower long-term interest rates. |
| Demographic | Population growth, increased migration, and shifts in family structure. |
| Credit conditions | Broader access to and more efficient funding of mortgage credit. |
| Other factors | Improvements to macro-policy framework, international investment, and regulatory and tax changes. |
And specific local factors also play a part in many markets. In Iceland for example, tourism growth and the surge in short-term rentals have also contributed to the housing crisis.
Meanwhile, in the U.S., restricted housing supply is one of the factors pushing prices up.
When you factor in successive interest rate hikes to combat inflation and rising mortgage rates, the housing market remains at the forefront of discussion more so than ever. The question is, what comes next for the world’s housing prices?

This article was published as a part of Visual Capitalist's Creator Program, which features data-driven visuals from some of our favorite Creators around the world.


Demographics
Population Projections: The World’s 6 Largest Countries in 2075
See how the world’s 6 largest countries will grow (or shrink) by 2075, based on the latest UN population projections.
Population Projections for the World’s 6 Largest Countries
This was originally posted on our Voronoi app. Download the app for free on Apple or Android and discover incredible data-driven charts from a variety of trusted sources.
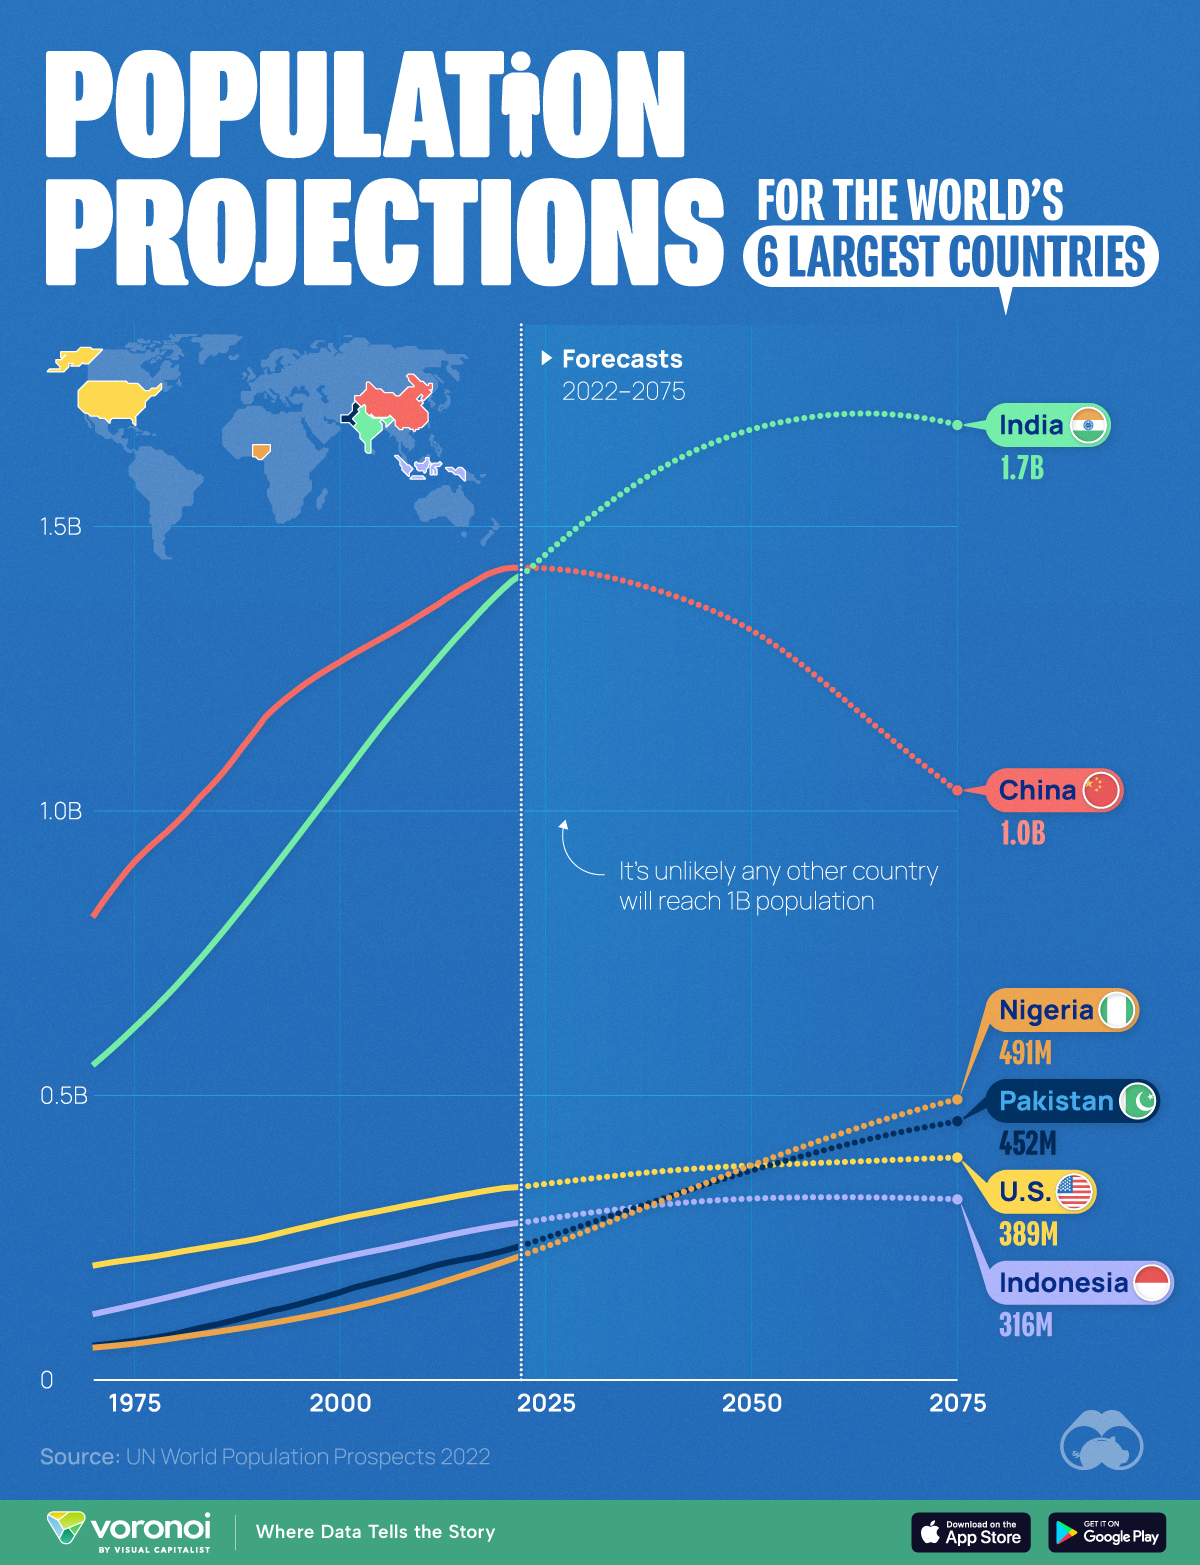
The end of the 21st century will see the first plateauing (and eventually shrinking) of world population since the Industrial Revolution. As birth rates fall across the globe, what does this mean for the world’s most populous countries?
To find out, we visualized forecasts for the world’s six largest countries using data from the latest revised version of the UN World Population Prospects 2022.
Projections are based on a “medium fertility scenario”, which assumes countries will converge at a birth rate of 1.85 children per woman, by 2045-2050.
China’s Projected Population Decline
China’s population boom has officially come to an end, with the country reporting two consecutive years of decreases (down 850,000 in 2022, and 2.1 million in 2023).
| Year | 🇨🇳 China | 🇺🇸 U.S. | 🇮🇩 Indonesia |
|---|---|---|---|
| 1970 | 812M | 199M | 114M |
| 1980 | 975M | 222M | 146M |
| 1990 | 1,144M | 246M | 181M |
| 2000 | 1,260M | 281M | 213M |
| 2010 | 1,344M | 310M | 242M |
| 2020 | 1,424M | 335M | 271M |
| 2030E | 1,417M | 351M | 291M |
| 2040E | 1,380M | 366M | 308M |
| 2050E | 1,317M | 375M | 317M |
| 2060E | 1,211M | 381M | 319M |
| 2070E | 1,091M | 387M | 318M |
| 2075E | 1,035M | 389M | 316M |
Note: Figures are rounded.
The country’s population in 2050 is forecasted to be 1.32 billion, which is roughly the same as it was in 2007. The UN believes this demographic downtrend will accelerate as we enter the second half of the century.
What does this mean for the Chinese economy? Many worry that a smaller workforce, coupled with an aging population, will increase healthcare expenditures and hamper economic growth.
India’s Population Boom Continues
Meanwhile, the UN believes that India’s population will peak somewhere in the mid 2060s, just shy of the 1.7 billion mark.
India’s population will not age as quickly as its neighbor. Those over the age of 65 will represent less than one-fifth of the population until 2060, and their share of India’s total number of people and will not approach 30% until 2100.
| Year | 🇮🇳 India | 🇵🇰 Pakistan | 🇳🇬 Nigeria |
|---|---|---|---|
| 1970 | 551M | 58M | 55M |
| 1980 | 689M | 79M | 72M |
| 1990 | 861M | 114M | 94M |
| 2000 | 1,050M | 152M | 121M |
| 2010 | 1,232M | 192M | 159M |
| 2020 | 1,390M | 225M | 206M |
| 2030E | 1,509M | 272M | 260M |
| 2040E | 1,608M | 320M | 318M |
| 2050E | 1,668M | 366M | 375M |
| 2060E | 1,695M | 406M | 427M |
| 2070E | 1,691M | 439M | 472M |
| 2075E | 1,678M | 452M | 491M |
Note: Figures are rounded.
Finally, whether these predictions come true or not will depend on how quickly birth rates fall as the country develops. For example, India’s fertility rate fell from 6.2 in 1950, to 2.0 in 2021 (births per woman).

-

 Maps2 weeks ago
Mapped: Average Wages Across Europe
-

 Money1 week ago
Which States Have the Highest Minimum Wage in America?
-

 Real Estate1 week ago
Ranked: The Most Valuable Housing Markets in America
-

 Markets1 week ago
Charted: Big Four Market Share by S&P 500 Audits
-

 AI1 week ago
The Stock Performance of U.S. Chipmakers So Far in 2024
-

 Automotive2 weeks ago
Almost Every EV Stock is Down After Q1 2024
-

 Money2 weeks ago
Where Does One U.S. Tax Dollar Go?
-

 Green2 weeks ago
Ranked: Top Countries by Total Forest Loss Since 2001