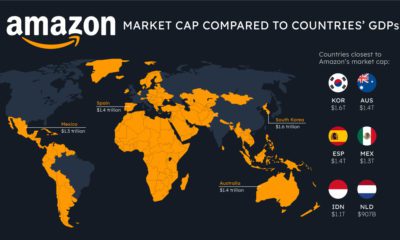

How do the big tech giants compare to entire countries? Here's how Apple, Microsoft, and Amazon's market caps stack up against national GDP.
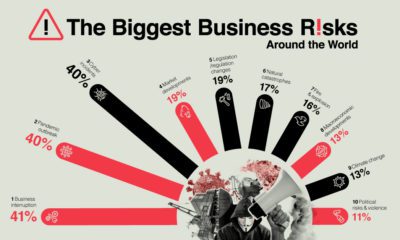

We live in an increasingly volatile world, where change is the only constant. Which are the top ten business risks to watch out for?
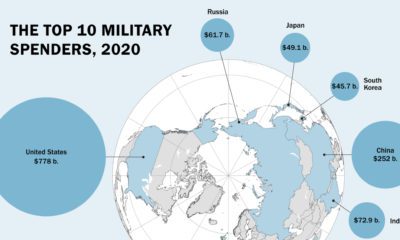

Global military spending is now at a 32-year high. We show countries' military spending by dollars and as a portion of GDP.
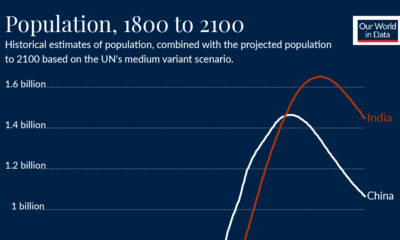

When will India's population overtake China's? Take a look at the trends behind this impending demographic milestone.
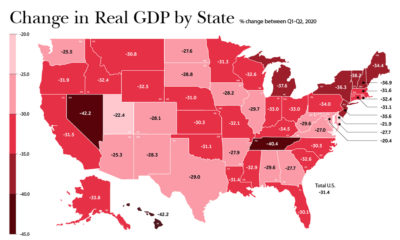

In just a few months, the U.S. economy reeled from COVID-19. As real change in GDP suffered, which states and industries were the hardest-hit?
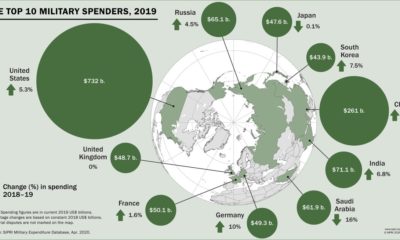

Global military spending surpassed $1.9 trillion in 2019, but nearly 75% of this total can be traced to just 10 countries.
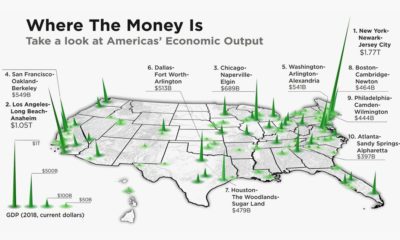

The total U.S. GDP stands at a whopping $21 trillion, but which metro areas contribute to the most in terms of economic output?
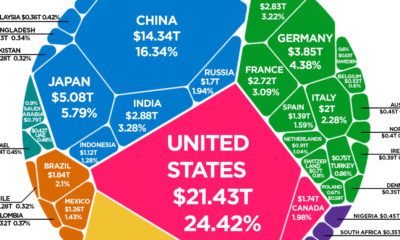

The world's total GDP crested $88 trillion in 2019—but how are the current COVID-19 economic contractions affecting its future outlook?

We’ve come a long way since Pangea. This short video examines the area, population, and GDP of our continents as a share of the world's total.
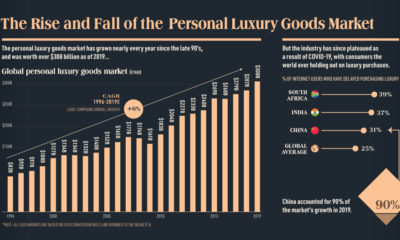

This infographic charts the rise and fall of the $308 billion global personal luxury market, and explores what the coming year holds for its growth


