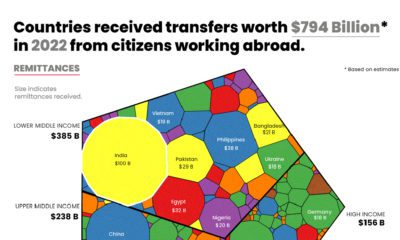

Which countries rely on remittance flows the most? This animation shows the amount of remittance income that countries received in 2022.
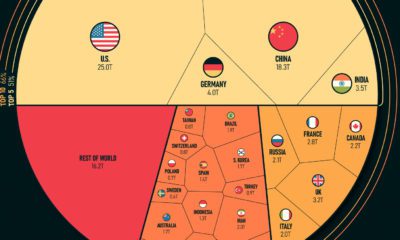

Just five countries make up more than half of the global economy. The top 25 countries make up a staggering 84% of the world's GDP.
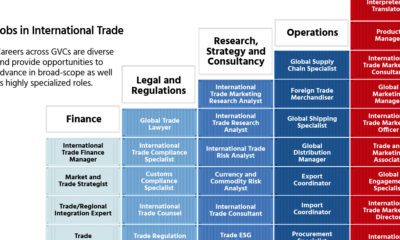

Global trade is growing across regions and countries which is creating an explosion in new jobs and education opportunities.


This visualization breaks down how household wealth is distributed around the world. Just 10 countries now account for 75% of total household wealth.


Stay up to date on the U.S. economy with this infographic summarizing the most recent Federal Reserve data released.


China’s economy reached a GDP of 114 trillion yuan ($18 trillion) in 2021, well above government targets. What sectors drove that growth?
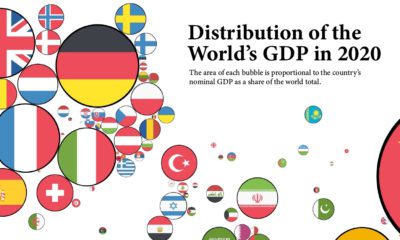

How have the world's largest economies changed over time? These graphics show countries sized by their GDP, as a share of the global total.
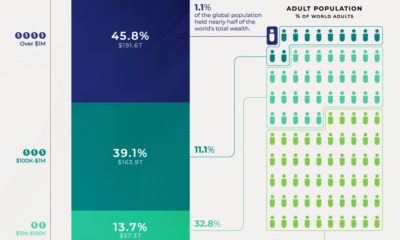

Global wealth at the end of 2020 was about $418 trillion. Here's a breakdown of the global wealth distribution among the adult population.
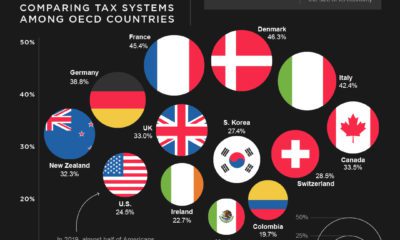

Using the tax-to-GDP ratio, we compare the tax systems of 35 OECD countries. See which nations have the highest and lowest rates.
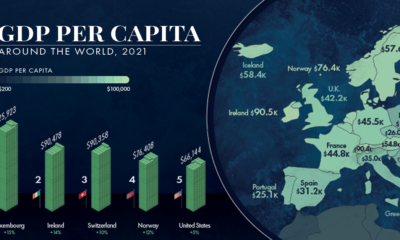

GDP per capita is one of the best measures of a country's standard of living. This map showcases the GDP per capita in every country globally.


 Creator Program