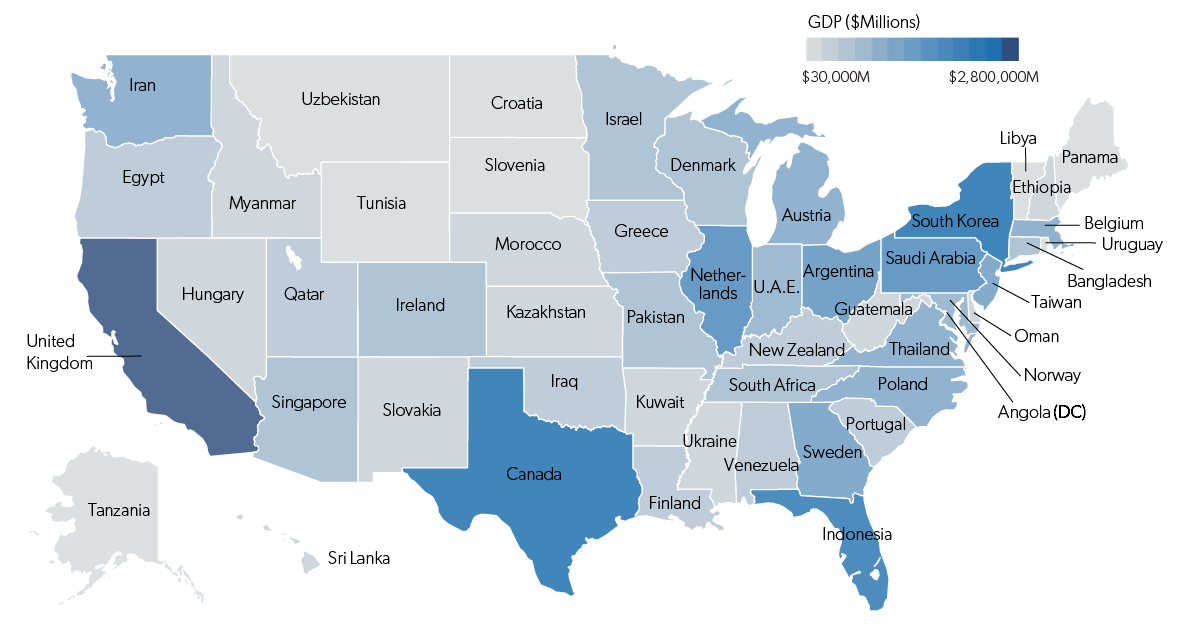
Each state has a GDP that is comparable in size to that of an actual country. This map shows it all, plus a full list of...
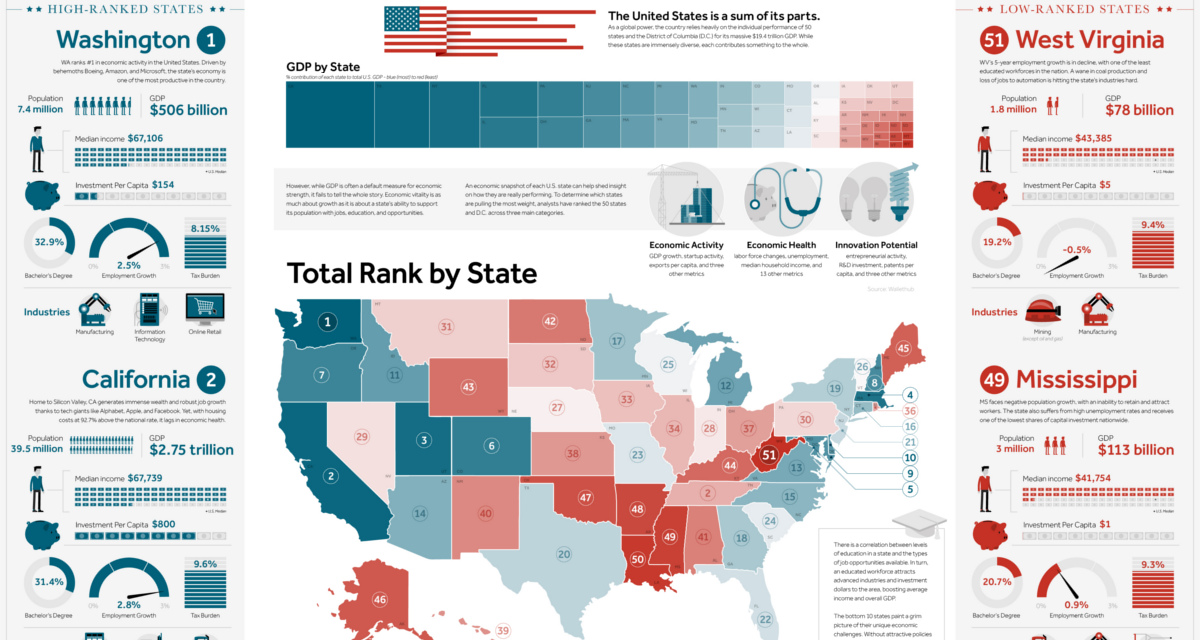
This giant infographic has state economies ranked from best to worst, based on an overall score comprised of 27 different metrics.
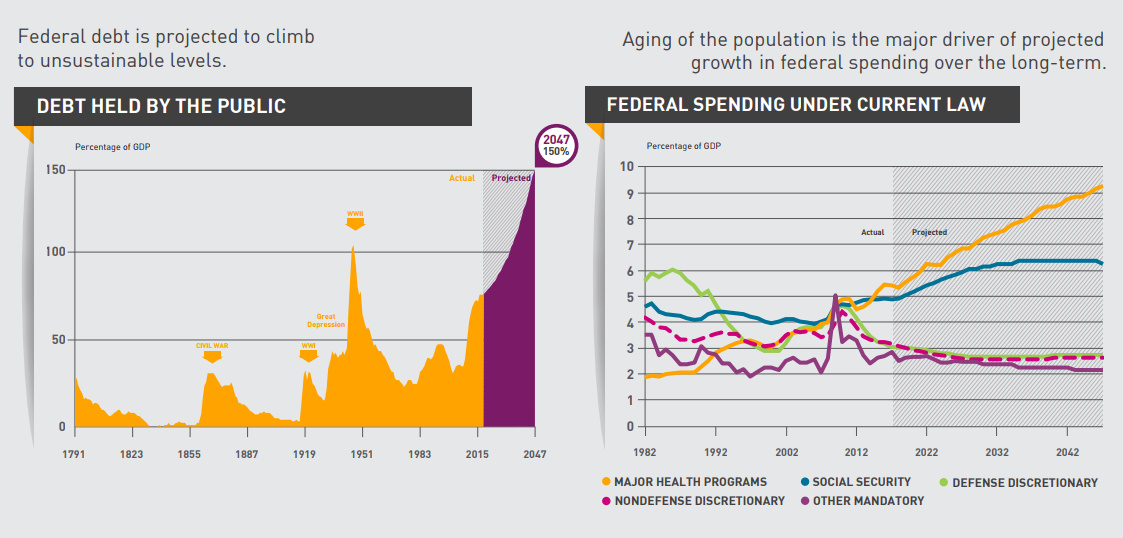
The national debt keeps growing and growing. But what's driving that trend, and when will the situation reach a critical mass of attention?
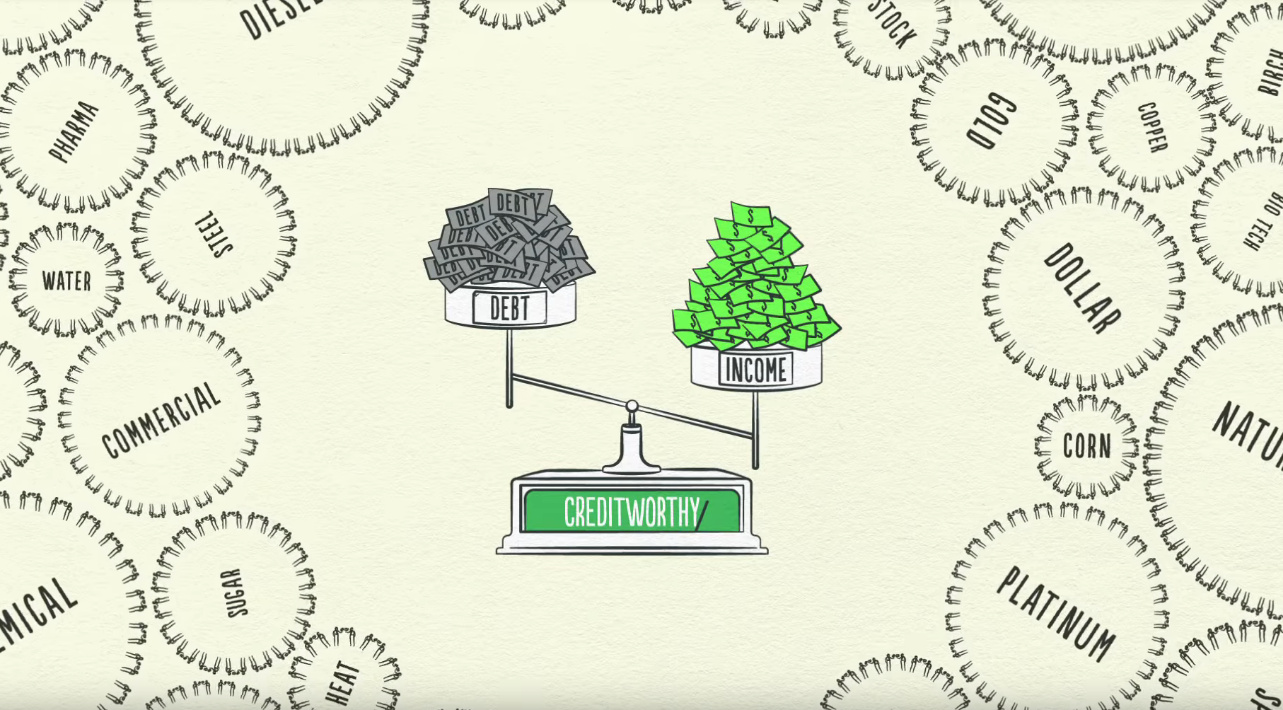
In this timeless animated video from 2013, billionaire hedge fund founder Ray Dalio eloquently explains how the world economy works in just 30 minutes.
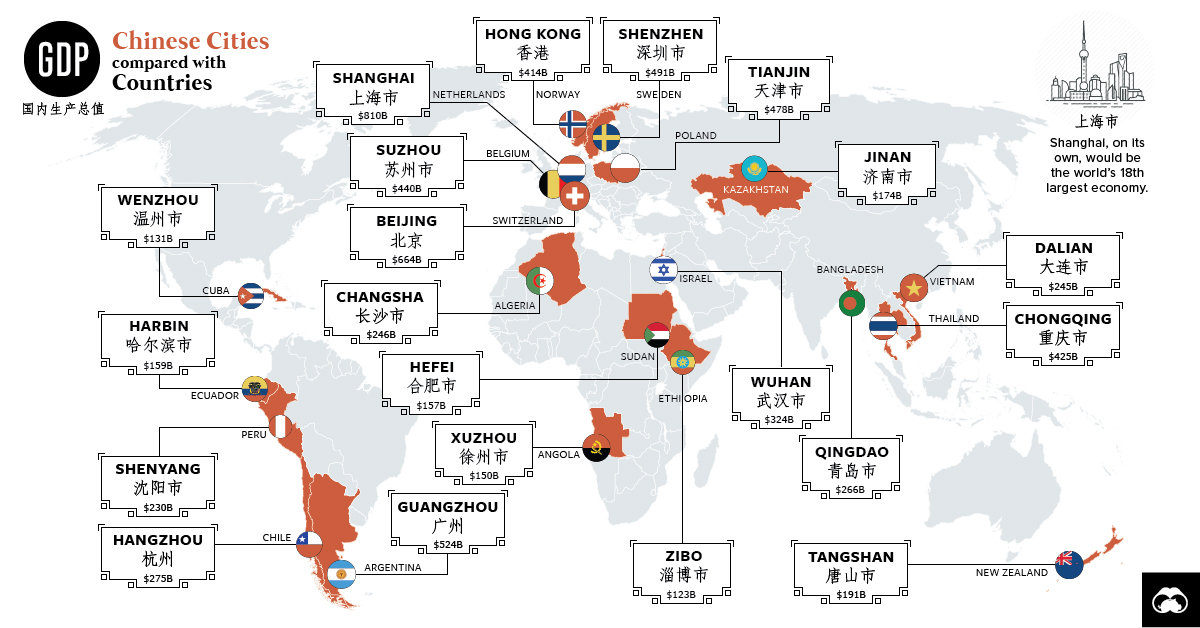
You've probably heard of Chinese cities like Beijing, Hong Kong, and Shanghai - but those actually only scratch the surface of China's economic picture.
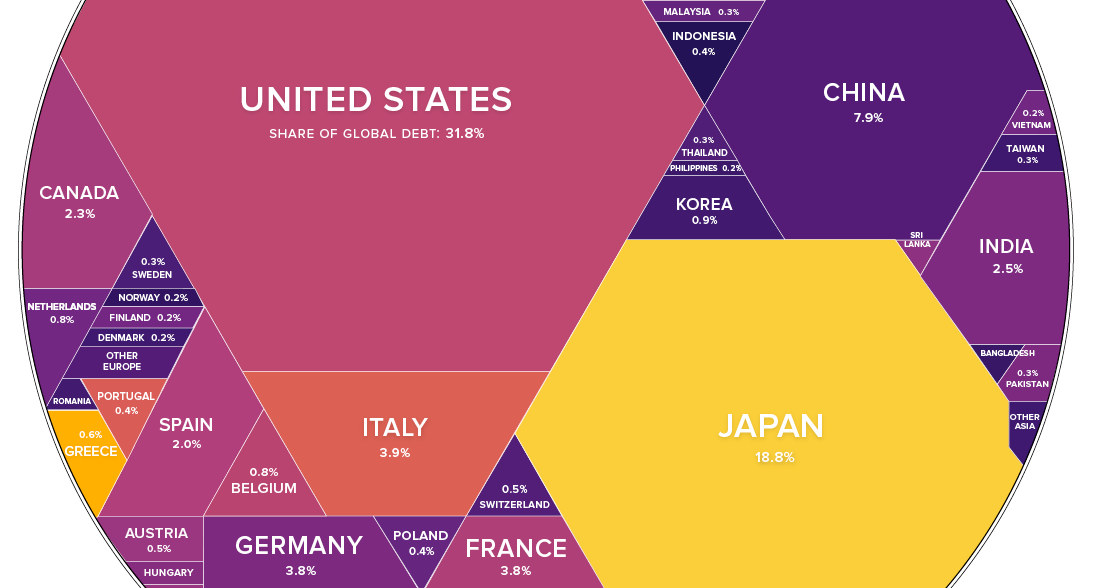
How much debt has been racked up by governments? This stunning infographic shows each country's share of world debt, along with their debt-to-GDP ratio.
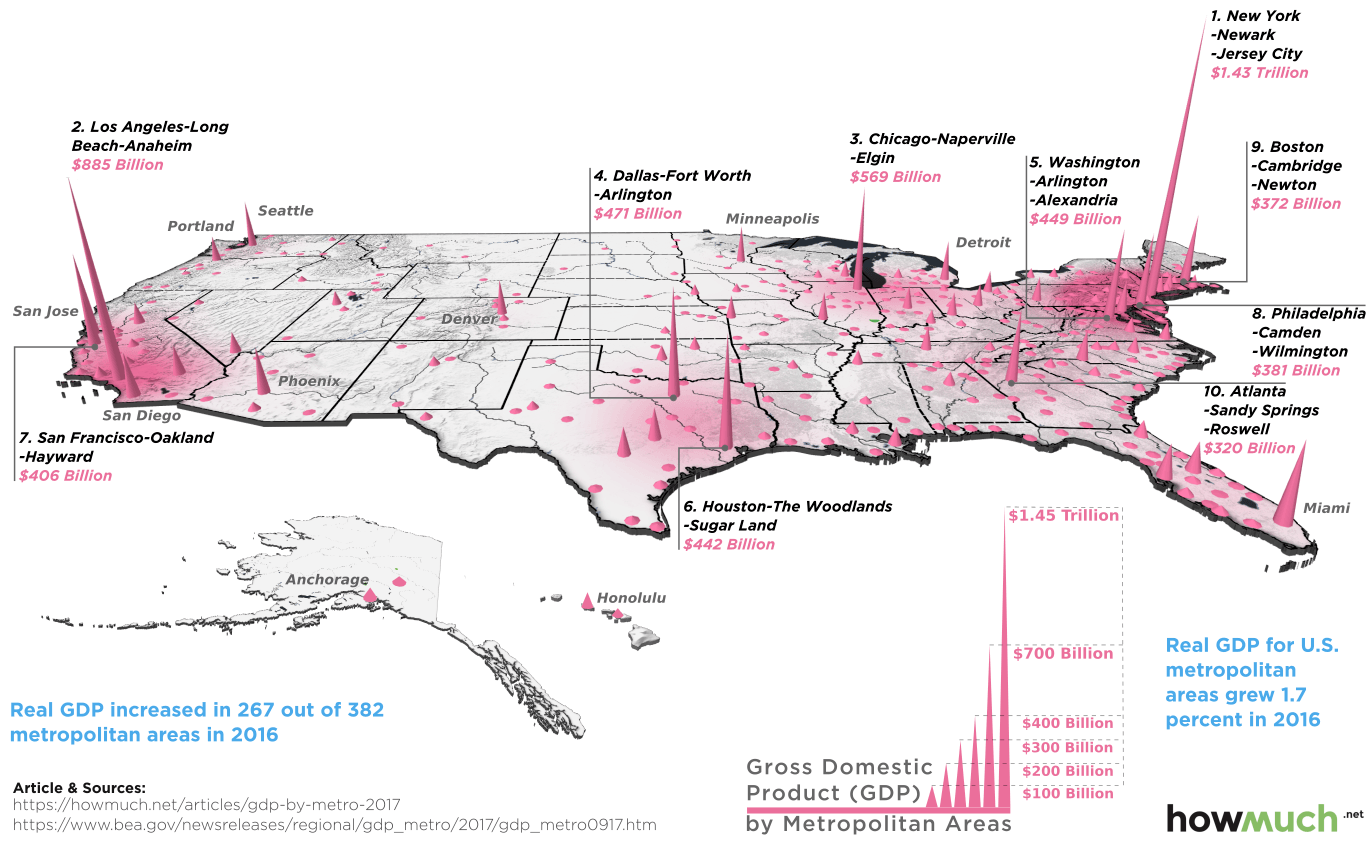
Which cities have the highest economic production in the country? This 3d map highlights GDP by metro area based on recent data.
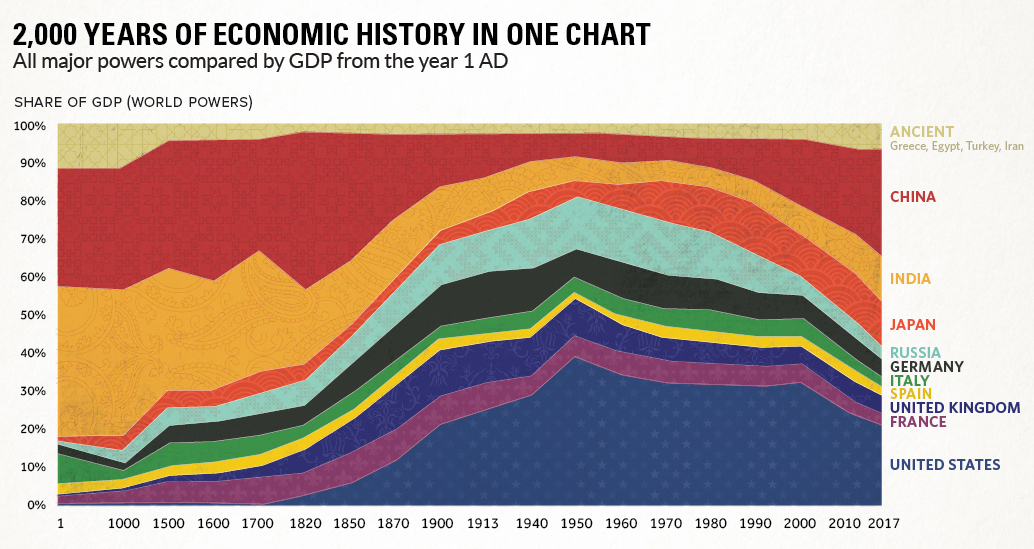
This chart compares the economies of major powers from 1AD all the way until today, showing the impact of the Industrial Revolution and re-emergence of Asia.
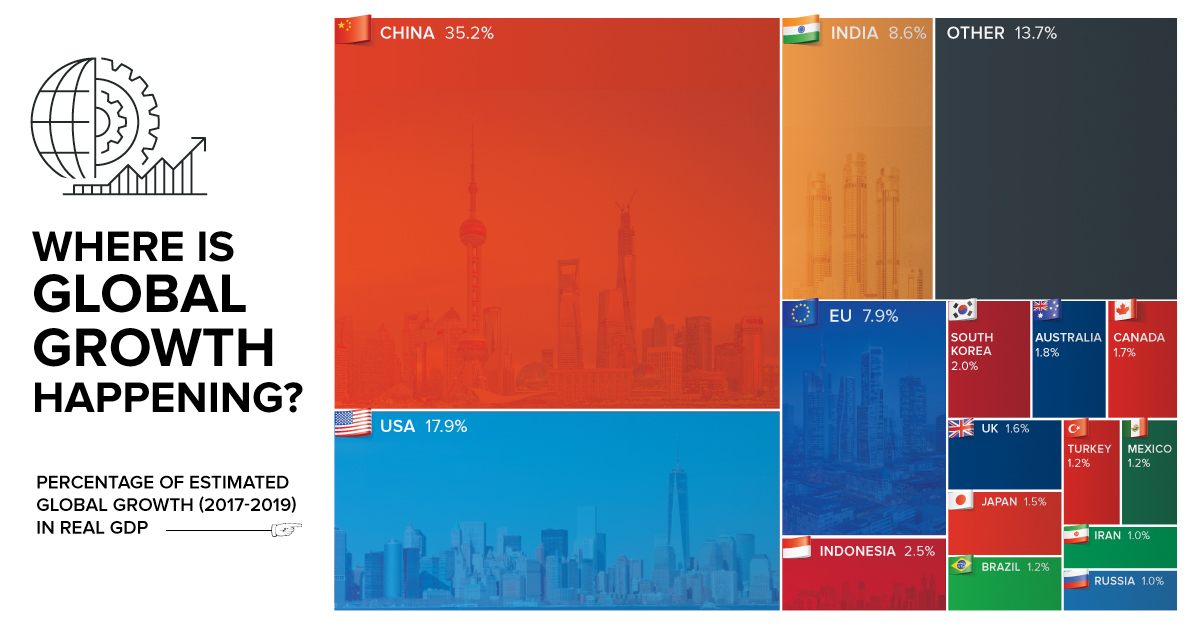
By 2019, the global economy is projected to expand another $6.5 trillion. Today's chart shows which countries will help to fuel this global growth.
The American Society of Civil Engineers says that if the growing infrastructure gap is not closed, it will create a $4 trillion drag on U.S. GDP...


