Datastream
Suez Canal: Critical Waterway Comes to a Halt


The Briefing
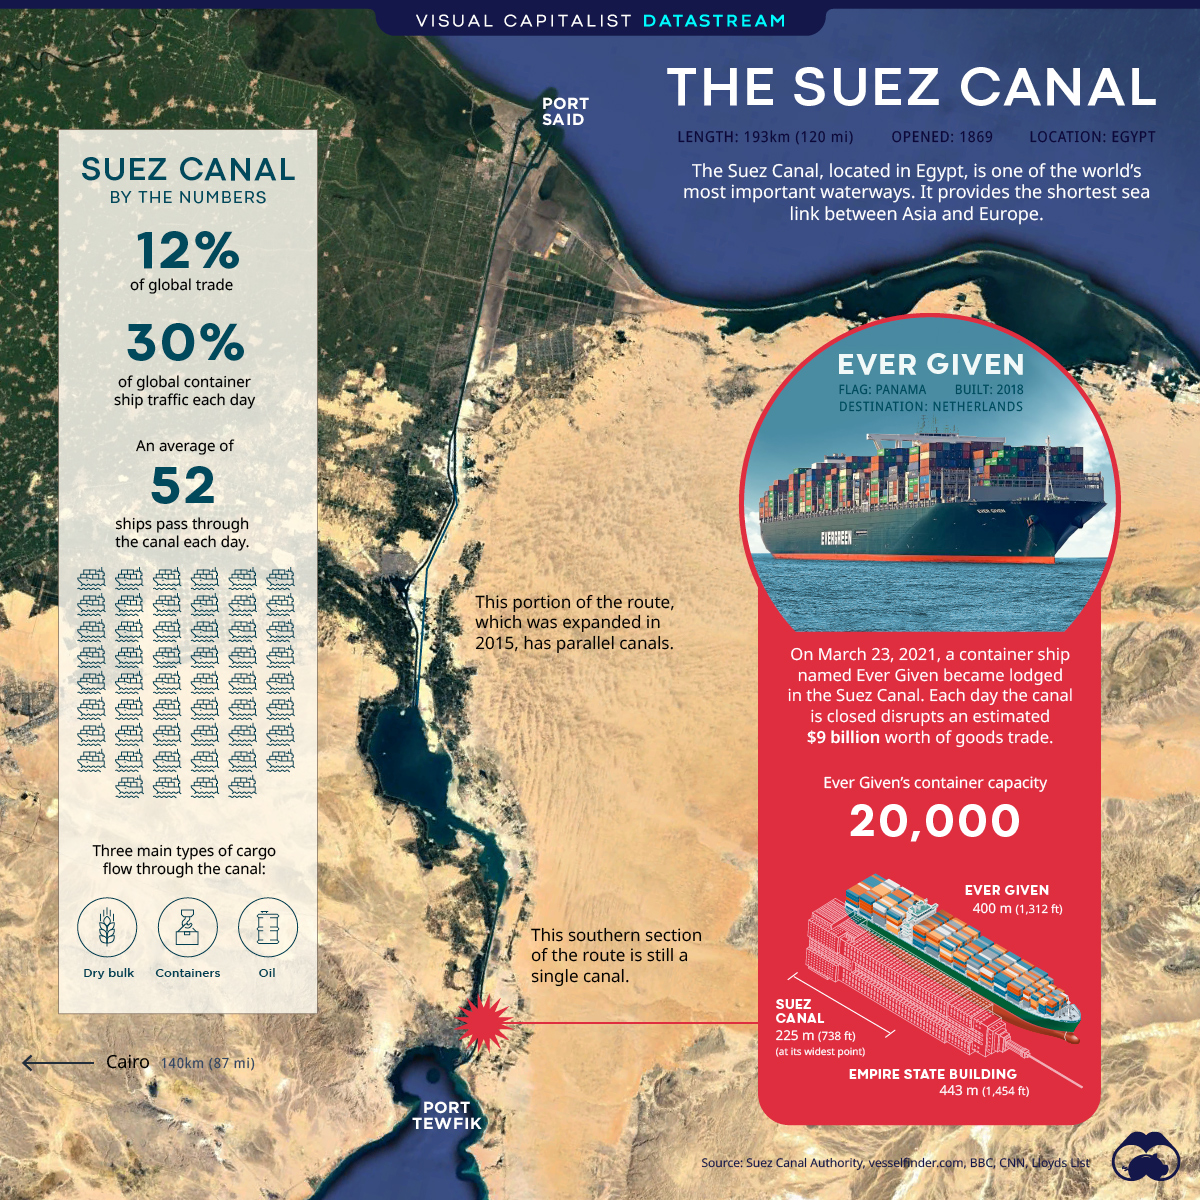
- The Suez Canal is one of the world’s most important waterways, connecting Asia and Europe
- On March 23, 2021, the Ever Given container ship ran aground, blocking transit in both directions
The Suez Canal: A Critical Waterway Comes to a Halt
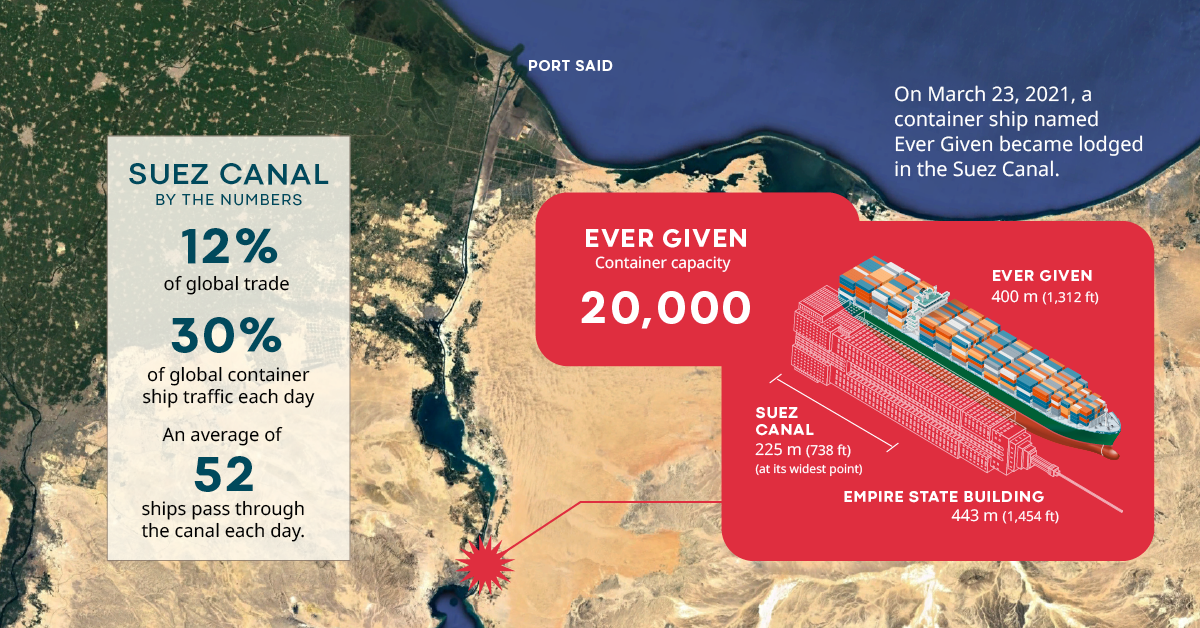
On March 23, 2021, a massive ship named Ever Given became lodged in the Suez Canal, completely blocking traffic in both directions. According to the Suez Canal Authority, the 1,312 foot long (400 m) container ship ran aground during a sandstorm that caused low visibility, impacting the ship’s navigation. The vessel is owned by Taiwanese shipping firm, Evergreen Marine.
With over 200 vessels halted on either side of the canal, authorities are scrambling to dislodge the container ship and resume normal operations. This has proven to be a difficult task so far, and experts are warning that the process could take weeks.
What is the Suez Canal?
Constructed in 1869, the Suez Canal is an Egyptian sea-level waterway that provides a vital shipping route between Europe and Asia. Without this route, ships would need to sail around Africa, adding an entire week to their trips.
The connecting link between two important regional economies, the canal facilitates a significant amount of trade. The Suez Canal Authority (SCA) reported that 19,000 vessels—averaging to 52 a day—had sailed through its waters in 2020.
| Year | Number of Vessels | Amount of Cargo (Tons) |
|---|---|---|
| 2011 | 17,800 | 692M |
| 2012 | 17,224 | 740M |
| 2013 | 16,596 | 754M |
| 2014 | 17,148 | 822M |
| 2015 | 17,483 | 823M |
| 2016 | 16,833 | 819M |
| 2017 | 17,550 | 909M |
| 2018 | 18,174 | 983M |
| 2019 | 18,880 | 1,031M |
| 2020 | 18,829 | 1,170M |
The total volume of cargo being transported through the canal has increased steadily in recent years. This includes consumer goods, dry-bulk cargo such as grain and minerals, and oil products.
Implications of the Blockage
The blockage of such an important shipping route is bound to have consequences. According to Lloyd’s List, each day the Suez Canal is closed disrupts over $9 billion worth of goods trade.
European officials have also voiced concern about longer-term impacts, particularly after the blockage is cleared. A sudden influx of ships could cause massive congestion at European ports and further disrupt supply chains.
»Want to learn more? Check out this infographic on global shipping container traffic.
Where does this data come from?
Source: Suez Canal Authority, Vesselfinder.com, BBC, CNN, Lloyds List


Datastream
Can You Calculate Your Daily Carbon Footprint?
Discover how the average person’s carbon footprint impacts the environment and learn how carbon credits can offset your carbon footprint.


The Briefing
- A person’s carbon footprint is substantial, with activities such as food consumption creating as much as 4,500 g of CO₂ emissions daily.
- By purchasing carbon credits from Carbon Streaming Corporation, you can offset your own emissions and fund positive climate action.
Your Everyday Carbon Footprint
While many large businesses and countries have committed to net-zero goals, it is essential to acknowledge that your everyday activities also contribute to global emissions.
In this graphic, sponsored by Carbon Streaming Corporation, we will explore how the choices we make and the products we use have a profound impact on our carbon footprint.
Carbon Emissions by Activity
Here are some of the daily activities and products of the average person and their carbon footprint, according to Clever Carbon.
| Household Activities & Products | CO2 Emissions (g) |
|---|---|
| 💡 Standard Light Bulb (100 watts, four hours) | 172 g |
| 📱 Mobile Phone Use (195 minutes per day)* | 189 g |
| 👕 Washing Machine (0.63 kWh) | 275 g |
| 🔥 Electric Oven (1.56 kWh) | 675 g |
| ♨️ Tumble Dryer (2.5 kWh) | 1,000 g |
| 🧻 Toilet Roll (2 ply) | 1,300 g |
| 🚿 Hot Shower (10 mins) | 2,000 g |
| 🚙 Daily Commute (one hour, by car) | 3,360 g |
| 🍽️ Average Daily Food Consumption (three meals of 600 calories) | 4,500 g |
| *Phone use based on yearly use of 69kg per the source, Reboxed | |
Your choice of transportation plays a crucial role in determining your carbon footprint. For instance, a 15 km daily commute to work on public transport generates an average of 1,464 g of CO₂ emissions. Compared to 3,360 g—twice the volume for a journey the same length by car.
By opting for more sustainable modes of transport, such as cycling, walking, or public transportation, you can significantly reduce your carbon footprint.
Addressing Your Carbon Footprint
One way to compensate for your emissions is by purchasing high-quality carbon credits.
Carbon credits are used to help fund projects that avoid, reduce or remove CO₂ emissions. This includes nature-based solutions such as reforestation and improved forest management, or technology-based solutions such as the production of biochar and carbon capture and storage (CCS).
While carbon credits offer a potential solution for individuals to help reduce global emissions, public awareness remains a significant challenge. A BCG-Patch survey revealed that only 34% of U.S. consumers are familiar with carbon credits, and only 3% have purchased them in the past.
About Carbon Streaming
By financing the creation or expansion of carbon projects, Carbon Streaming Corporation secures the rights to future carbon credits generated by these sustainable projects. You can then purchase these carbon credits to help fund climate solutions around the world and compensate for your own emissions.
Ready to get involved?
>> Learn more about purchasing carbon credits at Carbon Streaming

-

 Education1 week ago
How Hard Is It to Get Into an Ivy League School?
-

 Technology2 weeks ago
Ranked: Semiconductor Companies by Industry Revenue Share
-

 Markets2 weeks ago
Ranked: The World’s Top Flight Routes, by Revenue
-

 Demographics2 weeks ago
Population Projections: The World’s 6 Largest Countries in 2075
-

 Markets2 weeks ago
The Top 10 States by Real GDP Growth in 2023
-

 Demographics2 weeks ago
The Smallest Gender Wage Gaps in OECD Countries
-

 Economy2 weeks ago
Where U.S. Inflation Hit the Hardest in March 2024
-

 Green2 weeks ago
Top Countries By Forest Growth Since 2001