Datastream
Visualizing the Most Used Languages on the Internet


The Briefing
- English is the most common language online, used by 60.4% of the top 10M websites
- China has the most internet users in the world but only 1.4% of the top 10M websites use Chinese
The Most Used Languages on the Internet
Online content on the world wide web is consumed in thousands of different languages.
Some are more common than others, but it’s interesting to see that the online use of a language doesn’t always reflect how many people speak it. For example, Hindi is the third most spoken language worldwide, but it isn’t one of the top languages used on the internet.
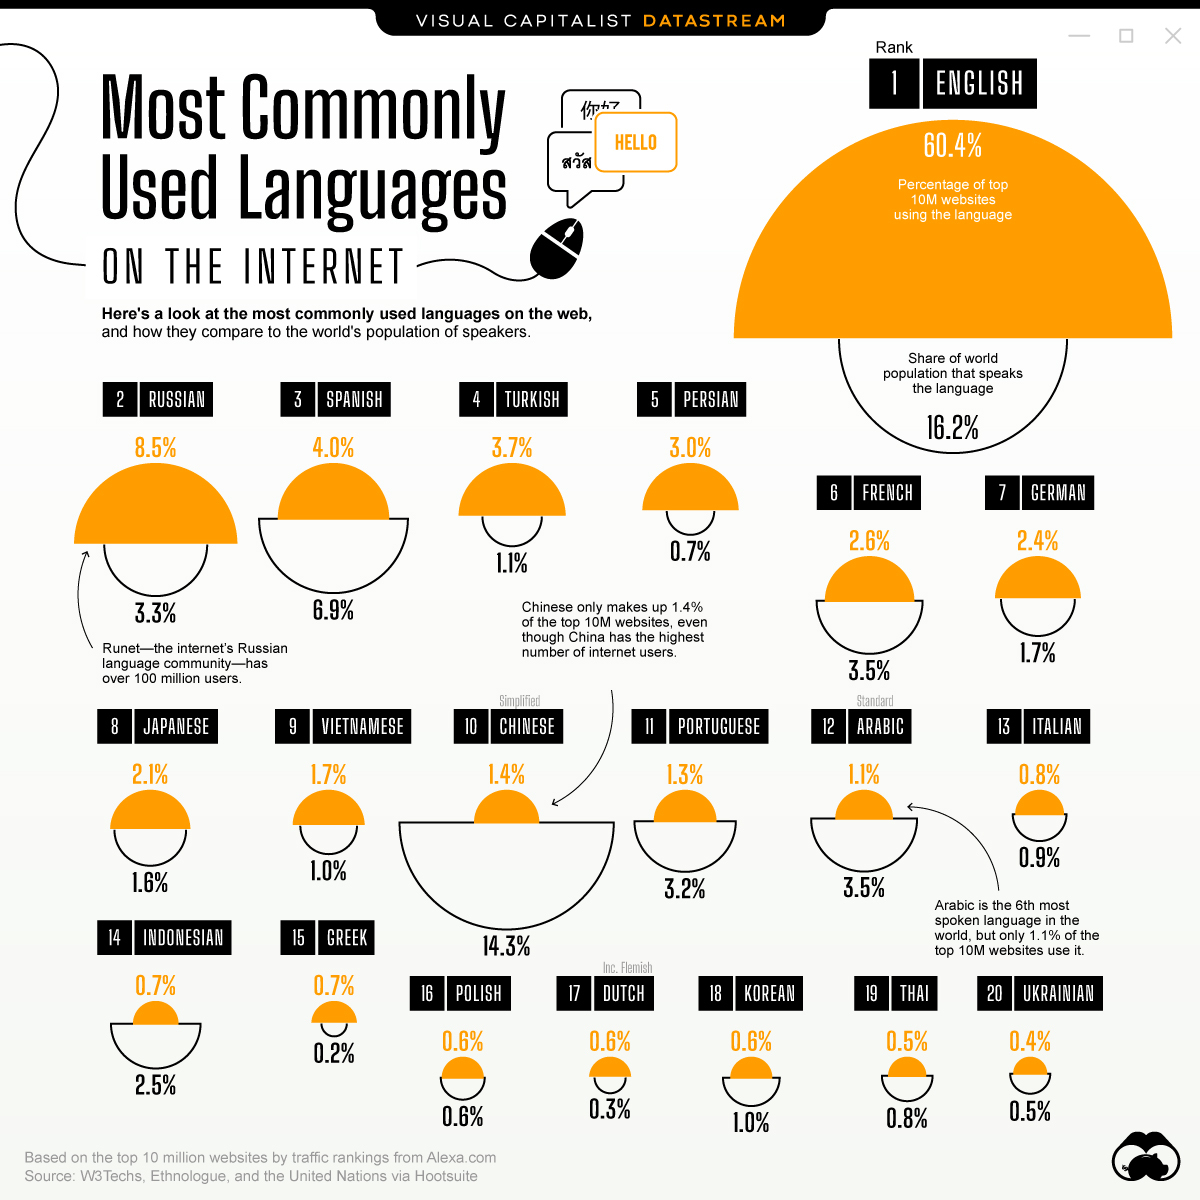
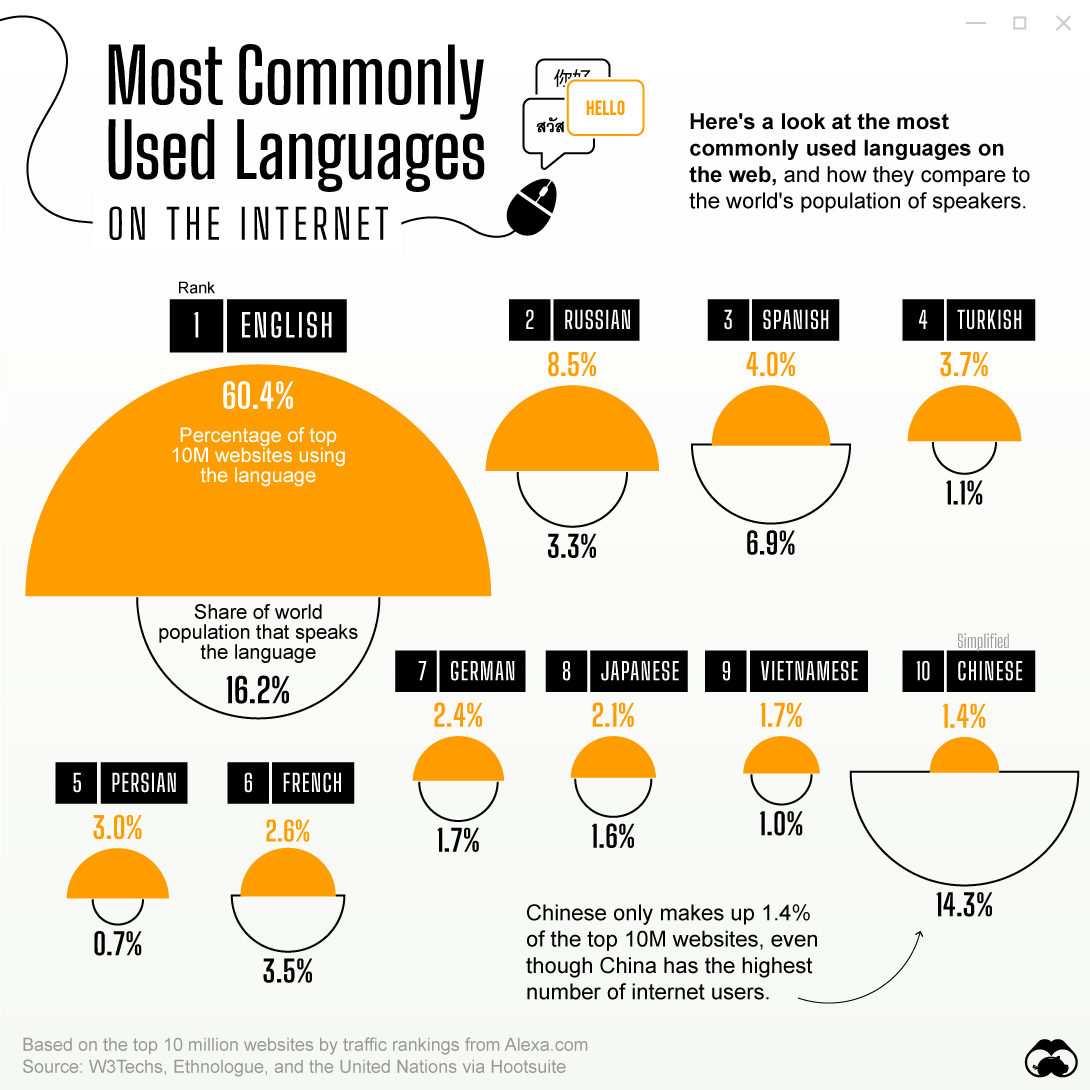
Here’s a look at the top 20 most used languages on the internet, compared to their real-world use among the global population.
| Rank | Language | % of Top 10M Websites | Share of Speaking Population |
|---|---|---|---|
| 1 | English | 60.4% | 16.2% |
| 2 | Russian | 8.5% | 3.3% |
| 3 | Spanish | 4.0% | 6.9% |
| 4 | Turkish | 3.7% | 1.1% |
| 5 | Persian | 3.0% | 0.7% |
| 6 | French | 2.6% | 3.5% |
| 7 | German | 2.4% | 1.7% |
| 8 | Japanese | 2.1% | 1.6% |
| 9 | Vietnamese | 1.7% | 1.0% |
| 10 | Simplified Chinese | 1.4% | 14.3% |
| 11 | Portuguese | 1.3% | 3.2% |
| 12 | Standard Arabic | 1.1% | 3.5% |
| 13 | Italian | 0.8% | 0.9% |
| 14 | Indonesian | 0.7% | 2.5% |
| 15 | Greek | 0.7% | 0.2% |
| 16 | Polish | 0.6% | 0.6% |
| 17 | Dutch | 0.6% | 0.3% |
| 18 | Korean | 0.6% | 1.0% |
| 19 | Thai | 0.5% | 0.8% |
| 20 | Ukrainian | 0.4% | 0.5% |
“Share of speaking population” refers to the percentage of the global population that identifies as a speaker of a particular language, either as their native tongue or a second language. Data as of January 2021.
English is by far the most commonly used language online, used by 60.4%, or about six million of the top 10 million websites. Not surprisingly, it’s also the most spoken language worldwide, with over 1.13 billion speakers.
By contrast, Chinese is spoken by 14.3% of the global population–more than 1.11 billion people—but it’s only used by 1.4% of the top 10 million websites.
Interestingly, Russian takes the second spot in the ranking in part due to the significant online presence of Runet, the internet’s Russian language community. Furthermore, it’s also the official language of multiple countries that were formerly part of the Soviet Union.
The Future of Languages on the Web
Although it’s likely that English and Russian will continue to dominate the web, Asian languages have the highest potential for growth in internet usage.
With an untapped audience of more than 1 billion people, the share of languages like Chinese and Arabic may grow alongside the region’s online population.
Where does this data come from?
Source: W3Techs, Ethnologue, and the United Nations via Hootsuite
Details: Based on the top 10 million websites by traffic rankings from Alexa.com.


Datastream
Can You Calculate Your Daily Carbon Footprint?
Discover how the average person’s carbon footprint impacts the environment and learn how carbon credits can offset your carbon footprint.


The Briefing
- A person’s carbon footprint is substantial, with activities such as food consumption creating as much as 4,500 g of CO₂ emissions daily.
- By purchasing carbon credits from Carbon Streaming Corporation, you can offset your own emissions and fund positive climate action.
Your Everyday Carbon Footprint
While many large businesses and countries have committed to net-zero goals, it is essential to acknowledge that your everyday activities also contribute to global emissions.
In this graphic, sponsored by Carbon Streaming Corporation, we will explore how the choices we make and the products we use have a profound impact on our carbon footprint.
Carbon Emissions by Activity
Here are some of the daily activities and products of the average person and their carbon footprint, according to Clever Carbon.
| Household Activities & Products | CO2 Emissions (g) |
|---|---|
| 💡 Standard Light Bulb (100 watts, four hours) | 172 g |
| 📱 Mobile Phone Use (195 minutes per day)* | 189 g |
| 👕 Washing Machine (0.63 kWh) | 275 g |
| 🔥 Electric Oven (1.56 kWh) | 675 g |
| ♨️ Tumble Dryer (2.5 kWh) | 1,000 g |
| 🧻 Toilet Roll (2 ply) | 1,300 g |
| 🚿 Hot Shower (10 mins) | 2,000 g |
| 🚙 Daily Commute (one hour, by car) | 3,360 g |
| 🍽️ Average Daily Food Consumption (three meals of 600 calories) | 4,500 g |
| *Phone use based on yearly use of 69kg per the source, Reboxed | |
Your choice of transportation plays a crucial role in determining your carbon footprint. For instance, a 15 km daily commute to work on public transport generates an average of 1,464 g of CO₂ emissions. Compared to 3,360 g—twice the volume for a journey the same length by car.
By opting for more sustainable modes of transport, such as cycling, walking, or public transportation, you can significantly reduce your carbon footprint.
Addressing Your Carbon Footprint
One way to compensate for your emissions is by purchasing high-quality carbon credits.
Carbon credits are used to help fund projects that avoid, reduce or remove CO₂ emissions. This includes nature-based solutions such as reforestation and improved forest management, or technology-based solutions such as the production of biochar and carbon capture and storage (CCS).
While carbon credits offer a potential solution for individuals to help reduce global emissions, public awareness remains a significant challenge. A BCG-Patch survey revealed that only 34% of U.S. consumers are familiar with carbon credits, and only 3% have purchased them in the past.
About Carbon Streaming
By financing the creation or expansion of carbon projects, Carbon Streaming Corporation secures the rights to future carbon credits generated by these sustainable projects. You can then purchase these carbon credits to help fund climate solutions around the world and compensate for your own emissions.
Ready to get involved?
>> Learn more about purchasing carbon credits at Carbon Streaming

-

 Markets1 week ago
U.S. Debt Interest Payments Reach $1 Trillion
-

 Markets2 weeks ago
Ranked: The Most Valuable Housing Markets in America
-

 Money2 weeks ago
Which States Have the Highest Minimum Wage in America?
-

 AI2 weeks ago
Ranked: Semiconductor Companies by Industry Revenue Share
-

 Markets2 weeks ago
Ranked: The World’s Top Flight Routes, by Revenue
-

 Countries2 weeks ago
Population Projections: The World’s 6 Largest Countries in 2075
-

 Markets2 weeks ago
The Top 10 States by Real GDP Growth in 2023
-

 Money2 weeks ago
The Smallest Gender Wage Gaps in OECD Countries