Markets
Mapped: The State of Small Business Recovery in America


Mapped: The State of Small Business Recovery in America
In the business news cycle, headlines are often dominated by large corporations, macroeconomic news, or government action.
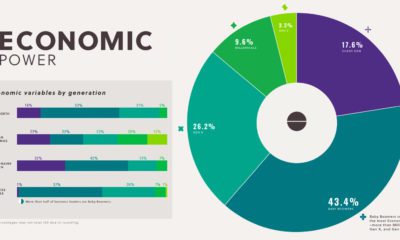
While mom and pop might not always be in focus, collectively small businesses are a powerful and influential piece of the economy. In fact, 99.9% of all businesses in the U.S. qualify as small businesses, collectively employing almost half (47.3%) of the nation’s private workforce.
Unfortunately, they’ve also been one of the hardest-hit sectors of the economy amid the pandemic. From the CARES Act to the new budget proposal, billions of dollars have been allocated towards helping small businesses to get back on their feet.
Small Business Recovery in 50 Metro Areas
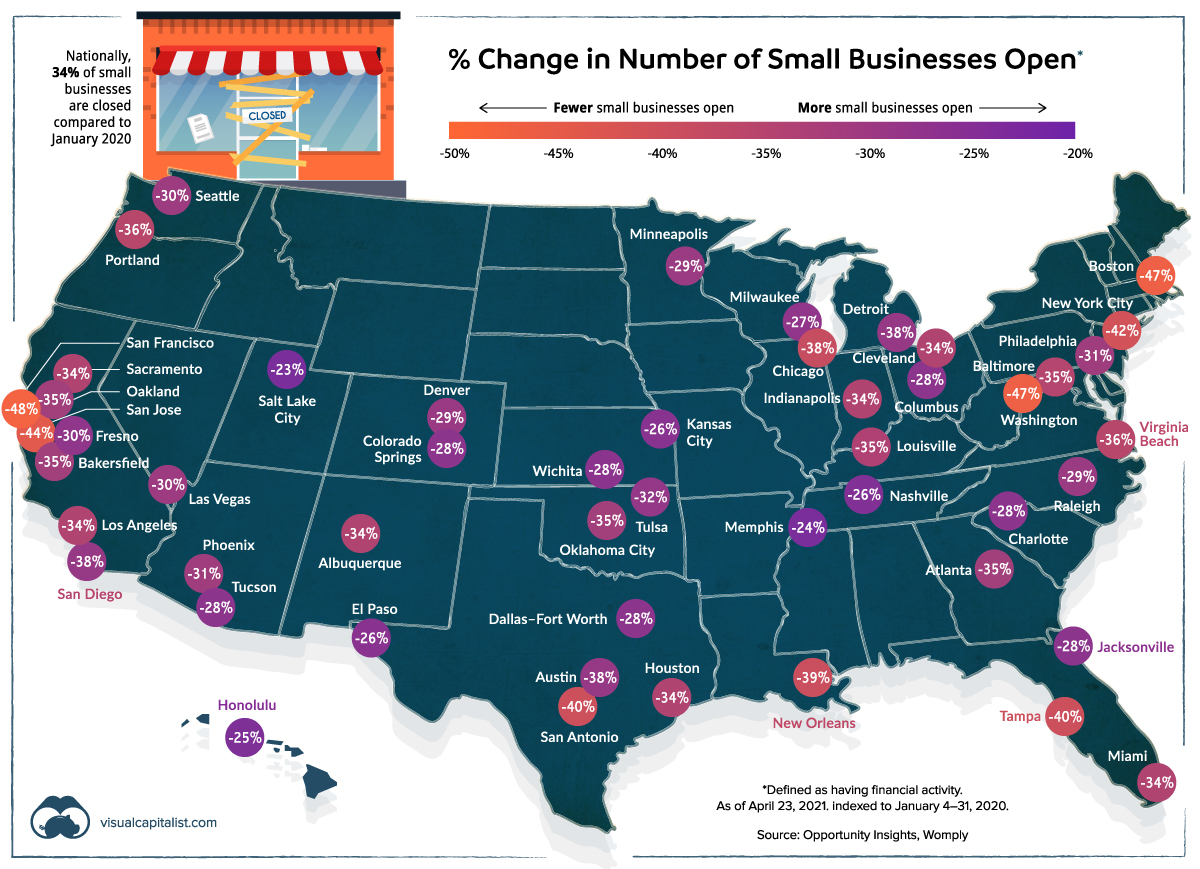
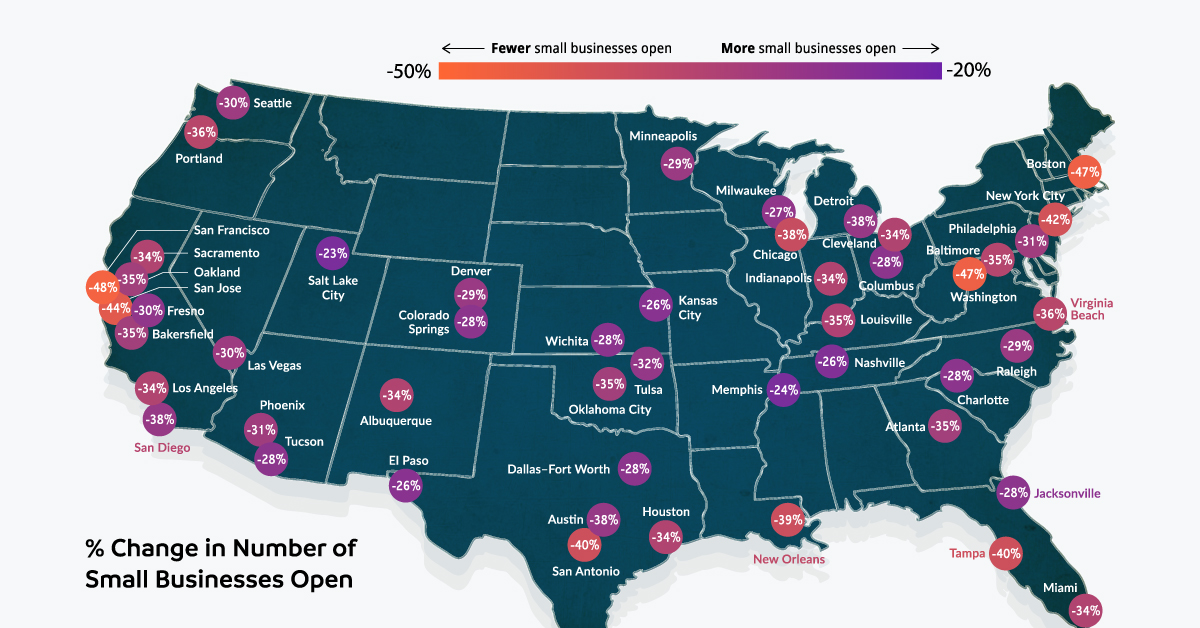
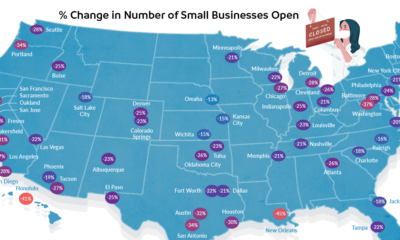
During the pandemic, many small businesses have either swiftly pivoted to survive, or struggled to stay afloat. This map pulls data from Opportunity Insights to examine the small business recovery rate in 50 metro areas across America.
So, has the situation improved since the last time we examined this data? The short answer is no—on a national scale, 34% of small businesses are closed compared to January 2020.
San Francisco is one of the most affected metro areas, with a 48% closure rate of small businesses. New York City has spiralled the most since the end of September 2020.
| U.S. Metro Area | % Change in # of Small Businesses Open (As of Sep 25, 2020) | % Change in # of Small Businesses Open (As of Apr 23, 2021) | 7-month change (p.p.) |
|---|---|---|---|
| Albuquerque | -23% | -34% | -11 |
| Atlanta | -26% | -35% | -9 |
| Austin | -32% | -38% | -6 |
| Bakersfield | -31% | -35% | -4 |
| Baltimore | -28% | -35% | -7 |
| Boston | -33% | -47% | -14 |
| Charlotte | -18% | -28% | -10 |
| Chicago | -27% | -38% | -11 |
| Cleveland | -26% | -34% | -8 |
| Colorado Springs | -23% | -28% | -5 |
| Columbus | -21% | -28% | -7 |
| Dallas-Fort Worth | -21% | -28% | -7 |
| Denver | -25% | -29% | -4 |
| Detroit | -28% | -38% | -10 |
| El Paso | -25% | -26% | -1 |
| Fresno | -26% | -30% | -4 |
| Honolulu | -41% | -25% | +16 |
| Houston | -30% | -34% | -4 |
| Indianapolis | -25% | -34% | -9 |
| Jacksonville | -18% | -28% | -10 |
| Kansas City | -15% | -26% | -11 |
| Las Vegas | -22% | -30% | -8 |
| Los Angeles | -27% | -34% | -7 |
| Louisville | -23% | -35% | -12 |
| Memphis | -21% | -24% | -3 |
| Miami | -23% | -34% | -11 |
| Milwaukee | -22% | -27% | -5 |
| Minneapolis | -21% | -29% | -8 |
| Nashville | -21% | -26% | -5 |
| New Orleans | -45% | -39% | +6 |
| New York City | -21% | -42% | -21 |
| Oakland | -32% | -35% | -3 |
| Oklahoma City | -26% | -35% | -9 |
| Philadelphia | -24% | -31% | -7 |
| Phoenix | -19% | -31% | -12 |
| Portland | -34% | -36% | -2 |
| Raleigh | -16% | -29% | -13 |
| Sacramento | -33% | -34% | -1 |
| Salt Lake City | -18% | -23% | -5 |
| San Antonio | -34% | -40% | -6 |
| San Diego | -28% | -38% | -10 |
| San Francisco | -49% | -48% | +2 |
| San Jose | -35% | -44% | -9 |
| Seattle | -28% | -30% | -2 |
| Tampa | -22% | -40% | -18 |
| Tucson | -27% | -28% | -1 |
| Tulsa | -23% | -32% | -9 |
| Virginia Beach | - | -36% | 0 |
| Washington DC | -37% | -47% | -10 |
| Wichita | -15% | -28% | -13 |
Data as of Apr 23, 2021 and indexed to Jan 4-31, 2020.
On the flip side, Honolulu has seen the most improvement. As travel and tourism numbers into Hawaii have steadily risen up with lifted nationwide restrictions, there has been a 16 p.p. increase in open businesses compared to September 2020.
Road to a K-Shaped Recovery
As of April 25, 2021, nearly 42% of the U.S. population has received at least one dose of a COVID-19 vaccine. However, even with this rapid vaccine rollout, various segments of the economy aren’t recovering at the same pace.
Take for instance the stark difference between professional services and the leisure and hospitality sector. Though small business revenues in both segments have yet to return to pre-pandemic levels, the latter has much more catching up to do:
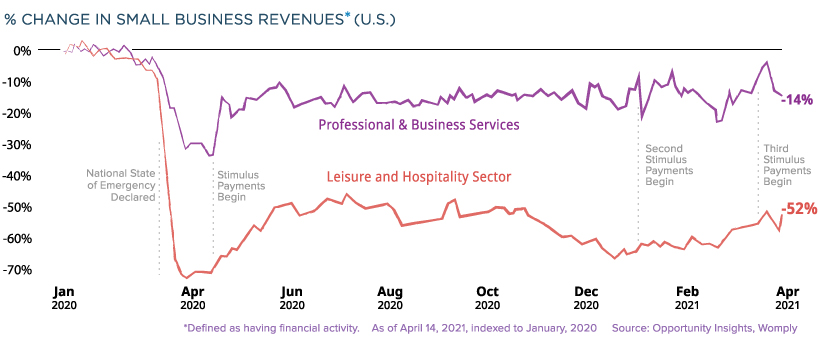
This uneven phenomena is known as a K-shaped recovery, where some industries see more improvement compared to others that stagnate in the aftermath of a recession.
The Entrepreneurial Spirit Endures
Despite these continued hardships, it appears that many Americans have not been deterred from starting their own businesses.
Many small businesses require an Employer Identification Number (EIN) which makes EIN applications a good proxy for business formation activity. Despite an initial dip in the early months of the pandemic, there has been a dramatic spike in EIN business applications.
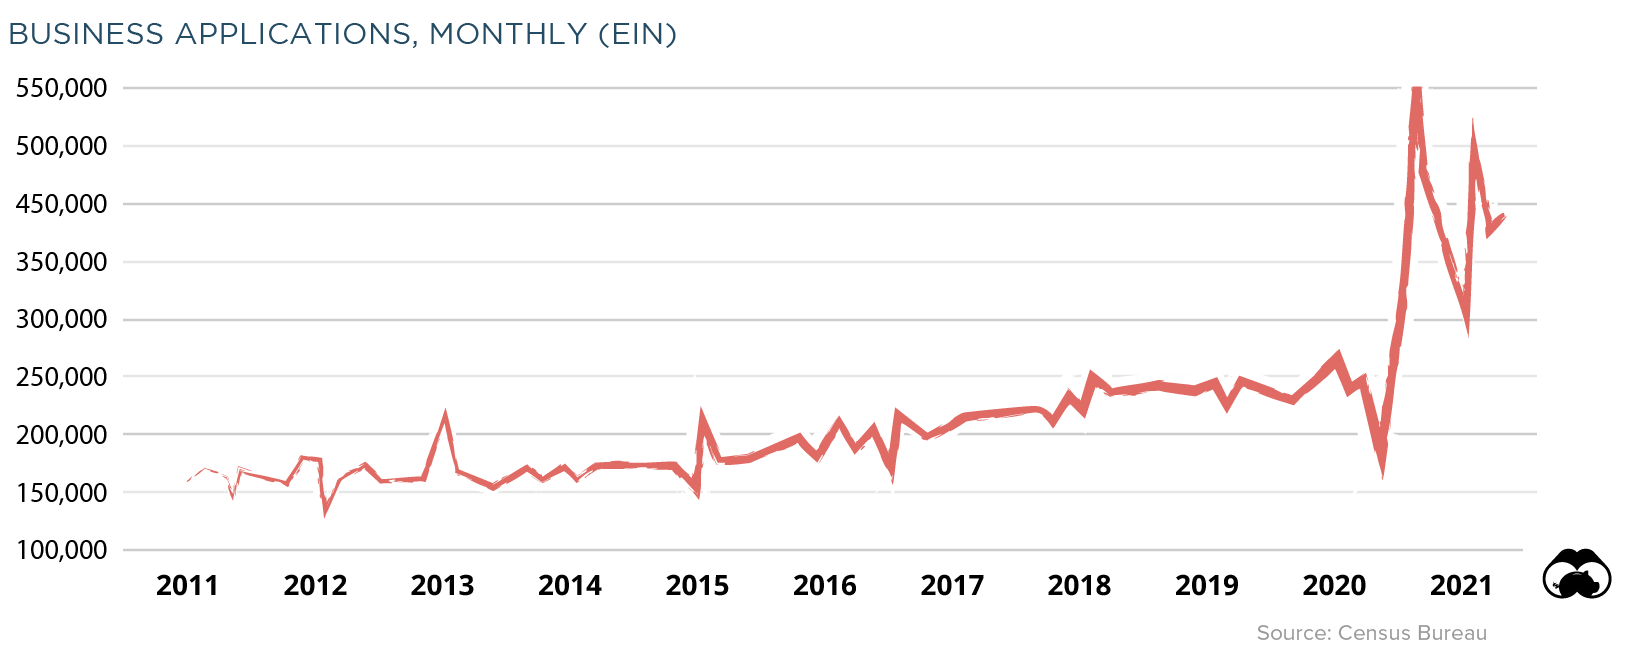
Even in the face of a global pandemic, the perseverance of such metrics prove that the innovative American spirit is unwavering, and spells better days to come for small business recovery.


Markets
The European Stock Market: Attractive Valuations Offer Opportunities
On average, the European stock market has valuations that are nearly 50% lower than U.S. valuations. But how can you access the market?


European Stock Market: Attractive Valuations Offer Opportunities
Europe is known for some established brands, from L’Oréal to Louis Vuitton. However, the European stock market offers additional opportunities that may be lesser known.
The above infographic, sponsored by STOXX, outlines why investors may want to consider European stocks.
Attractive Valuations
Compared to most North American and Asian markets, European stocks offer lower or comparable valuations.
| Index | Price-to-Earnings Ratio | Price-to-Book Ratio |
|---|---|---|
| EURO STOXX 50 | 14.9 | 2.2 |
| STOXX Europe 600 | 14.4 | 2 |
| U.S. | 25.9 | 4.7 |
| Canada | 16.1 | 1.8 |
| Japan | 15.4 | 1.6 |
| Asia Pacific ex. China | 17.1 | 1.8 |
Data as of February 29, 2024. See graphic for full index names. Ratios based on trailing 12 month financials. The price to earnings ratio excludes companies with negative earnings.
On average, European valuations are nearly 50% lower than U.S. valuations, potentially offering an affordable entry point for investors.
Research also shows that lower price ratios have historically led to higher long-term returns.
Market Movements Not Closely Connected
Over the last decade, the European stock market had low-to-moderate correlation with North American and Asian equities.
The below chart shows correlations from February 2014 to February 2024. A value closer to zero indicates low correlation, while a value of one would indicate that two regions are moving in perfect unison.
| EURO STOXX 50 | STOXX EUROPE 600 | U.S. | Canada | Japan | Asia Pacific ex. China |
|
|---|---|---|---|---|---|---|
| EURO STOXX 50 | 1.00 | 0.97 | 0.55 | 0.67 | 0.24 | 0.43 |
| STOXX EUROPE 600 | 1.00 | 0.56 | 0.71 | 0.28 | 0.48 | |
| U.S. | 1.00 | 0.73 | 0.12 | 0.25 | ||
| Canada | 1.00 | 0.22 | 0.40 | |||
| Japan | 1.00 | 0.88 | ||||
| Asia Pacific ex. China | 1.00 |
Data is based on daily USD returns.
European equities had relatively independent market movements from North American and Asian markets. One contributing factor could be the differing sector weights in each market. For instance, technology makes up a quarter of the U.S. market, but health care and industrials dominate the broader European market.
Ultimately, European equities can enhance portfolio diversification and have the potential to mitigate risk for investors.
Tracking the Market
For investors interested in European equities, STOXX offers a variety of flagship indices:
| Index | Description | Market Cap |
|---|---|---|
| STOXX Europe 600 | Pan-regional, broad market | €10.5T |
| STOXX Developed Europe | Pan-regional, broad-market | €9.9T |
| STOXX Europe 600 ESG-X | Pan-regional, broad market, sustainability focus | €9.7T |
| STOXX Europe 50 | Pan-regional, blue-chip | €5.1T |
| EURO STOXX 50 | Eurozone, blue-chip | €3.5T |
Data is as of February 29, 2024. Market cap is free float, which represents the shares that are readily available for public trading on stock exchanges.
The EURO STOXX 50 tracks the Eurozone’s biggest and most traded companies. It also underlies one of the world’s largest ranges of ETFs and mutual funds. As of November 2023, there were €27.3 billion in ETFs and €23.5B in mutual fund assets under management tracking the index.
“For the past 25 years, the EURO STOXX 50 has served as an accurate, reliable and tradable representation of the Eurozone equity market.”
— Axel Lomholt, General Manager at STOXX
Partnering with STOXX to Track the European Stock Market
Are you interested in European equities? STOXX can be a valuable partner:
- Comprehensive, liquid and investable ecosystem
- European heritage, global reach
- Highly sophisticated customization capabilities
- Open architecture approach to using data
- Close partnerships with clients
- Part of ISS STOXX and Deutsche Börse Group
With a full suite of indices, STOXX can help you benchmark against the European stock market.
Learn how STOXX’s European indices offer liquid and effective market access.

-

 Economy2 days ago
Economic Growth Forecasts for G7 and BRICS Countries in 2024
The IMF has released its economic growth forecasts for 2024. How do the G7 and BRICS countries compare?
-

 Markets2 weeks ago
U.S. Debt Interest Payments Reach $1 Trillion
U.S. debt interest payments have surged past the $1 trillion dollar mark, amid high interest rates and an ever-expanding debt burden.
-

 United States2 weeks ago
Ranked: The Largest U.S. Corporations by Number of Employees
We visualized the top U.S. companies by employees, revealing the massive scale of retailers like Walmart, Target, and Home Depot.
-

 Markets2 weeks ago
The Top 10 States by Real GDP Growth in 2023
This graphic shows the states with the highest real GDP growth rate in 2023, largely propelled by the oil and gas boom.
-

 Markets2 weeks ago
Ranked: The World’s Top Flight Routes, by Revenue
In this graphic, we show the highest earning flight routes globally as air travel continued to rebound in 2023.
-

 Markets3 weeks ago
Ranked: The Most Valuable Housing Markets in America
The U.S. residential real estate market is worth a staggering $47.5 trillion. Here are the most valuable housing markets in the country.


-

 Debt1 week ago
How Debt-to-GDP Ratios Have Changed Since 2000
-
Markets2 weeks ago
Ranked: The World’s Top Flight Routes, by Revenue
-

 Countries2 weeks ago
Population Projections: The World’s 6 Largest Countries in 2075
-
Markets2 weeks ago
The Top 10 States by Real GDP Growth in 2023
-

 Demographics2 weeks ago
The Smallest Gender Wage Gaps in OECD Countries
-

 United States2 weeks ago
Where U.S. Inflation Hit the Hardest in March 2024
-

 Green2 weeks ago
Top Countries By Forest Growth Since 2001
-
United States2 weeks ago
Ranked: The Largest U.S. Corporations by Number of Employees