Business
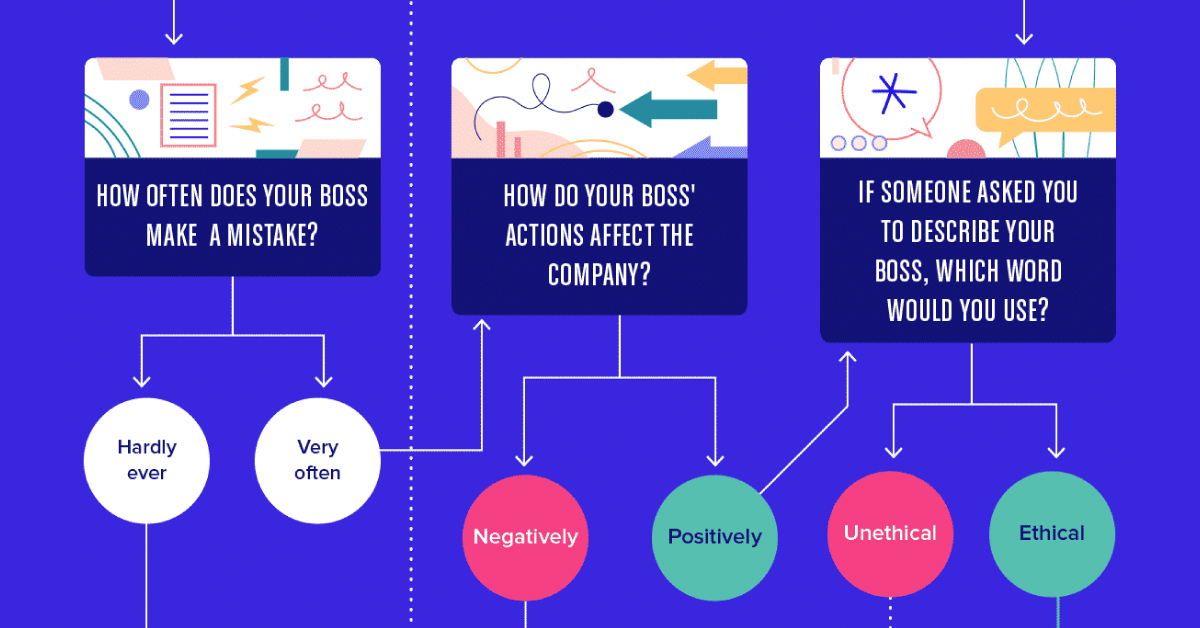
Flowchart: Are You Working for a Toxic Boss?
The experience of less-than-ideal work situations are common, and the global pandemic has likely heightened challenges for bosses and employees alike. How can mediocre or outright hostile leadership impact your ability to work well?
This flowchart from Resume.io helps you figure out if you’ve got a toxic boss weighing you down. It covers seven archetypes of toxic bosses, and how to respond to each one.
The 7 Types of Toxic Bosses
Barbara Kellerman, a professor of public leadership at the Harvard Kennedy School identifies seven types of toxic bosses that can exist.
Number | Toxic Boss Type | Description |
---|---|---|
#1 | Incompetent Boss | Unable or unwilling to do their job well |
#2 | Rigid Boss | Confuses inflexibility with strength |
#3 | Intemperate Boss | Lacks self-knowledge and self-control |
#4 | Callous Boss | Lacks empathy and kindness |
#5 | Corrupt Boss | Steals or cheats to promote their own interests |
#6 | Insular Boss | Is cliquish or unreachable |
#7 | Evil Boss | Causes pain to further their sense of power and dominance |
Some bosses simply don’t have the capacity to do their jobs, which makes it more difficult for their employees. Others can be corrupt or callous, creating a highly unmotivating work environment.
But how many people are in this situation?
To give a few quick examples, around 13% of all employees in Europe work under a toxic boss. In the U.S., a whopping 75% say they have left a job primarily because of a bad boss.
What’s so Bad about a Bad Boss?
Bosses can make or break your job experience. Having a toxic boss can cause your quality of work to suffer, which can then trickle down to impact your overall career.
In fact, Harvard Business Review found that a toxic work environment can lead to decreased motivation and employee disengagement. This has significant knock-on effects such as:
- 37% higher absenteeism
- 60% more errors in their work
- 18% lower productivity
According to the same study, this can cause companies to have 16% lower profitability and a 65% lower share price over time.
The physical side effects are not to be underestimated, either. One Swedish study found that a bad boss who increases your job strain can, in tandem, increase your chance of cardiac arrest by 50%. Additionally, a study out of Stanford found that mismanagement in the American workplace and subsequent stress could potentially be responsible for 120,000 deaths per year.
Tips to Deal with a Toxic Boss
Bad bosses can hurt the company, the overall work environment, and can impact your professional growth and personal health.
So, what can you do about it?
Number | Toxic Boss Type | Solution |
---|---|---|
#1 | Incompetent Boss | Use initiative |
#2 | Rigid Boss | Use the power of persuasion |
#3 | Intemperate Boss | Look for opportunities |
#4 | Callous Boss | Ask for a 1-on-1 meeting |
#5 | Corrupt Boss | Find co-workers who share your concerns |
#6 | Insular Boss | Offer them opportunities to open up |
#7 | Evil Boss | Take a stand |
Different kinds of bosses require different approaches, and some simply aren’t worth putting up with. For instance, taking initiative with an incompetent boss is one relatively easy solution, but having a 1-on-1 with a callous boss takes more effort. An evil boss requires intervention from HR.
If you don’t have a toxic boss, consider yourself lucky. Here are two ways to keep your working relationship strong:
- Take initiative
- Keep up open communication
- Ask for constant feedback so you know where you stand
- Under-promise and over-deliver
What Can Bosses Do?
Toxic bosses can have disastrous consequences on employees and companies. According to one Gallup survey, at minimum, 75% of the reasons for voluntary turnover can be influenced by managers.
After looking at some of the ways employees can address toxic bosses, how can bosses ensure their work environment is healthy? Harvard Business Review recommends four main things:
- Encourage social connections
- Show empathy
- Go out of your way to help
- Encourage employees to talk to you—especially about their problems
The future of work may be changing, with remote work becoming more popular and feasible. This can pose problems in creating a strong work culture.
However, if bosses and employees can work together to foster a positive and healthy work environment, everyone, including the bottom line, will benefit.
Support the Future of Data Storytelling
Sorry to interrupt your reading, but we have a favor to ask. At Visual Capitalist we believe in a world where data can be understood by everyone. That’s why we want to build the VC App - the first app of its kind combining verifiable and transparent data with beautiful, memorable visuals. All available for free.
As a small, independent media company we don’t have the expertise in-house or the funds to build an app like this. So we’re asking our community to help us raise funds on Kickstarter.
If you believe in data-driven storytelling, join the movement and back us on Kickstarter!
Thank you.

Markets
30 Years of Gun Manufacturing in America
The U.S. has produced nearly 170 million firearms over the past three decades. Here are the numbers behind America’s gun manufacturing sector.

30 Years of Gun Manufacturing in America
While gun sales have been brisk in recent years, the uncertainty surrounding COVID-19 was a boon for the gun industry.
From 2010-2019, an average of 13 million guns were sold legally in the U.S. each year. In 2020 and 2021, annual gun sales sharply increased to 20 million.
While the U.S. does import millions of weapons each year, a large amount of firearms sold in the country were produced domestically. Let’s dig into the data behind the multi-billion dollar gun manufacturing industry in America.
Gun Manufacturing in the United States
According to a recent report from the Bureau of Alcohol, Tobacco, Firearms and Explosives (ATF), the U.S. has produced nearly 170 million firearms over the past three decades, with production increasing sharply in recent years.
America’s gunmakers produce a wide variety of firearms, but they’re generally grouped into five categories; pistols, rifles, shotguns, revolvers, and everything else.
Below is a breakdown of firearms manufactured in the country over the past 30 years, by type:
Year | Pistols | Rifles | Revolvers | Shotguns | Misc. Firearms | Total Firearms |
---|---|---|---|---|---|---|
1989 | 1,404,753 | 1,407,400 | 628,573 | 935,541 | 42,126 | 4,418,393 |
1990 | 1,371,427 | 1,211,664 | 470,495 | 848,948 | 57,434 | 3,959,968 |
1991 | 1,378,252 | 883,482 | 456,966 | 828,426 | 15,980 | 3,563,106 |
1992 | 1,669,537 | 1,001,833 | 469,413 | 1,018,204 | 16,849 | 4,175,836 |
1993 | 2,093,362 | 1,173,694 | 562,292 | 1,144,940 | 81,349 | 5,055,637 |
1994 | 2,004,298 | 1,316,607 | 586,450 | 1,254,926 | 10,936 | 5,173,217 |
1995 | 1,195,284 | 1,411,120 | 527,664 | 1,173,645 | 8,629 | 4,316,342 |
1996 | 987,528 | 1,424,315 | 498,944 | 925,732 | 17,920 | 3,854,439 |
1997 | 1,036,077 | 1,251,341 | 370,428 | 915,978 | 19,680 | 3,593,504 |
1998 | 960,365 | 1,535,690 | 324,390 | 868,639 | 24,506 | 3,713,590 |
1999 | 995,446 | 1,569,685 | 335,784 | 1,106,995 | 39,837 | 4,047,747 |
2000 | 962,901 | 1,583,042 | 318,960 | 898,442 | 30,196 | 3,793,541 |
2001 | 626,836 | 1,284,554 | 320,143 | 679,813 | 21,309 | 2,932,655 |
2002 | 741,514 | 1,515,286 | 347,070 | 741,325 | 21,700 | 3,366,895 |
2003 | 811,660 | 1,430,324 | 309,364 | 726,078 | 30,978 | 3,308,404 |
2004 | 728,511 | 1,325,138 | 294,099 | 731,769 | 19,508 | 3,099,025 |
2005 | 803,425 | 1,431,372 | 274,205 | 709,313 | 23,179 | 3,241,494 |
2006 | 1,021,260 | 1,496,505 | 385,069 | 714,618 | 35,872 | 3,653,324 |
2007 | 1,219,664 | 1,610,923 | 391,334 | 645,231 | 55,461 | 3,922,613 |
2008 | 1,609,381 | 1,734,536 | 431,753 | 630,710 | 92,564 | 4,498,944 |
2009 | 1,868,258 | 2,248,851 | 547,195 | 752,699 | 138,815 | 5,555,818 |
2010 | 2,258,450 | 1,830,556 | 558,927 | 743,378 | 67,929 | 5,459,240 |
2011 | 2,598,133 | 2,318,088 | 572,857 | 862,401 | 190,407 | 6,541,886 |
2012 | 3,487,883 | 3,168,206 | 667,357 | 949,010 | 306,154 | 8,578,610 |
2013 | 4,441,726 | 3,979,570 | 725,282 | 1,203,072 | 495,142 | 10,844,792 |
2014 | 3,633,454 | 3,379,549 | 744,047 | 935,411 | 358,165 | 9,050,626 |
2015 | 3,557,199 | 3,691,799 | 885,259 | 777,273 | 447,131 | 9,358,661 |
2016 | 4,720,075 | 4,239,335 | 856,291 | 848,617 | 833,123 | 11,497,441 |
2017 | 3,691,010 | 2,504,092 | 720,917 | 653,139 | 758,634 | 8,327,792 |
2018 | 3,881,158 | 2,880,536 | 664,835 | 536,126 | 1,089,973 | 9,052,628 |
2019 | 3,046,013 | 1,957,667 | 580,601 | 480,735 | 946,929 | 7,011,945 |
Total | 60,804,840 | 59,796,760 | 15,826,964 | 26,241,134 | 6,298,415 | 168,968,113 |
Pistols (36%) and rifles (35%) are the dominant categories, and over time, the former has become the most commonly produced firearm type.
In 2001, pistols accounted for 21% of firearms produced. Today, nearly half of all firearms produced are pistols.
Who is Producing America’s Firearms?
There are a wide variety of firearm manufacturing companies in the U.S., but production is dominated by a few key players.
Here are the top 10 gunmakers in America, which collectively make up 70% of production:
Rank | Firearm Manufacturer | Guns Produced (2016-2020) | Share of total |
---|---|---|---|
1 | Smith & Wesson Corp | 8,218,199 | 17.2% |
2 | Sturm, Ruger & Company, Inc | 8,166,448 | 17.1% |
3 | Sig Sauer Inc | 3,660,629 | 7.7% |
4 | Freedom Group | 3,045,427 | 6.4% |
5 | 0 F Mossberg & Sons Inc | 2,223,241 | 4.7% |
6 | Taurus International Manufacturing | 1,996,121 | 4.2% |
7 | WM C Anderson Inc | 1,816,625 | 3.8% |
8 | Glock Inc | 1,510,437 | 3.2% |
9 | Henry RAC Holding Corp | 1,378,544 | 2.9% |
10 | JIE Capital Holdings / Enterprises | 1,258,969 | 2.6% |
Total | 33,274,640 | 69.7% |
One-third of production comes from two publicly-traded parent companies: Smith & Wesson (NASDAQ: SWBI), and Sturm, Ruger & Co. (NYSE: RGR)
Some of these players are especially dominant within certain types of firearms. For example:
- 58% of pistols were made by Smith & Wesson, Ruger, and SIG SAUER (2008–2018)
- 45% of rifles were made by Remington*, Ruger, and Smith & Wesson (2008–2018)
*In 2020, Remington filed for Chapter 11 bankruptcy protection, and its assets were divided and sold to various buyers. The Remington brand name is now owned by Vista Outdoor (NYSE: VSTO)
The Geography of Gun Manufacturing
Companies that manufacture guns hold a Type 07 license from the ATF. As of 2020, there are more than 16,000 Type 07 licensees across the United States.
Below is a state-level look at where the country’s licensees are located:
State | Licenses (2000) | Licenses (2020) | Population | Licenses per 100,000 pop. (2020) |
---|---|---|---|---|
Alaska | 8 | 117 | 733,391 | 16.0 |
Alabama | 40 | 276 | 5,039,877 | 5.5 |
Arkansas | 28 | 302 | 3,011,524 | 10.0 |
Arizona | 100 | 959 | 7,276,316 | 13.2 |
California | 159 | 620 | 39,237,836 | 1.6 |
Colorado | 27 | 481 | 5,812,069 | 8.3 |
Connecticut | 71 | 194 | 3,605,944 | 5.4 |
Delaware | 0 | 10 | 989,948 | 1.0 |
Florida | 131 | 1,009 | 21,781,128 | 4.6 |
Georgia | 52 | 510 | 10,799,566 | 4.7 |
Hawaii | 0 | 11 | 1,455,271 | 0.8 |
Iowa | 11 | 187 | 3,190,369 | 5.9 |
Idaho | 38 | 358 | 1,839,106 | 19.5 |
Illinois | 40 | 263 | 12,671,469 | 2.1 |
Indiana | 39 | 280 | 6,805,985 | 4.1 |
Kansas | 17 | 229 | 2,937,880 | 7.8 |
Kentucky | 22 | 211 | 4,505,836 | 4.7 |
Louisiana | 20 | 258 | 4,657,757 | 5.5 |
Massachusetts | 67 | 263 | 6,984,723 | 3.8 |
Maryland | 36 | 146 | 6,165,129 | 2.4 |
Maine | 13 | 107 | 1,362,359 | 7.9 |
Michigan | 43 | 386 | 10,050,811 | 3.8 |
Minnesota | 63 | 254 | 5,707,390 | 4.5 |
Missouri | 62 | 401 | 6,168,187 | 6.5 |
Mississippi | 12 | 190 | 2,961,279 | 6.4 |
Montana | 24 | 240 | 1,084,225 | 22.1 |
North Carolina | 52 | 628 | 10,551,162 | 6.0 |
North Dakota | 3 | 46 | 779,094 | 5.9 |
Nebraska | 15 | 91 | 1,961,504 | 4.6 |
New Hampshire | 25 | 188 | 1,377,529 | 13.6 |
New Jersey | 10 | 26 | 9,267,130 | 0.3 |
New Mexico | 18 | 179 | 2,117,522 | 8.5 |
Nevada | 45 | 276 | 3,104,614 | 8.9 |
New York | 35 | 299 | 19,835,913 | 1.5 |
Ohio | 80 | 644 | 11,780,017 | 5.5 |
Oklahoma | 37 | 423 | 3,959,353 | 10.7 |
Oregon | 55 | 226 | 4,237,256 | 5.3 |
Pennsylvania | 87 | 519 | 12,964,056 | 4.0 |
Rhode Island | 1 | 20 | 1,097,379 | 1.8 |
South Carolina | 25 | 284 | 5,190,705 | 5.5 |
South Dakota | 14 | 79 | 886,667 | 8.9 |
Tennessee | 76 | 352 | 6,975,218 | 5.0 |
Texas | 150 | 2,022 | 29,527,941 | 6.8 |
Utah | 33 | 478 | 3,271,616 | 14.6 |
Virginia | 48 | 412 | 8,642,274 | 4.8 |
Vermont | 15 | 85 | 643,077 | 13.2 |
Washington | 49 | 351 | 7,738,692 | 4.5 |
Wisconsin | 38 | 306 | 5,895,908 | 5.2 |
West Virginia | 20 | 115 | 1,793,716 | 6.4 |
Wyoming | 20 | 147 | 576,851 | 25.5 |
These manufacturers are located all around the country, so these numbers are somewhat reflective of population. Unsurprisingly, large states like Texas and Florida have the most licensees.
Sorting by the number of licensees per 100,000 people offers a different point of view. By this measure, Wyoming, Montana, and Idaho come out on top.
If recent sales and production trends are any indication, these numbers may only continue to grow.
Business
The World’s Largest Real Estate Investment Trusts (REITs)
Real estate investment trusts (REITS) are a simple alternative for investors looking to gain exposure to real estate.

The World’s Largest Real Estate Investment Trusts (REITs)
Real estate is widely regarded as an attractive asset class for investors.
This is because it offers several benefits like diversification (due to less correlation with stocks), monthly income, and protection from inflation. The latter is known as “inflation hedging”, and stems from real estate’s tendency to appreciate during periods of rising prices.
Affordability, of course, is a major barrier to investing in most real estate. Property markets around the world have reached bubble territory, making it incredibly difficult for people to get their foot in the door.
Thankfully, there are easier ways of gaining exposure. One of these is purchasing shares in a real estate investment trust (REIT), a type of company that owns and operates income-producing real estate, and is most often publicly-traded.
What Qualifies as REIT?
To qualify as a REIT in the U.S., a company must meet several criteria:
- Invest at least 75% of assets in real estate, cash , or U.S. Treasuries
- Derive at least 75% of gross income from rents, interest on mortgages, or real estate sales
- Pay at least 90% of taxable income in the form of shareholder dividends
- Be a taxable corporation
- Be managed by a board of directors or trustees
- Have at least 100 shareholders after one year of operations
- Have no more than half its shares held by five or fewer people
Investing in a REIT is similar to purchasing shares of any other publicly-traded company. There are also exchange-traded funds (ETFs) and mutual funds which may hold a basket of REITs. Lastly, note that some REITs are private, meaning they aren’t traded on stock exchanges.
The Top 10 by Market Cap
Here are the world’s 10 largest publicly-traded REITs, as of March 25, 2022.
REIT | Market Cap | Dividend Yield | Property Type |
---|---|---|---|
Prologis (NYSE: PLD) | $116.4B | 2.03% | Industrial |
American Tower (NYSE: AMT) | $109.8B | 2.38% | Communications |
Crown Castle (NYSE: CCI | $76.8B | 3.35% | Communications |
Public Storage (NYSE: PSA) | $65.9B | 2.14% | Self-storage |
Equinix (NYSE: EQIX) | $64.4B | 1.74% | Data centers |
Simon Property Group (NYSE: SPG) | $48.9B | 5.07% | Malls |
Welltower (NYSE: WELL) | $43.0B | 2.58% | Healthcare |
Digital Realty (NYSE: DLR) | $40.1B | 3.55% | Data centers |
Realty Income (NYSE: O) | $40.1B | 4.44% | Commercial |
AvalonBay Communities (NYSE: AVB) | $34.6B | 2.62% | Residential |
As shown above, REITs focus on different sectors of the market. Understanding their differences is an important step to consider before making an investment.
For example, Prologis manages the world’s largest portfolio of logistics real estate. This includes warehouses, distribution centers, and other supply chain facilities around the globe. It’s reasonable to assume that this REIT would benefit from further growth in ecommerce—more on this near the end.
Realty Income, on the other hand, owns a portfolio of over 11,100 commercial real estate properties in the U.S. and Europe. It rents these properties out to major brands like Walgreens and 7-Eleven, which together account for 8.1% of the REIT’s annual income.
More Than Just Buildings
Cell towers and data centers may not seem like “real estate”, but they are both critical pieces of modern infrastructure that take up land.
REITs that focus on these sectors include American Tower and Crown Castle, which own wireless communications assets in the U.S. and abroad. They are likely to benefit from the increased adoption of 5G networks and the Internet of Things (IoT).
On the other hand, Equinix and Digital Realty are focused on data centers, a fast growing industry that is benefitting from digitalization. Both of these REITs work with major tech firms such as Amazon and Google.
Trends to Watch
The demand for real estate can be heavily influenced by overarching trends found around the world. One of these is population growth and urbanization, which has drastically pushed up the cost of housing in many cities around the world.
There’s also the rising prevalence of ecommerce, which has triggered a boom in demand for warehouse space. This is best captured by Amazon’s massive growth during the COVID-19 pandemic, during which the company doubled the number of its warehouse facilities.
Globally, ecommerce accounts for just 19.6% of total retail sales. Should that figure continue to rise, industrial real estate prices could be in store for robust, long-term growth.
-
Money2 weeks ago
Mapping the Migration of the World’s Millionaires
-
Markets2 weeks ago
Visualizing the Coming Shift in Global Economic Power (2006-2036p)
-
Datastream3 weeks ago
Ranked: These Are 10 of the World’s Least Affordable Housing Markets
-
Demographics1 week ago
Mapped: A Decade of Population Growth and Decline in U.S. Counties
-
Misc3 weeks ago
Visualizing Well-Known Airlines by Fleet Composition
-
Politics4 weeks ago
Which Countries Trust Their Government, and Which Ones Don’t?
-
Markets4 weeks ago
Ranked: Visualizing the Largest Trading Partners of the U.S.
-
Misc1 week ago
Iconic Infographic Map Compares the World’s Mountains and Rivers