Misc
These Powerful Maps Show the Extremes of U.S. Population Density
America’s 328 million people are spread across a huge amount of territory, but the population density of various regions is far from equal.
It’s no secret that cities like New York have a vastly different population density than, say, a rural county in North Dakota. Even so, this interactive map by Ben Blatt of Slate helps visualize the stark contrast between urban and rural densities in a way that might intrigue you.
How many counties does it take to equal the population of these large urban areas? Let’s find out.
New York City’s Rural Equivalent
New York City (proper) Population: 8.42 million
New York City Population density: 27,547 persons / mi²
New York City became the largest city in the U.S. back in 1781 and has long been the country’s most densely packed urban center. Today, 1 in every 38 people living in the United States resides in The Big Apple.
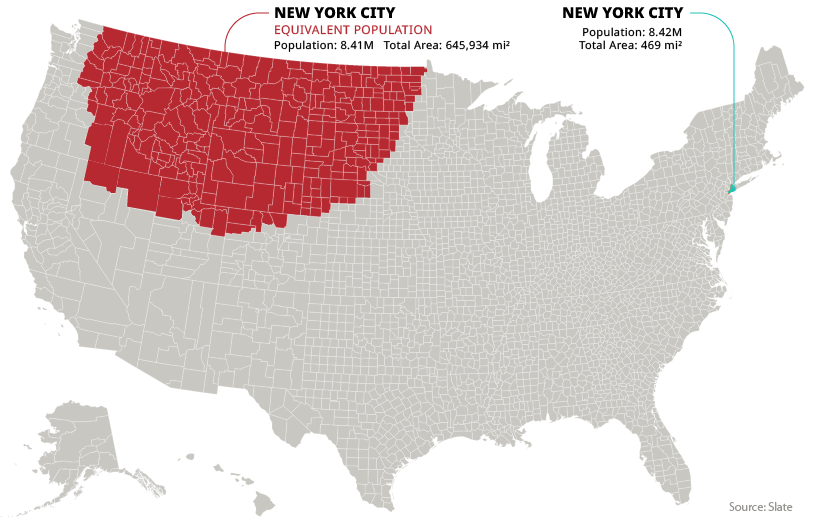
For the northwestern counties above to match the population of New York City, it takes a land area around the size of Mongolia. The region shown above is 645,934 mi², and runs through portions of 12 different states.
In order to match the population of the entire New York metropolitan area, which holds 18 million people and includes adjacent cities and towns in New York state, New Jersey, and Connecticut, the above equivalent area would have to be even more massive.
Los Angeles County’s Rural Equivalent
LA County Population: 10.04 million
LA County Population density: 2,100 persons / mi²
Los Angeles County is home to the 88 incorporated cities that make up the urban area of Los Angeles.
Even excluding nearby population centers such as Anaheim, San Bernadino, and Riverside (which are located in adjacent counties) it is still the most populous county in the United States, with over 10 million inhabitants.
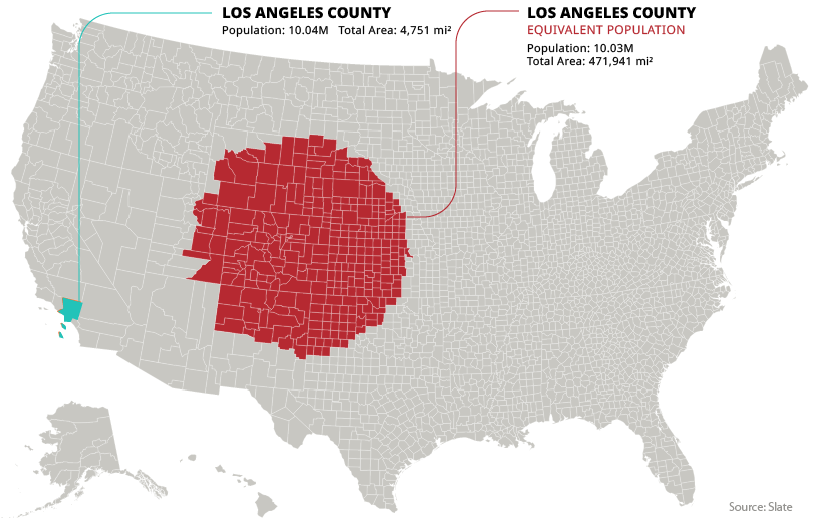
To match this enormous scale in Middle America, it would take 298 counties covering an area of 471,941 mi².
Chicago’s Rural Equivalent
Chicago Metropolitan Area Population: 9.53 million
Chicago Metropolitan Area Population density: 1,318 persons / mi²
Next up is America’s third largest city, Chicago. For this visualization, we’re using the Chicago metropolitan area, which covers the full extent of the city’s population.
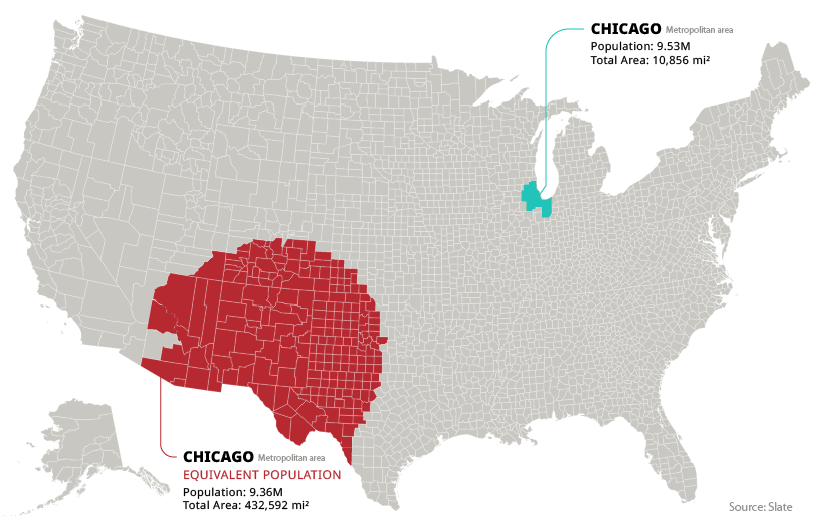
To match the scale of the population of the Windy City, we would need to add up every county in New Mexico, along with large portions of Colorado, Arizona, and Texas.
Turning the Tables?
Conversely, what if we transported the people in the country’s least densely populated counties into the middle of an urban center?
| Rank | County | Population |
|---|---|---|
| 1 | Kalawao County, Hawaii | 86 |
| 2 | Loving County, Texas | 169 |
| 3 | King County, Texas | 272 |
| 4 | Kenedy County, Texas | 404 |
| 5 | Arthur County, Nebraska | 463 |
As it turns out, the total population of the five least populated counties is just 1,394—roughly the same amount of people that live on the average Manhattan block.


Misc
Visualizing the Most Common Pets in the U.S.
Lions, tigers, and bears, oh my!—these animals do not feature on this list of popular American household pets.


Visualizing The Most Common Pets in the U.S.
This was originally posted on our Voronoi app. Download the app for free on iOS or Android and discover incredible data-driven charts from a variety of trusted sources.
In this graphic, we visualized the most common American household pets, based on 2023-2024 data from the American Pet Products Association (accessed via Forbes Advisor).
Figures represent the number of households that own each pet type, rather than the actual number of each animal. The “small animal” category includes hamsters, gerbils, rabbits, guinea pigs, chinchillas, mice, rats, and ferrets.
What is the Most Popular American Household Pet?
Based on this data, dogs—one of the first domesticated animals—are the most common pets in the United States. In fact, around 65 million households own a dog, and spend an average of $900 a year on their care.
| Rank | Species | Households |
|---|---|---|
| 1 | 🐶 Dog | 65M |
| 2 | 🐱 Cat | 47M |
| 3 | 🐟 Freshwater Fish | 11M |
| 4 | 🐰 Small Animals | 7M |
| 5 | 🐦 Bird | 6M |
| 6 | 🦎 Reptile | 6M |
| 7 | 🐴 Horse | 2M |
| 8 | 🐠 Saltwater Fish | 2M |
Note: Households can own multiple pets, and are counted for all relevant categories.
Cats rank second, at 47 million households, and these smaller felines are a little less expensive to own at $700/year according to Forbes estimates.
But aside from these two juggernauts, there are plenty of other common pet types found in households across the country.
Freshwater fish can be found in 11 million households, along with small animals—rabbits, hamsters, guinea pigs—in 7 million. Meanwhile, nearly 6 million homes have birds or reptiles.
Pet Ownership is on the Rise in America
Forbes found that 66% of all American households (numbering 87 million) own at least one pet, up from 56% in 1988. One third of these (29 million) own multiple pets.
A combination of factors is driving this increase: rising incomes, delayed childbirth, and of course the impact of the pandemic which nearly cleared out animal shelters across the globe.
America’s loneliness epidemic may also be a factor. Fledgling research has shown that single-individual households with pets recorded lower rates of loneliness during the pandemic than those without a pet.

-

 Science1 week ago
Visualizing the Average Lifespans of Mammals
-

 Demographics2 weeks ago
The Smallest Gender Wage Gaps in OECD Countries
-

 United States2 weeks ago
Where U.S. Inflation Hit the Hardest in March 2024
-

 Green2 weeks ago
Top Countries By Forest Growth Since 2001
-

 United States2 weeks ago
Ranked: The Largest U.S. Corporations by Number of Employees
-

 Maps2 weeks ago
The Largest Earthquakes in the New York Area (1970-2024)
-

 Green2 weeks ago
Ranked: The Countries With the Most Air Pollution in 2023
-

 Green2 weeks ago
Ranking the Top 15 Countries by Carbon Tax Revenue