Stocks
Pandemic Recovery: Have BEACH Stocks Bounced Back?
Pandemic Recovery: Have BEACH Stocks Bounced Back?
The travel and entertainment industries have had a volatile ride over the last year.
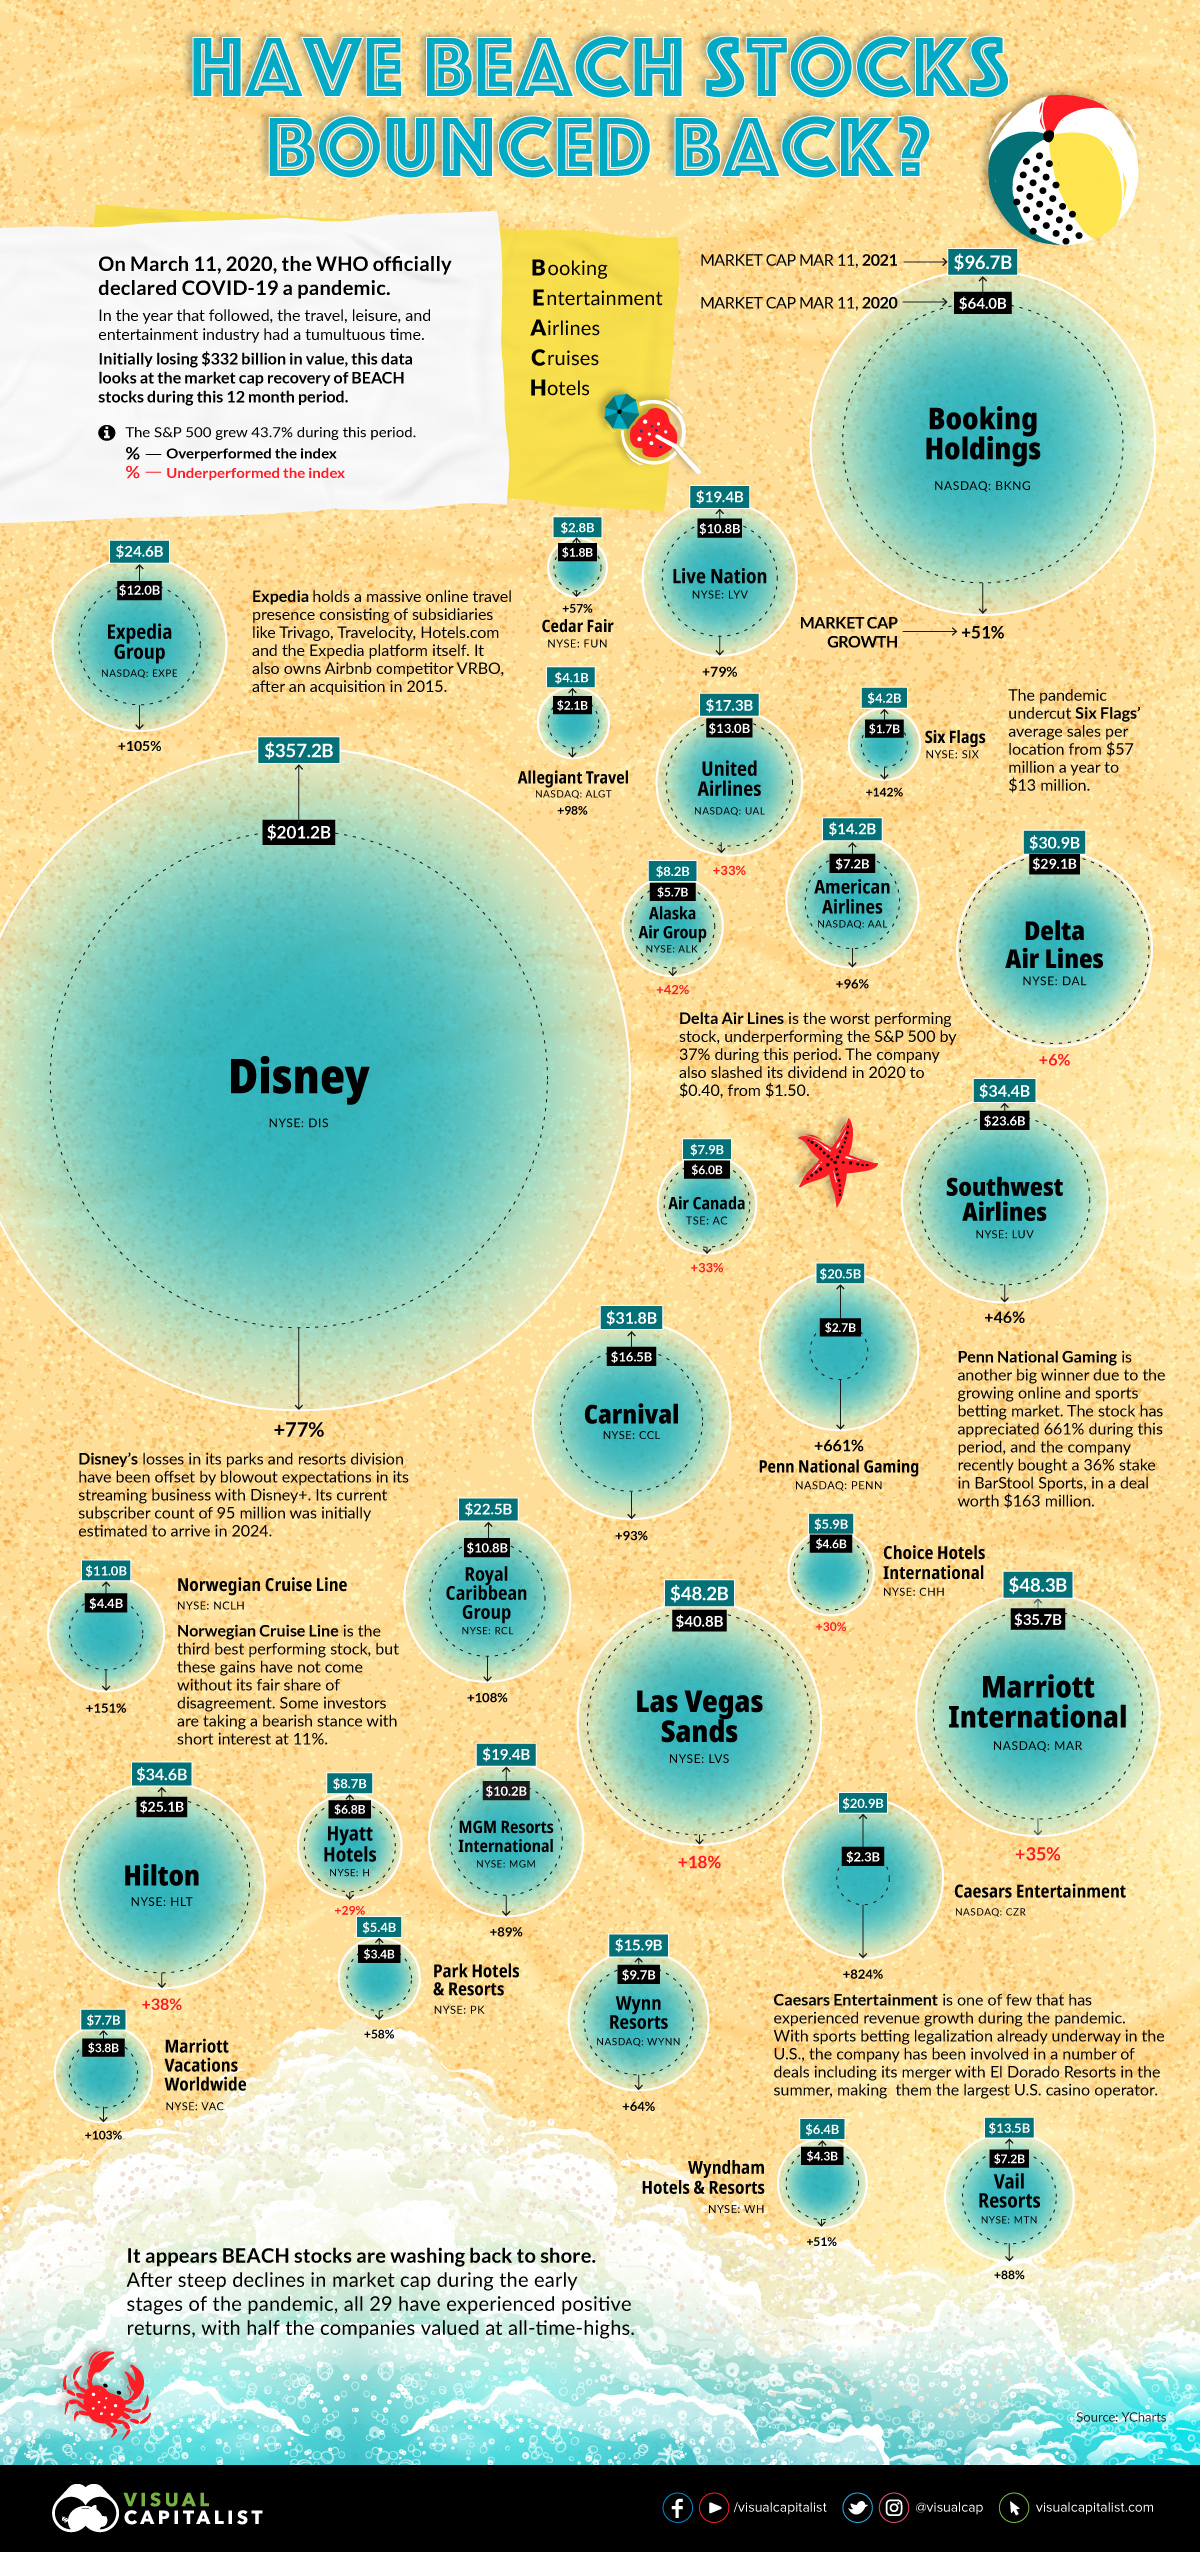
During the initial stages of the pandemic, when panic and uncertainty ran rife, BEACH stocks–booking, entertainment, airlines, cruises, and hotels—were left scrambling. Collectively, $332 billion in market cap washed away.
Now, it appears the tide might be turning for these companies, buoyed by vaccine breakthroughs and glimmers of hope for a return to normalcy.
This infographic looks at the growth in market cap value across BEACH stocks one year from when the WHO officially declared COVID-19 a pandemic.
Washing Back to Shore?
BEACH stocks have gained a collective $376 billion in market cap in the year since the pandemic was declared, with about half the companies trading at their respective all-time highs.
In fact, about 70% of BEACH stocks have actually outperformed the S&P 500, which returned 43.7% during the same period.
| Company | Ticker | Category | Market Cap: 03/11/20 ($B) | Market Cap: 03/11/21 ($B) | Change |
|---|---|---|---|---|---|
| American Airlines | AAL | Airlines | 7.2 | 14.2 | 96% |
| Southwest Airlines | LUV | Airlines | 23.5 | 34.4 | 46% |
| Alaska Air Group | ALK | Airlines | 5.7 | 8.1 | 42% |
| United Airlines | UAL | Airlines | 13.0 | 17.2 | 33% |
| Air Canada | AC | Airlines | 5.9 | 7.9 | 33% |
| Delta Air Lines | DAL | Airlines | 29.1 | 30.9 | 6% |
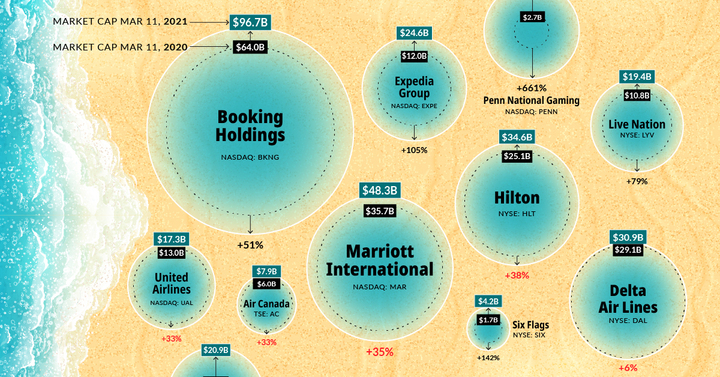
| Expedia Group | EXPE | Booking | 12.0 | 24.6 | 105% |
| Allegiant Travel | ALGT | Booking | 2.0 | 4.1 | 98% |
| Booking Holdings | BKNG | Booking | 64.0 | 96.0 | 51% |
| Caesars Entertainment | CZR | Casino & Hotel | 2.2 | 20.8 | 824% |
| Norwegian Cruise Lines | NCLH | Cruise & Casino | 4.3 | 10.9 | 151% |
| Royal Caribbean Cruises | RCL | Cruise & Casino | 10.8 | 22.4 | 108% |
| Carnival | CCL | Cruise & Casino | 16.4 | 31.8 | 93% |
| Penn National Gaming | PENN | Entertainment & Live Events | 2.6 | 20.4 | 661% |
| Six Flags | SIX | Entertainment & Live Events | 1.7 | 4.1 | 142% |
| Live Nation | LYV | Entertainment & Live Events | 10.8 | 19.3 | 79% |
| The Walt Disney Co | DIS | Entertainment & Live Events | 201.2 | 357.1 | 77% |
| Cedar Fair | FUN | Entertainment & Live Events | 1.8 | 2.8 | 57% |
| Hilton | HLT | Hotels | 25.0 | 34.6 | 38% |
| Marriott International | MAR | Hotels | 35.6 | 48.2 | 35% |
| Choice Hotels International | CHH | Hotels | 4.5 | 5.9 | 30% |
| Hyatt Hotels | H | Hotels | 6.7 | 8.7 | 29% |
| Marriott Vacations Worldwide | VAC | Hotels & Resorts | 3.8 | 7.7 | 103% |
| Vail Resorts | MTN | Hotels & Resorts | 7.1 | 13.4 | 88% |
| Park Hotels & Resorts | PK | Hotels & Resorts | 3.4 | 5.3 | 58% |
| Wyndham Hotels & Resorts | WH | Hotels & Resorts | 4.2 | 6.4 | 51% |
| MGM Resorts International | MGM | Resorts & Casino | 10.2 | 19.3 | 89% |
| Wynn Resorts | WYNN | Resorts & Casino | 9.7 | 15.9 | 64% |
| Las Vegas Sands | LVS | Resorts & Casino | 40.7 | 48.2 | 18% |
BEACH Stocks Leaders and Laggards
When dissecting this basket of stocks by industry, it’s clear that much of the recovery story is lopsided. One reason for this, despite the pandemic, is that there are more granular, idiosyncratic trends occurring within these sectors.
Let’s look at what’s propelling the leaders, and dragging down the laggards:
Leading: Online Betting
There’s reason to be bullish on gambling stocks. Since late 2018, some 20 states have legalized sports betting, with more expecting to follow. Relative to other areas, the pandemic has been kind to gambling stocks. Many of those with an online presence have witnessed a spike in traffic, as more people continue to flock towards online betting.
Within the BEACH stocks basket, Penn National Gaming and Caesars Entertainment are clear outliers, having grown an epic 661% and 823% respectively. In addition, the broader industry (measured by the BETZ ETF) has nearly doubled the performance of the S&P 500 since its inception.
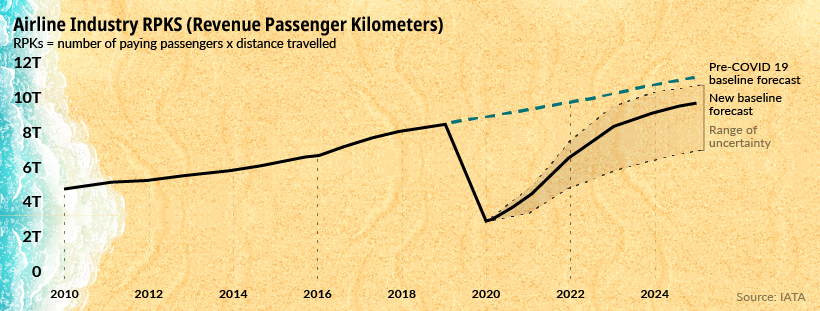
Laggard: Airlines
The return to normalcy will be much more delayed for airlines. Global RPKs, an industry metric, are not expected to reach pre-pandemic levels until 2024.
Actions of insiders also seem to match this negative sentiment. Warren Buffett, once a staunch supporter of airlines, decided to call it quits during the pandemic—dumping his entire position.
U.S. airline executives have collectively been selling their stakes much more aggressively than in the last few years. To add insult to injury, there’s significant shorting of airline stocks as well. At a short interest of 11.6%, American Airlines is most heavily shorted BEACH stock.
Laggard: Hotels
In a year where social interactions and gatherings have largely disappeared, so too has much of the business activity for hotels. For instance, Hilton sales suffered a 58% decline year-over-year.
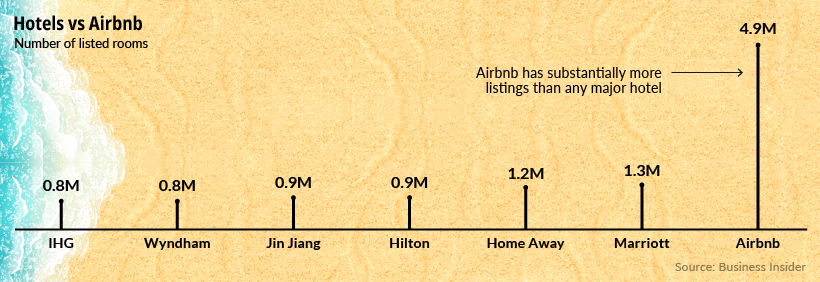
But even without the pandemic, the hotel industry had their work cut out for them, through a growing and formidable competitor in Airbnb. Airbnb can scale its network beyond what any hotel can. This is evident in its room count, which is greater than the largest hotels combined.
More Bumps On The Road Ahead?
The investing landscape today looks to be disconnected from reality, in part because of the forward-looking nature of markets. Even though things are dire today, there’s a belief that light exists at the end of the tunnel.
But the path to recovery isn’t quite so linear. When the dust settles, it’ll become more apparent which industries will “return to normal” and which have set out permanently on a new trajectory.


Markets
Visualizing the Biggest Companies on Major Stock Exchanges
With trillion dollar valuations becoming more common, we’ve compared the five biggest companies by stock exchange.
Comparing the Top Five Companies on Major Stock Exchanges
This was originally posted on our Voronoi app. Download the app for free on iOS or Android and discover incredible data-driven charts from a variety of trusted sources.
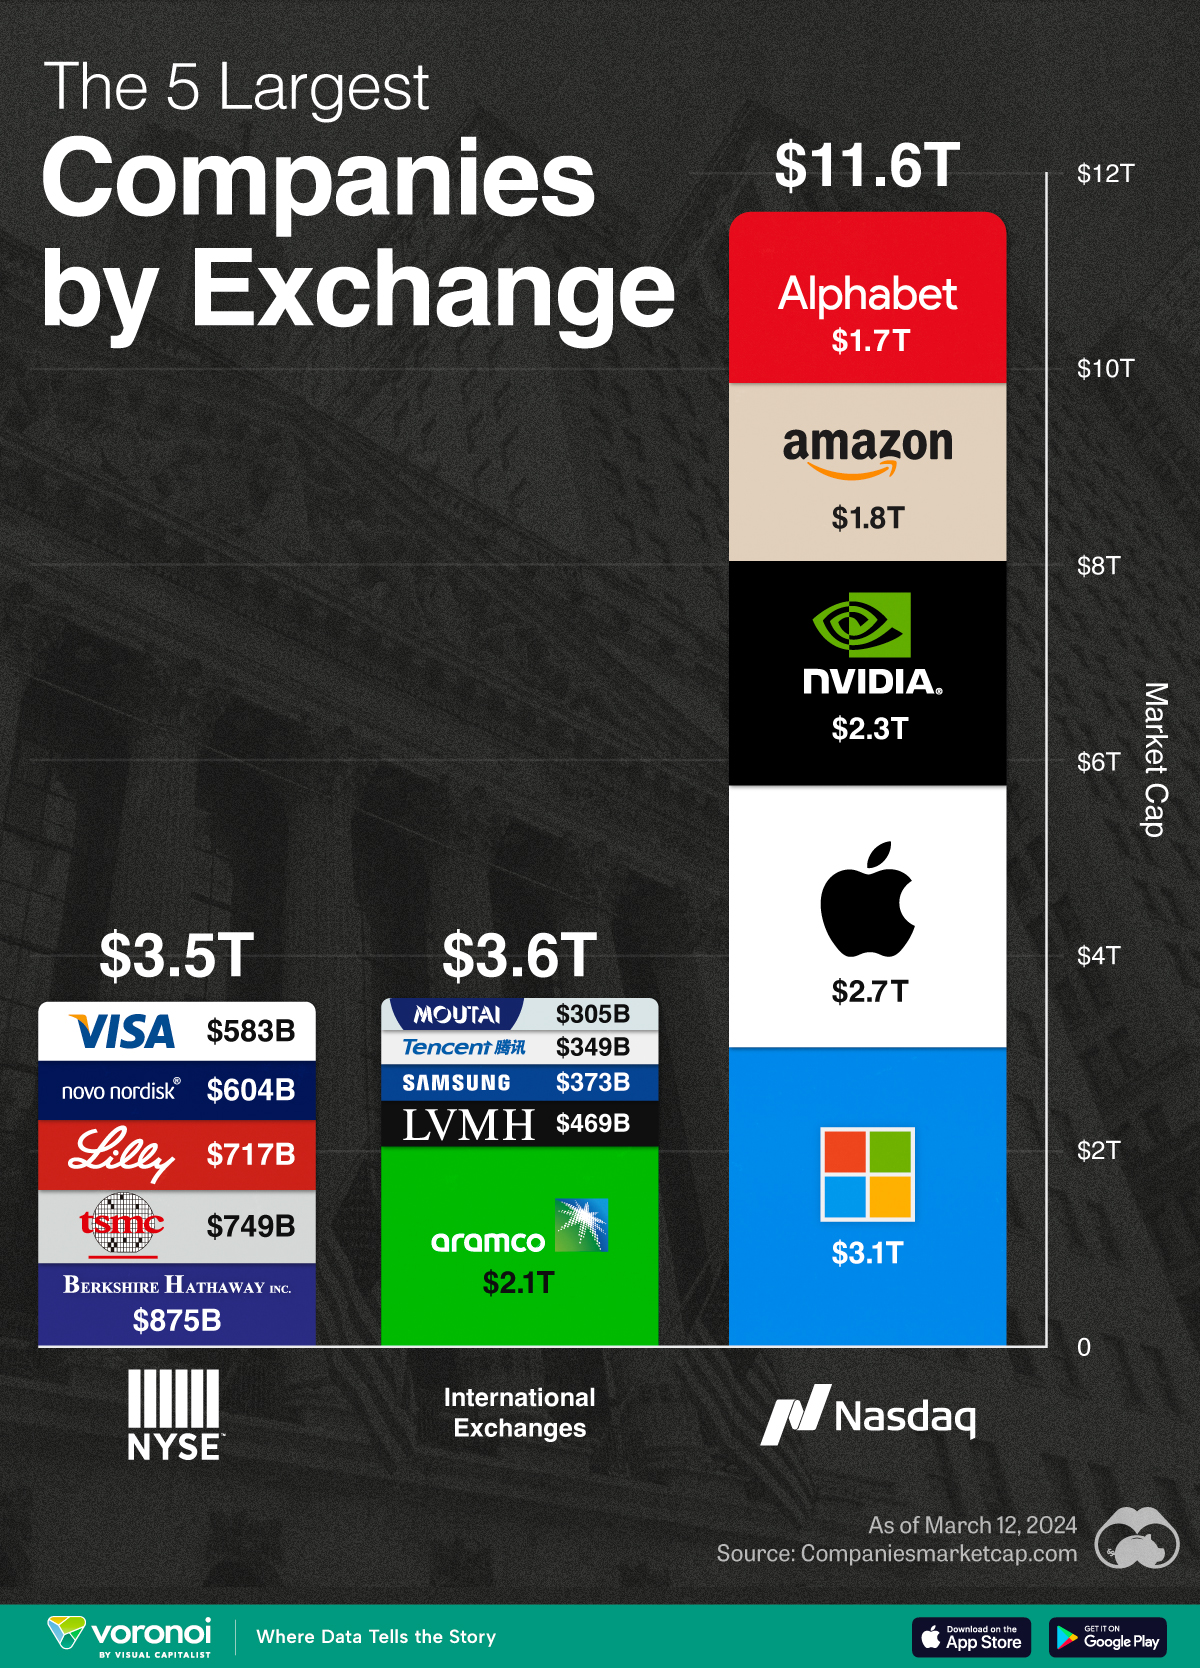
With many companies nearing or surpassing the $1 trillion market capitalization milestone, we’ve put together a graphic that visualizes the five largest companies trading on the Nasdaq, New York Stock Exchange (NYSE), and international exchanges.
These figures come from Companiesmarketcap.com, and are as of March 12, 2024.
Biggest Companies on the Nasdaq
The Nasdaq is largely dominated by the tech industry, with all of its top five companies belonging to the Magnificent Seven group of U.S. tech stocks.
| Company | Market Cap (USD) |
|---|---|
| 🇺🇸 Microsoft | $3.1T |
| 🇺🇸 Apple | $2.7T |
| 🇺🇸 Nvidia | $2.3T |
| 🇺🇸 Amazon | $1.8T |
| $1.7T |
Altogether, these five companies have a combined market capitalization of nearly $12 trillion. To put this figure into context, the entire U.S. equity market is worth around $53 trillion.
Biggest Companies on the NYSE
The NYSE’s largest companies are more diversified, with a combination of tech, financial services, and healthcare names present. Among this list, Warren Buffett’s Berkshire Hathaway is the closest to becoming the next trillion dollar company.
| Company | Market Cap (USD) |
|---|---|
| 🇺🇸 Berkshire Hathaway | $875B |
| 🇹🇼 TSMC | $749B |
| 🇺🇸 Eli Lilly | $717B |
| 🇩🇰 Novo Nordisk | $604B |
| 🇺🇸 Visa | $583B |
Biggest Companies on International Exchanges
Saudi Aramco is the largest public company listed outside of the U.S., with a mammoth $2.1 trillion valuation.
| Company | Market Cap (USD) |
|---|---|
| 🇸🇦 Saudi Aramco | $2.1T |
| 🇫🇷 LVMH | $469B |
| 🇰🇷 Samsung | $373B |
| 🇨🇳 Tencent | $349B |
| 🇨🇳 Kweichow Moutai | $305B |
It should be noted, however, that the Saudi government directly owns 90% of the company, while another 8% is held by the country’s sovereign wealth fund.
This means that only 2% of shares are actually available to the public, prompting one Bloomberg columnist to call the firm’s valuation an “illusion”.

-

 Science1 week ago
Visualizing the Average Lifespans of Mammals
-

 Markets2 weeks ago
The Top 10 States by Real GDP Growth in 2023
-

 Demographics2 weeks ago
The Smallest Gender Wage Gaps in OECD Countries
-

 United States2 weeks ago
Where U.S. Inflation Hit the Hardest in March 2024
-

 Green2 weeks ago
Top Countries By Forest Growth Since 2001
-

 United States2 weeks ago
Ranked: The Largest U.S. Corporations by Number of Employees
-

 Maps2 weeks ago
The Largest Earthquakes in the New York Area (1970-2024)
-

 Green2 weeks ago
Ranked: The Countries With the Most Air Pollution in 2023