Datastream
Ranked: The Fastest Growing Cities in Europe


The Briefing
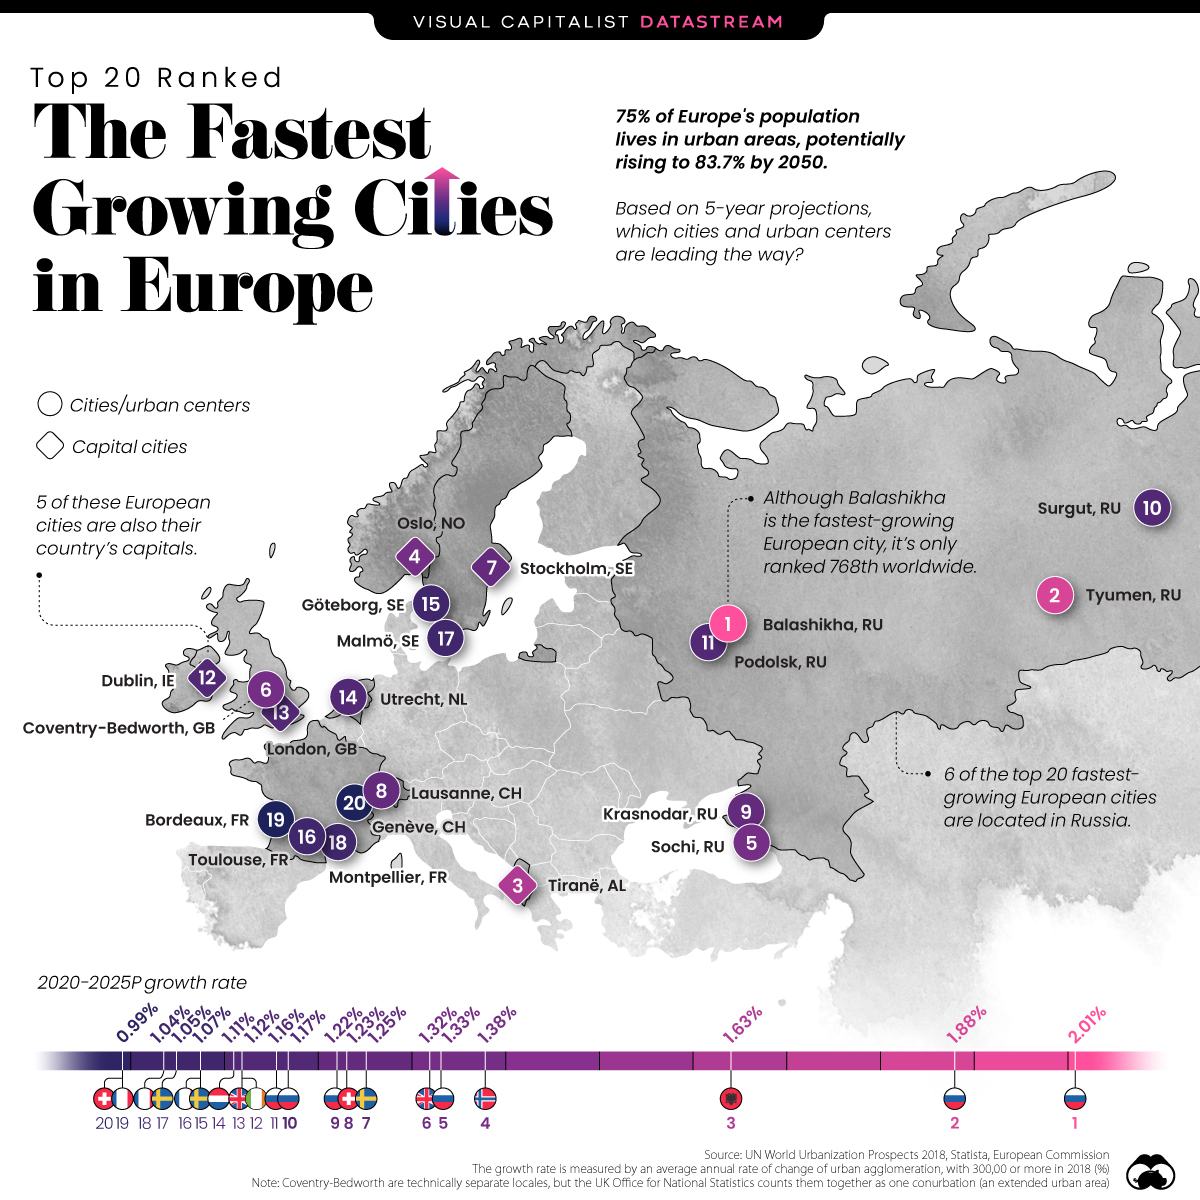
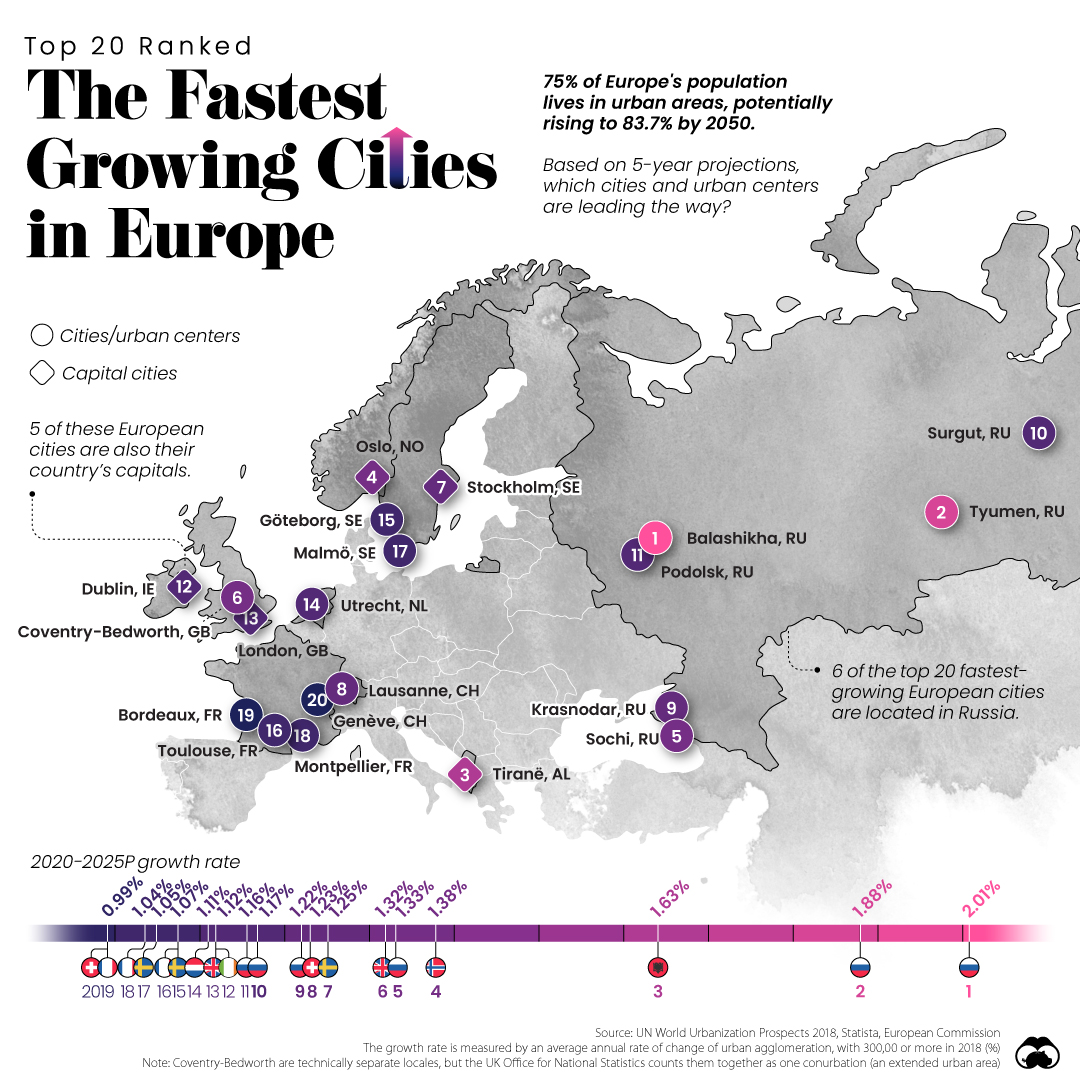
- 75% of Europe’s population lives in urban areas, but this could rise to nearly 84% by 2050
- Six of the top 20 fastest growing cities in Europe are located in Russia
Ranked: The Top 20 Fastest Growing Cities in Europe
If you were to select a random person in Europe, there’s a 75% chance that person lives in an urban area rather than a rural one.
In the coming decades, this region’s urban population figure is expected to rise even higher, from 75% to 84% by 2050.
Based on projected average annual population growth rates between 2020-2025, which are the fastest growing cities in Europe?
Russian Might
Russia’s well-known for its expansive landmass, but the country is more than its vast terrain. In fact, it contains six of the top 20 fastest growing cities in Europe.
| City | Country | 2020–2025 Growth Rate | Capital city? |
|---|---|---|---|
| Balashikha | 🇷🇺 Russia | 2.01% | No |
| Tyumen | 🇷🇺 Russia | 1.88% | No |
| Tiranë (Tirana) | 🇦🇱 Albania | 1.63% | 📍 Yes |
| Oslo | 🇳🇴 Norway | 1.38% | 📍 Yes |
| Sochi | 🇷🇺 Russia | 1.33% | No |
| Coventry-Bedworth | 🇬🇧 UK | 1.32% | No |
| Stockholm | 🇸🇪 Sweden | 1.25% | 📍 Yes |
| Lausanne | 🇨🇭 Switzerland | 1.23% | No |
| Krasnodar | 🇷🇺 Russia | 1.22% | No |
| Surgut | 🇷🇺 Russia | 1.17% | No |
| Podolsk | 🇷🇺 Russia | 1.16% | No |
| Dublin | 🇮🇪 Ireland | 1.12% | 📍 Yes |
| London | 🇬🇧 UK | 1.12% | 📍 Yes |
| Utrecht | 🇳🇱 Netherlands | 1.11% | No |
| Göteborg | 🇸🇪 Sweden | 1.07% | No |
| Toulouse | 🇫🇷 France | 1.07% | No |
| Malmö | 🇸🇪 Sweden | 1.05% | No |
| Montpellier | 🇫🇷 France | 1.04% | No |
| Bordeaux | 🇫🇷 France | 0.99% | No |
| Genève | 🇨🇭 Switzerland | 0.99% | No |
Interestingly, Balashikha—the fastest growing European city—is located just 25km (15 mi) outside Moscow. Rapid expansion at the peripheries of capital cities like this are typically attributed to a phenomenon called urban sprawl.
Although Balashikha is projected to experience the fastest annual rate of growth (2.01%) in the region over the next few years, when pitted against others on the global stage, it only ranks in 768th place.
Europe vs. Global
It’s important to note that Europe’s urban growth rates are relatively slow compared to many other parts of the world, such as Asia and Africa.
| Europe's Fastest Growing Cities | Growth Rate | World's Fastest Growing Cities | Growth Rate |
|---|---|---|---|
| 🇷🇺 Balashikha, Russia | 2.01% | 🇳🇬 Gwagwalada | 6.46% |
| 🇷🇺 Tyumen, Russia | 1.88% | 🇨🇩 Kabinda | 6.37% |
| 🇦🇱 Tiranë (Tirana), Albania | 1.63% | 🇧🇩 Rupganj | 6.36% |
| 🇳🇴 Oslo, Norway | 1.38% | 🇳🇬 Lokoja | 5.93% |
| 🇷🇺 Sochi, Russia | 1.33% | 🇦🇴 Uige | 5.92% |
| 🇬🇧 Coventry-Bedworth, UK | 1.32% | 🇧🇮 Bujumbura | 5.75% |
| 🇸🇪 Stockholm, Sweden | 1.25% | 🇹🇿 Songea | 5.74% |
| 🇨🇭 Lausanne, Switzerland | 1.23% | 🇨🇳 Xiongan | 5.69% |
| 🇷🇺 Krasnodar, Russia | 1.22% | 🇳🇬 Potiskum | 5.65% |
| 🇷🇺 Surgut, Russia | 1.17% | 🇨🇩 Bunia | 5.63% |
| 🇷🇺 Podolsk, Russia | 1.16% | 🇲🇿 Tete | 5.56% |
| 🇮🇪 Dublin, Ireland | 1.12% | 🇦🇴 Cuito | 5.48% |
| 🇬🇧 London, UK | 1.12% | 🇮🇳 Hosur | 5.38% |
| 🇳🇱 Utrecht, Netherlands | 1.11% | 🇧🇯 Abomey-Calavi | 5.27% |
| 🇸🇪 Göteborg, Sweden | 1.07% | 🇳🇬 Nnewi | 5.18% |
| 🇫🇷 Toulouse, France | 1.07% | 🇦🇴 Malanje | 5.17% |
| 🇸🇪 Malmö, Sweden | 1.05% | 🇨🇲 Mbouda | 5.16% |
| 🇫🇷 Montpellier, France | 1.04% | 🇲🇿 Quelimane | 5.14% |
| 🇫🇷 Bordeaux, France | 0.99% | 🇺🇬 Kampala | 5.14% |
| 🇨🇭 Genève, Switzerland | 0.99% | 🇨🇩 Goma | 5.14% |
From 2020-2025, the world’s fastest growing city, Gwagwalada, Nigeria, is expected to grow more than 3x faster than Europe’s fastest growing city, Balashikha.
» Like this? Then check out the fastest growing cities in the United States.
Where does this data come from?
Source: UN World Urbanization Prospects 2018, Statista, European Commission
Details:: The growth rate is measured by an average annual rate of change of urban agglomeration, with 300,00 or more in 2018 (%).
Coventry-Bedworth are technically separate locales, but the UK Office for National Statistics counts them together as one conurbation (an extended urban area).


Datastream
Can You Calculate Your Daily Carbon Footprint?
Discover how the average person’s carbon footprint impacts the environment and learn how carbon credits can offset your carbon footprint.


The Briefing
- A person’s carbon footprint is substantial, with activities such as food consumption creating as much as 4,500 g of CO₂ emissions daily.
- By purchasing carbon credits from Carbon Streaming Corporation, you can offset your own emissions and fund positive climate action.
Your Everyday Carbon Footprint
While many large businesses and countries have committed to net-zero goals, it is essential to acknowledge that your everyday activities also contribute to global emissions.
In this graphic, sponsored by Carbon Streaming Corporation, we will explore how the choices we make and the products we use have a profound impact on our carbon footprint.
Carbon Emissions by Activity
Here are some of the daily activities and products of the average person and their carbon footprint, according to Clever Carbon.
| Household Activities & Products | CO2 Emissions (g) |
|---|---|
| 💡 Standard Light Bulb (100 watts, four hours) | 172 g |
| 📱 Mobile Phone Use (195 minutes per day)* | 189 g |
| 👕 Washing Machine (0.63 kWh) | 275 g |
| 🔥 Electric Oven (1.56 kWh) | 675 g |
| ♨️ Tumble Dryer (2.5 kWh) | 1,000 g |
| 🧻 Toilet Roll (2 ply) | 1,300 g |
| 🚿 Hot Shower (10 mins) | 2,000 g |
| 🚙 Daily Commute (one hour, by car) | 3,360 g |
| 🍽️ Average Daily Food Consumption (three meals of 600 calories) | 4,500 g |
| *Phone use based on yearly use of 69kg per the source, Reboxed | |
Your choice of transportation plays a crucial role in determining your carbon footprint. For instance, a 15 km daily commute to work on public transport generates an average of 1,464 g of CO₂ emissions. Compared to 3,360 g—twice the volume for a journey the same length by car.
By opting for more sustainable modes of transport, such as cycling, walking, or public transportation, you can significantly reduce your carbon footprint.
Addressing Your Carbon Footprint
One way to compensate for your emissions is by purchasing high-quality carbon credits.
Carbon credits are used to help fund projects that avoid, reduce or remove CO₂ emissions. This includes nature-based solutions such as reforestation and improved forest management, or technology-based solutions such as the production of biochar and carbon capture and storage (CCS).
While carbon credits offer a potential solution for individuals to help reduce global emissions, public awareness remains a significant challenge. A BCG-Patch survey revealed that only 34% of U.S. consumers are familiar with carbon credits, and only 3% have purchased them in the past.
About Carbon Streaming
By financing the creation or expansion of carbon projects, Carbon Streaming Corporation secures the rights to future carbon credits generated by these sustainable projects. You can then purchase these carbon credits to help fund climate solutions around the world and compensate for your own emissions.
Ready to get involved?
>> Learn more about purchasing carbon credits at Carbon Streaming

-

 Real Estate2 weeks ago
Visualizing America’s Shortage of Affordable Homes
-

 Technology1 week ago
Ranked: Semiconductor Companies by Industry Revenue Share
-

 Money1 week ago
Which States Have the Highest Minimum Wage in America?
-

 Real Estate1 week ago
Ranked: The Most Valuable Housing Markets in America
-

 Business1 week ago
Charted: Big Four Market Share by S&P 500 Audits
-

 AI2 weeks ago
The Stock Performance of U.S. Chipmakers So Far in 2024
-

 Misc2 weeks ago
Almost Every EV Stock is Down After Q1 2024
-

 Money2 weeks ago
Where Does One U.S. Tax Dollar Go?