Misc
Timeline: The World’s Biggest Passenger Ships from 1831-Present

Breaking Records: The Biggest Passenger Ships since 1831
The Titanic lives large in our minds, but it’s probably not surprising that the world record for biggest passenger ship has been broken many times since its era. In fact, today’s largest passenger ship can now hold over 6,000 people—more than double the Titanic’s capacity.
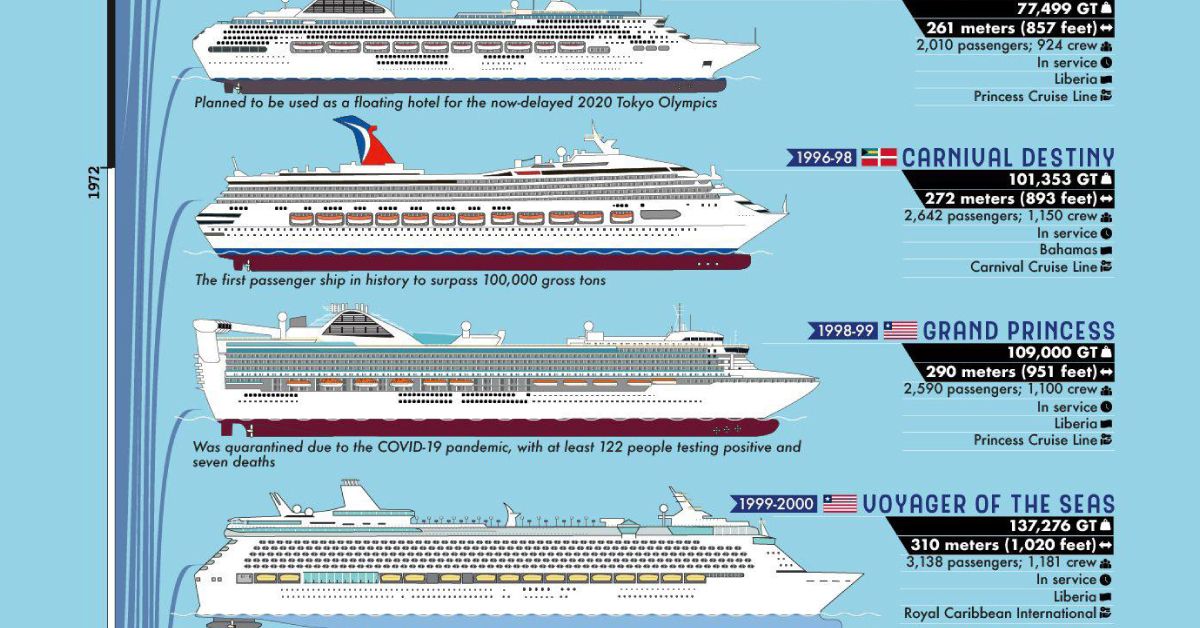
This graphic by HMY Yachts looks at which vessels held the title of the world’s largest passenger ship over time, and how these vessels have evolved since the early 19th century.
Different Types of Passenger Ships
Before diving into the ranking, it’s worth explaining what constitutes a passenger ship.
Passenger ships are vessels whose main purpose is to transport people rather than goods. In modern times, there are three types of passenger ships:
- Cruise ships: Used for vacationing, with a priority on amenities and luxury
- Ferries: Typically used for shorter day trips, or overnight transport
- Ocean liners: The traditional mode of maritime transport, with a priority on speed
Traditional ocean liners are becoming obsolete, largely because of advancements in other modes of transportation such as rail, automobile, and air travel. In other words, the main priority for passenger ships has changed over the years, shifting from transportation to recreation.
Now, luxury is the central focus, meaning extravagance is part of the whole cruise ship experience. For example, the Navigator of the Seas (which was the largest passenger ship from 2002-2003) has $8.5 million worth of artwork displayed throughout the ship.
A Full Breakdown: Biggest Passenger Ships By Tonnage
Now that we’ve touched on the definition of a passenger ship and how they’ve evolved over the years, let’s take a look at some of the largest passenger ships in history.
The first vessel on the list is the SS Royal William. Built in Eastern Canada in the early 1800s, this ship was originally built for domestic travel within Canada.
In addition to being the largest passenger ship of its time, it’s often credited as being the first ship to travel across the Atlantic Ocean almost fully by steam engine. However, some sources claim the Dutch-owned vessel Curaçao completed a steam-powered journey in 1827—six years before the SS Royal William.
In 1837, The SS Royal William was dethroned by the SS Great Western, only to change hands dozens of times before 1912, when the Titanic entered the scene.
| Ship | Title held | Tonnage | Capacity |
|---|---|---|---|
| SS Royal William | 1831 – 1837 | 1,370 GRT | 155 passengers |
| SS Great Western | 1837 – 1839 | 1,340 GRT | 128 passengers, 20 servants, 60 crew |
| SS British Queen | 1839 – 1840 | 1,850 GRT | 207 passengers |
| SS President | 1840 – 1841 | 2,366 GRT | 110 passengers, 44 servants |
| SS British Queen | 1841 – 1843 | 1,850 GRT | 207 passengers |
| SS Great Britain | 1843 – 1853 | 3,270 GRT | 360 passengers, 120 crew |
| SS Atrato | 1853 – 1858 | 3,466 GRT | 762+ passengers |
| SS Great Eastern | 1858 – 1888 | 18,915 GRT | 4,000 passengers, 418 crew |
| SS City of New York | 1888 – 1893 | 10,499 GRT | 1,740 passengers, 362 crew |
| RMS Campania and RMS Lucania | 1893 – 1897 | 12,950 GRT | 2,000 passengers, 424 crew |
| SS Kaiser Wilhelm der Grosse | 1897 – 1899 | 14,349 GRT | 1,506 passengers, 488 crew |
| RMS Oceanic | 1899 – 1901 | 17,272 GRT | 1,710 passengers, 349 crew |
| RMS Celtic | 1901 – 1903 | 20,904 GRT | 2,857 passengers |
| RMS Cedric | 1903 – 1904 | 21,035 GRT | 1,223 passengers, 486 crew |
| RMS Baltic | 1904 – 1906 | 23,876 GRT | 2,875 passengers |
| SS Kaiserin Auguste Victoria | 1906 – 1907 | 24,581 GRT | 2,466 passengers |
| RMS Lusitania | 1907 | 31,550 GRT | 2,198 passengers, 850 crew |
| RMS Mauretania | 1907 – 1911 | 31,938 GRT | 2,165 passengers, 802 crew |
| RMS Olympic | 1911 – 1912 | 45,324 GRT | 2,435 passengers, 950 crew |
| RMS Titanic | 1912 | 46,328 GRT | 2,435 passengers, 892 crew |
| SS Imperator | 1913 – 1914 | 52,117 GRT | 4,234 passengers, 1,180 crew |
| SS Vaterland | 1914 – 1922 | 54,282 GRT | 1,165 passengers |
| RMS Majestic | 1922 – 1935 | 56,551 GRT | 2,145 passengers |
| SS Normandie | 1935 – 1936 | 79,280 GRT | 1,972 passengers, 1,345 crew |
| RMS Queen Mary | 1936 | 80,774 GRT | 2,139 passengers, 1,101 crew |
| SS Normandie | 1936 – 1946 | 83,404 GRT | 1,972 passengers, 1,345 crew |
| RMS Queen Elizabeth | 1946 – 1972 | 83,673 GRT | 2,283 passengers, 1000+ crew |
| SS France and SS Norway (1962-1980) | 1972 – 1987 | 66,343 GRT | 2,044 passengers, 1,253 crew |
| MS Sovereign of the Seas | 1987 – 1990 | 73,529 GT | 2,850 passengers |
| SS Norway | 1990 – 1995 | 76,049 GT | 2,565 passengers, 875 crew |
| Sun Princess | 1995 – 1996 | 77,499 GT | 2,010 passengers, 924 crew |
| Carnival Destiny | 1996 – 1998 | 101,353 GT | 2,642 passengers, 1,150 crew |
| Grand Princess | 1998 – 1999 | 109,000 GT | 2,590 passengers, 1,110 crew |
| Voyager of the Seas | 1999 – 2000 | 137,276 GT | 3,138 passengers, 1,181 crew |
| Explorer of the Seas | 2000 – 2002 | 137,308 GT | 3,114 passengers, 1,180 crew |
| Navigator of the Seas | 2002 – 2003 | 139,999 GT | 4,000 passengers, 1,200 crew |
| RMS Queen Mary 2 | 2003 – 2006 | 148,528 GT | 2,640 passengers, 1,256 crew |
| MS Freedom of the Seas | 2006 – 2007 | 154,407 GT | 4,515 passengers, 1,300 crew |
| Liberty of the Seas | 2007 – 2009 | 155,889 GT | 4,960 passengers, 1,300 crew |
| Oasis of the Seas | 2009 – 2016 | 225,282 GT | 6,780 passengers, 2,165 crew |
| Harmony of the Seas | 2016 – 2018 | 226,963 GT | 6,780 passengers, 2,300 crew |
| Symphony of the Seas | 2018 – present | 228,081 GT | 6,680 passengers, 2,200 crew |
The Titanic was one of three ships in the Olympic-class line. Of the three, two of them sank—the Titanic in 1912, and the HMHS Britannic in 1916, during World War I. Some historians believe these ships sank as a result of their faulty bulkhead design.
Fast forward to today, and the Symphony of the Seas is now the world’s largest passenger ship. While it boasts 228,081 in gross tonnage, it uses 25% less fuel than its sister ships (which are slightly smaller).
COVID-19’s Impact on Cruise Ships
2020 was a tough year for the cruise ship industry, as travel restrictions and onboard outbreaks halted the $150 billion industry. As a result, some operations were forced to downsize—for instance, the notable cruise operation Carnival removed 13 ships from its fleet in July 2020.
That being said, restrictions are slowly beginning to loosen, and industry experts remain hopeful that things will look different in 2021 as more people begin to come back on board.
“[There] is quite a bit of pent-up demand and we’re already seeing strong interest in 2021 and 2022 across the board, with Europe, the Mediterranean, and Alaska all seeing significant interest next year.”
-Josh Leibowitz, president of luxury cruise line Seabourn
VC+
VC+: Get Our Key Takeaways From the IMF’s World Economic Outlook
A sneak preview of the exclusive VC+ Special Dispatch—your shortcut to understanding IMF’s World Economic Outlook report.

Have you read IMF’s latest World Economic Outlook yet? At a daunting 202 pages, we don’t blame you if it’s still on your to-do list.
But don’t worry, you don’t need to read the whole April release, because we’ve already done the hard work for you.
To save you time and effort, the Visual Capitalist team has compiled a visual analysis of everything you need to know from the report—and our VC+ Special Dispatch is available exclusively to VC+ members. All you need to do is log into the VC+ Archive.
If you’re not already subscribed to VC+, make sure you sign up now to access the full analysis of the IMF report, and more (we release similar deep dives every week).
For now, here’s what VC+ members get to see.
Your Shortcut to Understanding IMF’s World Economic Outlook
With long and short-term growth prospects declining for many countries around the world, this Special Dispatch offers a visual analysis of the key figures and takeaways from the IMF’s report including:
- The global decline in economic growth forecasts
- Real GDP growth and inflation forecasts for major nations in 2024
- When interest rate cuts will happen and interest rate forecasts
- How debt-to-GDP ratios have changed since 2000
- And much more!
Get the Full Breakdown in the Next VC+ Special Dispatch
VC+ members can access the full Special Dispatch by logging into the VC+ Archive, where you can also check out previous releases.
Make sure you join VC+ now to see exclusive charts and the full analysis of key takeaways from IMF’s World Economic Outlook.
Don’t miss out. Become a VC+ member today.
What You Get When You Become a VC+ Member
VC+ is Visual Capitalist’s premium subscription. As a member, you’ll get the following:
- Special Dispatches: Deep dive visual briefings on crucial reports and global trends
- Markets This Month: A snappy summary of the state of the markets and what to look out for
- The Trendline: Weekly curation of the best visualizations from across the globe
- Global Forecast Series: Our flagship annual report that covers everything you need to know related to the economy, markets, geopolitics, and the latest tech trends
- VC+ Archive: Hundreds of previously released VC+ briefings and reports that you’ve been missing out on, all in one dedicated hub
You can get all of the above, and more, by joining VC+ today.
-

 Debt1 week ago
How Debt-to-GDP Ratios Have Changed Since 2000
-

 Markets2 weeks ago
Ranked: The World’s Top Flight Routes, by Revenue
-

 Countries2 weeks ago
Population Projections: The World’s 6 Largest Countries in 2075
-

 Markets2 weeks ago
The Top 10 States by Real GDP Growth in 2023
-

 Demographics2 weeks ago
The Smallest Gender Wage Gaps in OECD Countries
-

 United States2 weeks ago
Where U.S. Inflation Hit the Hardest in March 2024
-

 Green2 weeks ago
Top Countries By Forest Growth Since 2001
-

 United States2 weeks ago
Ranked: The Largest U.S. Corporations by Number of Employees


