Agriculture
The Uses of Corn: Industries Affected by High Corn Prices


Corn Beyond the Cob
Corn or maize is the second most-produced crop in the world, and it’s more than just a staple in our diets.
From the sweetener in our coffees to the ethanol that powers our vehicles, corn has hundreds of uses. Consequently, high corn prices have a domino effect that can affect many supply chains and possibly even increase the cost of our weekly groceries, especially if they include tortilla chips.
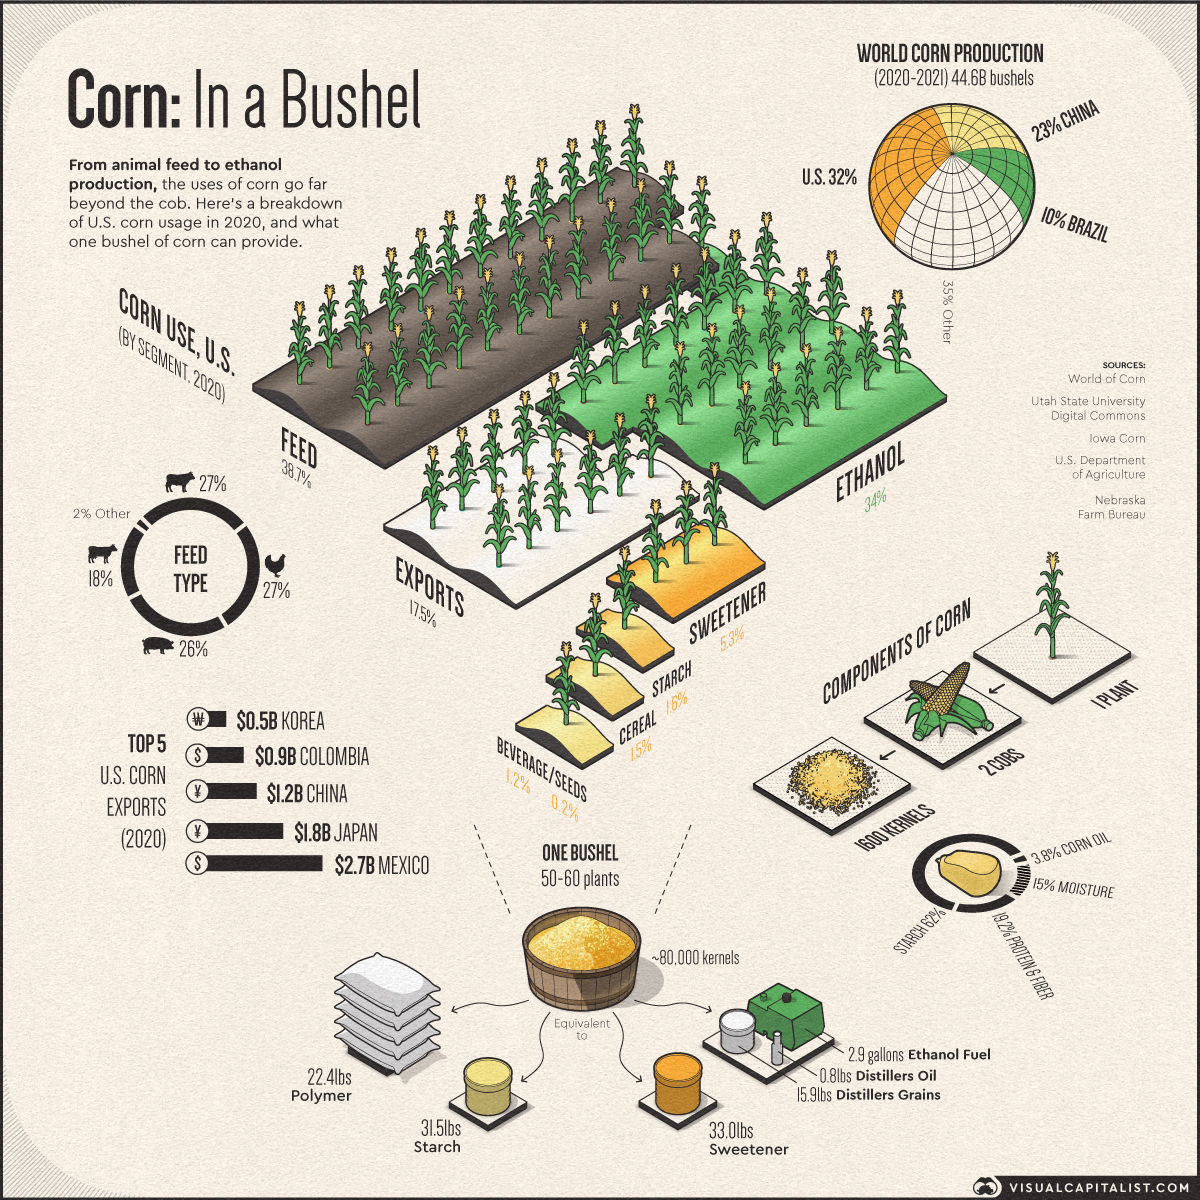
This infographic uses data from the National Corn Growers Association to break down U.S. corn use by segment in 2020, and the products that a bushel of corn can produce.
The Uses of Corn in the U.S.
While corn on the cob is quite popular, not all corn is sweet. There are five major types of corn grown around the world, and each one differs in taste and uses. Of these, yellow dent corn or field corn accounts for the majority of commercial U.S. production.
Here’s a breakdown of U.S. corn usage in 2020:
| Segment | Bushels Used (millions) | % of Usage (2020) |
|---|---|---|
| Feed | 5,650 | 38.7% |
| Ethanol (Fuel) | 3,875 | 26.6% |
| Exports | 2,550 | 17.5% |
| Ethanol (Animal Feed) | 1,075 | 7.4% |
| Sweeteners | 780 | 5.3% |
| Starch | 230 | 1.6% |
| Cereal/Other | 215 | 1.5% |
| Beverages/Alcohol | 170 | 1.2% |
| Seeds | 30 | 0.2% |
| Total | 14,575 | 100% |
Corn accounts for more than 96% of U.S. feed grain use and production. As a result, animal feed makes up nearly 40% of the country’s corn usage. This is because corn is a rich source of carbohydrates, and in combination with protein from soybeans, it can make for an effective diet for livestock.
In the United States, federal mandates require vehicles to use a blend of gasoline and biofuels like ethanol—94% of which is produced from the starch in corn grain. Therefore, a large portion of U.S. corn goes into ethanol production.
Interestingly, the ethanol distillation process produces a co-product known as dried distillers grain, which serves as low-cost, protein-rich animal feed for livestock. On average, the U.S. ethanol industry produces around 90,000 tons of distillers grains each week.
Animal feed and ethanol production collectively make up around 73% of U.S. corn usage. Other uses of corn include the production of sweeteners, starch, cereal, and alcoholic beverages like whiskey.
Breaking Down U.S. Corn Exports
The U.S. is the world’s largest producer and exporter of corn and accounted for roughly 36% of exports in 2020.
Up until 2019, the majority of U.S. corn exports went to Mexico, Japan, and Colombia. China wasn’t among the top 10 destinations, but this changed in 2020.
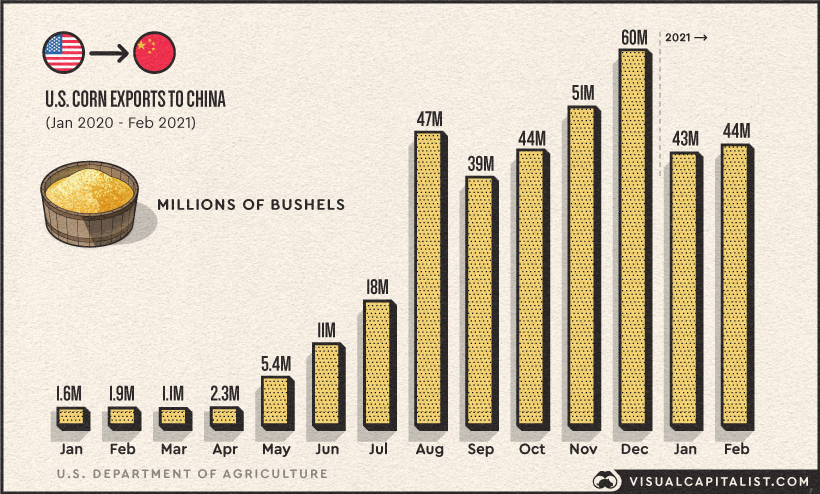
Between January 2020 and 2021, U.S. corn exports to China increased exponentially, reaching an all-time high in December. China’s massive import appetite is because of a shortage of domestic supplies amid rising demand for feed from its recovering hog-herd, which was hit by the African swine fever in 2018.
Consequently, China became the third-largest importer of U.S. corn in 2020 after Mexico and Brazil. What’s more, the U.S. Department of Agriculture projects that China’s corn imports in 2021 will be much higher than 2020 levels, and the majority of those will be sourced from the United States.
The Corn Price Boom
In addition to a drought-induced yield cut in Brazil, rising demand from China has driven corn prices to their highest level in the last eight years.
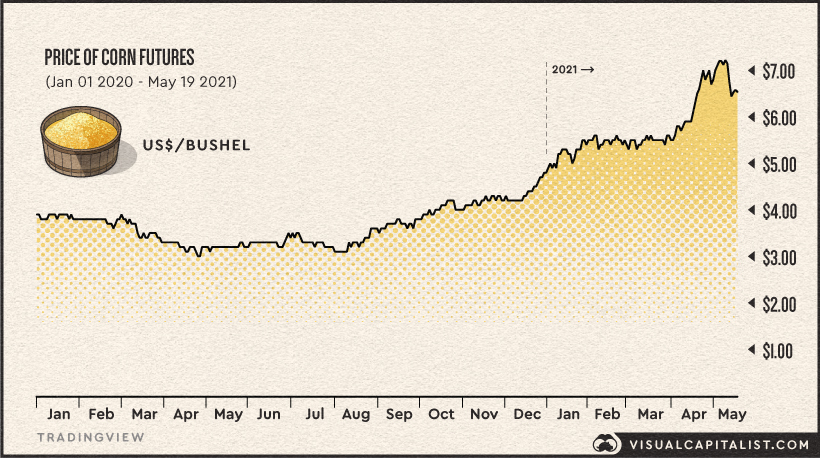
Since the beginning of 2020, corn prices have increased 68% and stand at around $6.50 per bushel as of May 19th.
The rise in corn prices is likely to affect several industries and could translate into higher prices for our groceries, including cereals, taco shells, and corn syrups. Additionally, it could also push up the price of gas due to its key role in ethanol production.
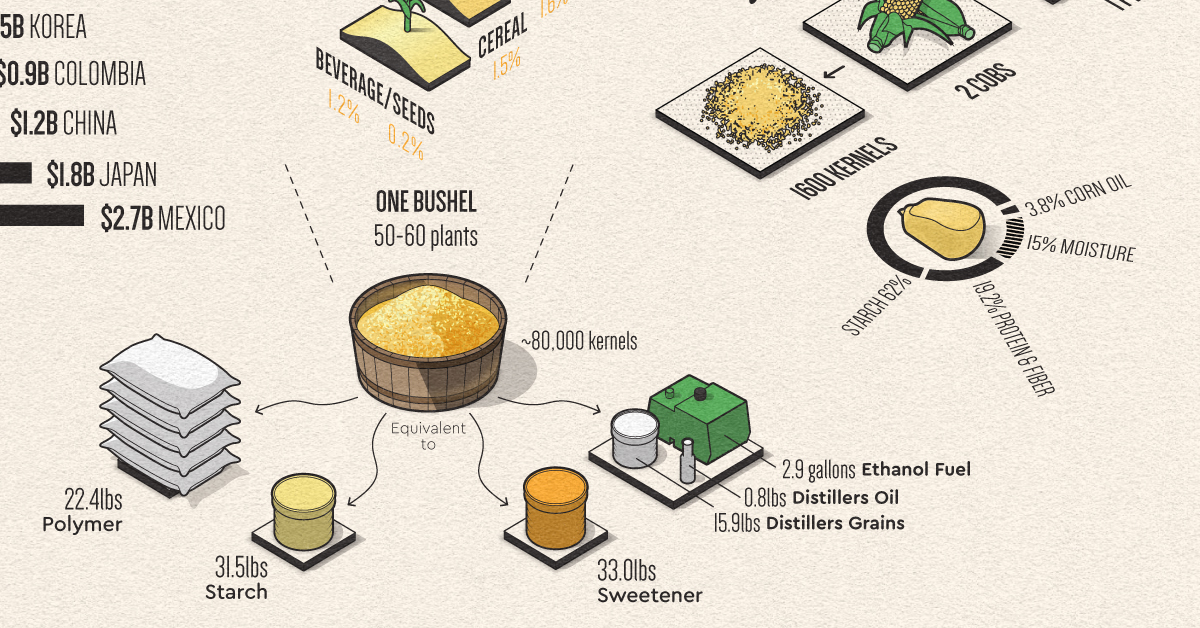
Corn, in a Bushel
In a world where commodities like corn are often taken for granted, it’s important to think about how valuable it can be.
A single bushel of corn can provide 33 lbs of sweetener, 31.5 lbs of starch, or 22.4 lbs of polymers. It’s also enough to produce around 3 gallons of ethanol fuel and 16 lbs of distillers dried grains for animal feed.
The uses of corn go far beyond the cob, and just like other raw materials, it supports many industries that make modern life possible.


Agriculture
The World’s Top Cocoa Producing Countries
Here are the largest cocoa producing countries globally—from Côte d’Ivoire to Brazil—as cocoa prices hit record highs.
The World’s Top Cocoa Producing Countries
This was originally posted on our Voronoi app. Download the app for free on iOS or Android and discover incredible data-driven charts from a variety of trusted sources.
West Africa is home to the largest cocoa producing countries worldwide, with 3.9 million tonnes of production in 2022.
In fact, there are about one million farmers in Côte d’Ivoire supplying cocoa to key customers such as Nestlé, Mars, and Hershey. But the massive influence of this industry has led to significant forest loss to plant cocoa trees.
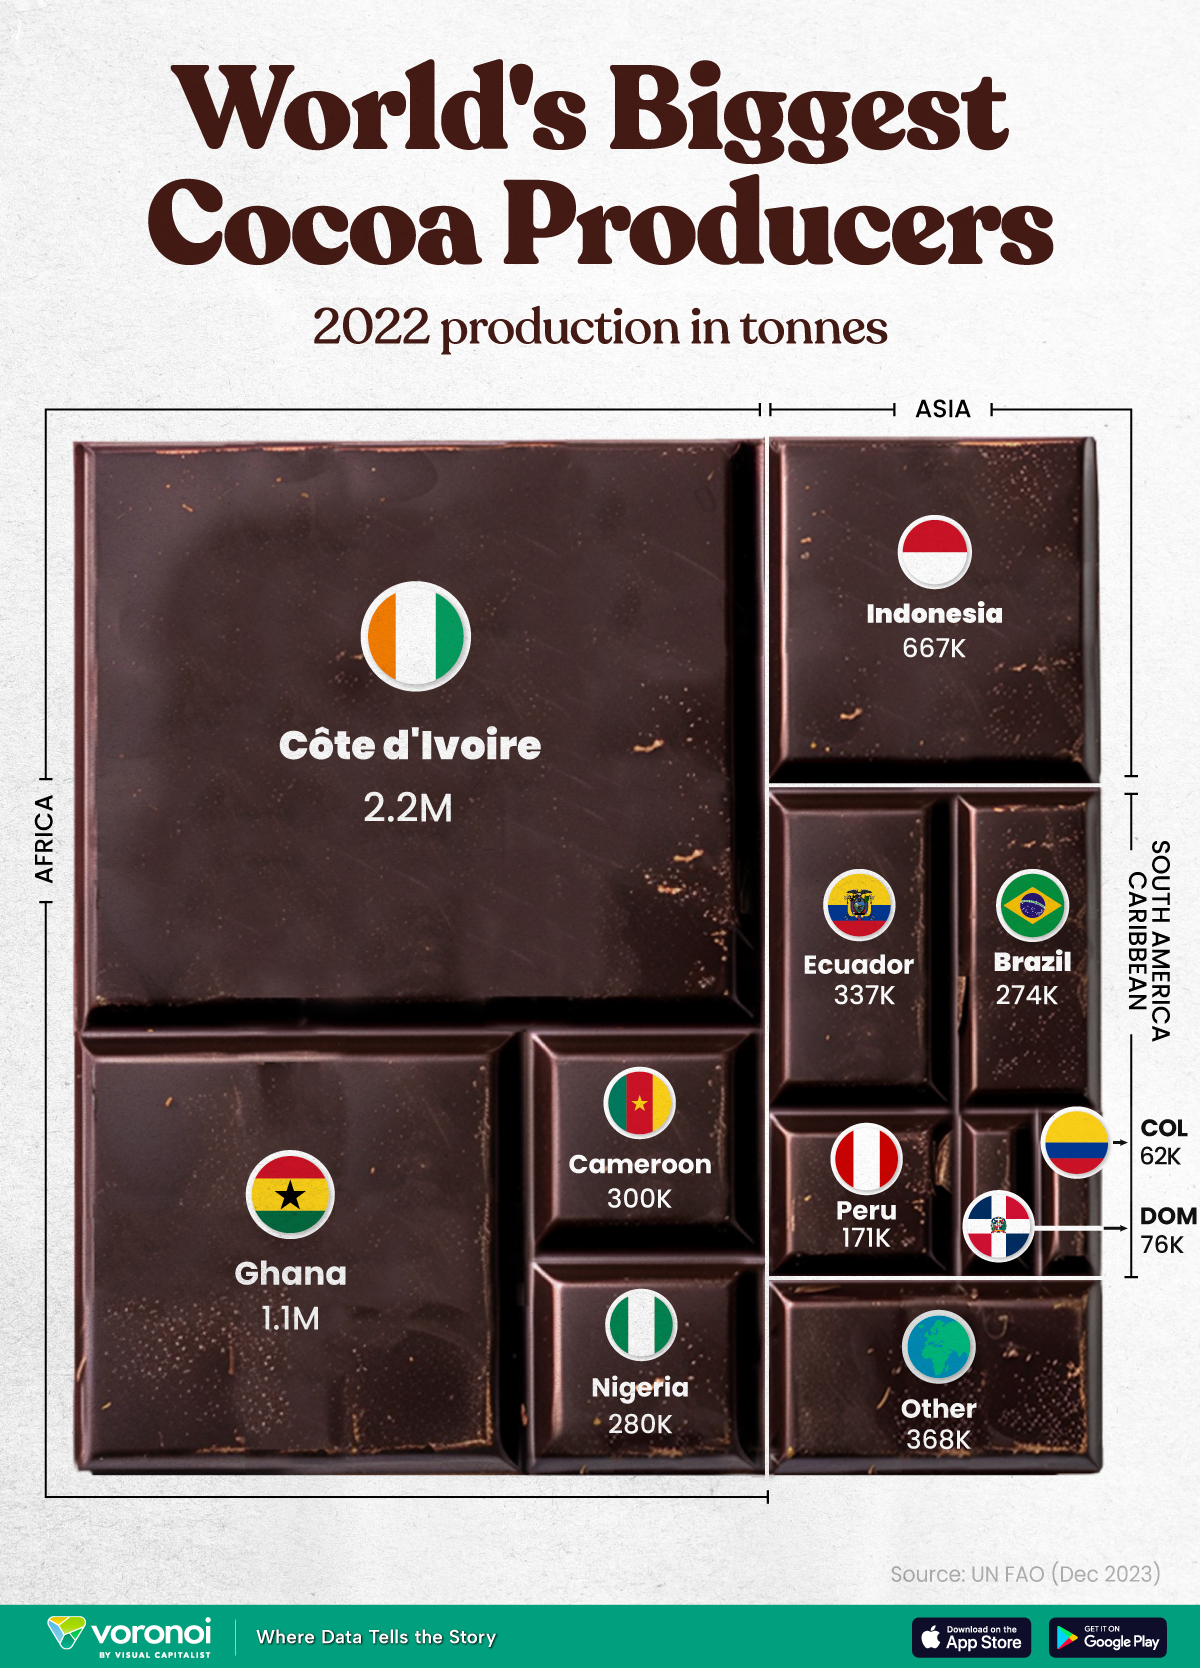
This graphic shows the leading producers of cocoa, based on data from the UN FAO.
Global Hotspots for Cocoa Production
Below, we break down the top cocoa producing countries as of 2022:
| Country | 2022 Production, Tonnes |
|---|---|
| 🇨🇮 Côte d'Ivoire | 2.2M |
| 🇬🇭 Ghana | 1.1M |
| 🇮🇩 Indonesia | 667K |
| 🇪🇨 Ecuador | 337K |
| 🇨🇲 Cameroon | 300K |
| 🇳🇬 Nigeria | 280K |
| 🇧🇷 Brazil | 274K |
| 🇵🇪 Peru | 171K |
| 🇩🇴 Dominican Republic | 76K |
| 🌍 Other | 386K |
With 2.2 million tonnes of cocoa in 2022, Côte d’Ivoire is the world’s largest producer, accounting for a third of the global total.
For many reasons, the cocoa trade in Côte d’Ivoire and Western Africa has been controversial. Often, farmers make about 5% of the retail price of a chocolate bar, and earn $1.20 each day. Adding to this, roughly a third of cocoa farms operate on forests that are meant to be protected.
As the third largest producer, Indonesia produced 667,000 tonnes of cocoa with the U.S., Malaysia, and Singapore as major importers. Overall, small-scale farmers produce 95% of cocoa in the country, but face several challenges such as low pay and unwanted impacts from climate change. Alongside aging trees in the country, these setbacks have led productivity to decline.
In South America, major producers include Ecuador and Brazil. In the early 1900s, Ecuador was the world’s largest cocoa producing country, however shifts in the global marketplace and crop disease led its position to fall. Today, the country is most known for its high-grade single-origin chocolate, with farms seen across the Amazon rainforest.
Altogether, global cocoa production reached 6.5 million tonnes, supported by strong demand. On average, the market has grown 3% annually over the last several decades.

-

 Debt1 week ago
How Debt-to-GDP Ratios Have Changed Since 2000
-

 Markets2 weeks ago
Ranked: The World’s Top Flight Routes, by Revenue
-

 Countries2 weeks ago
Population Projections: The World’s 6 Largest Countries in 2075
-

 Markets2 weeks ago
The Top 10 States by Real GDP Growth in 2023
-

 Demographics2 weeks ago
The Smallest Gender Wage Gaps in OECD Countries
-

 United States2 weeks ago
Where U.S. Inflation Hit the Hardest in March 2024
-

 Green2 weeks ago
Top Countries By Forest Growth Since 2001
-

 United States2 weeks ago
Ranked: The Largest U.S. Corporations by Number of Employees