Business
How Powerful is Your Passport in a Post-Pandemic World?


How Powerful is Your Passport in a Post-Pandemic World?
With COVID-19 cases falling in many parts of the world and vaccination programs ramping up at warp speed, international travel no longer seems like a distant dream.
The Henley Passport Index, which has been regularly monitoring the world’s most travel-friendly passports since 2006, has released its latest rankings and analysis.
The most recent data provides insight into what travel freedom will look like in a post-pandemic world as countries selectively begin to open their borders to international visitors.
Prominent Countries Still Holding Strong
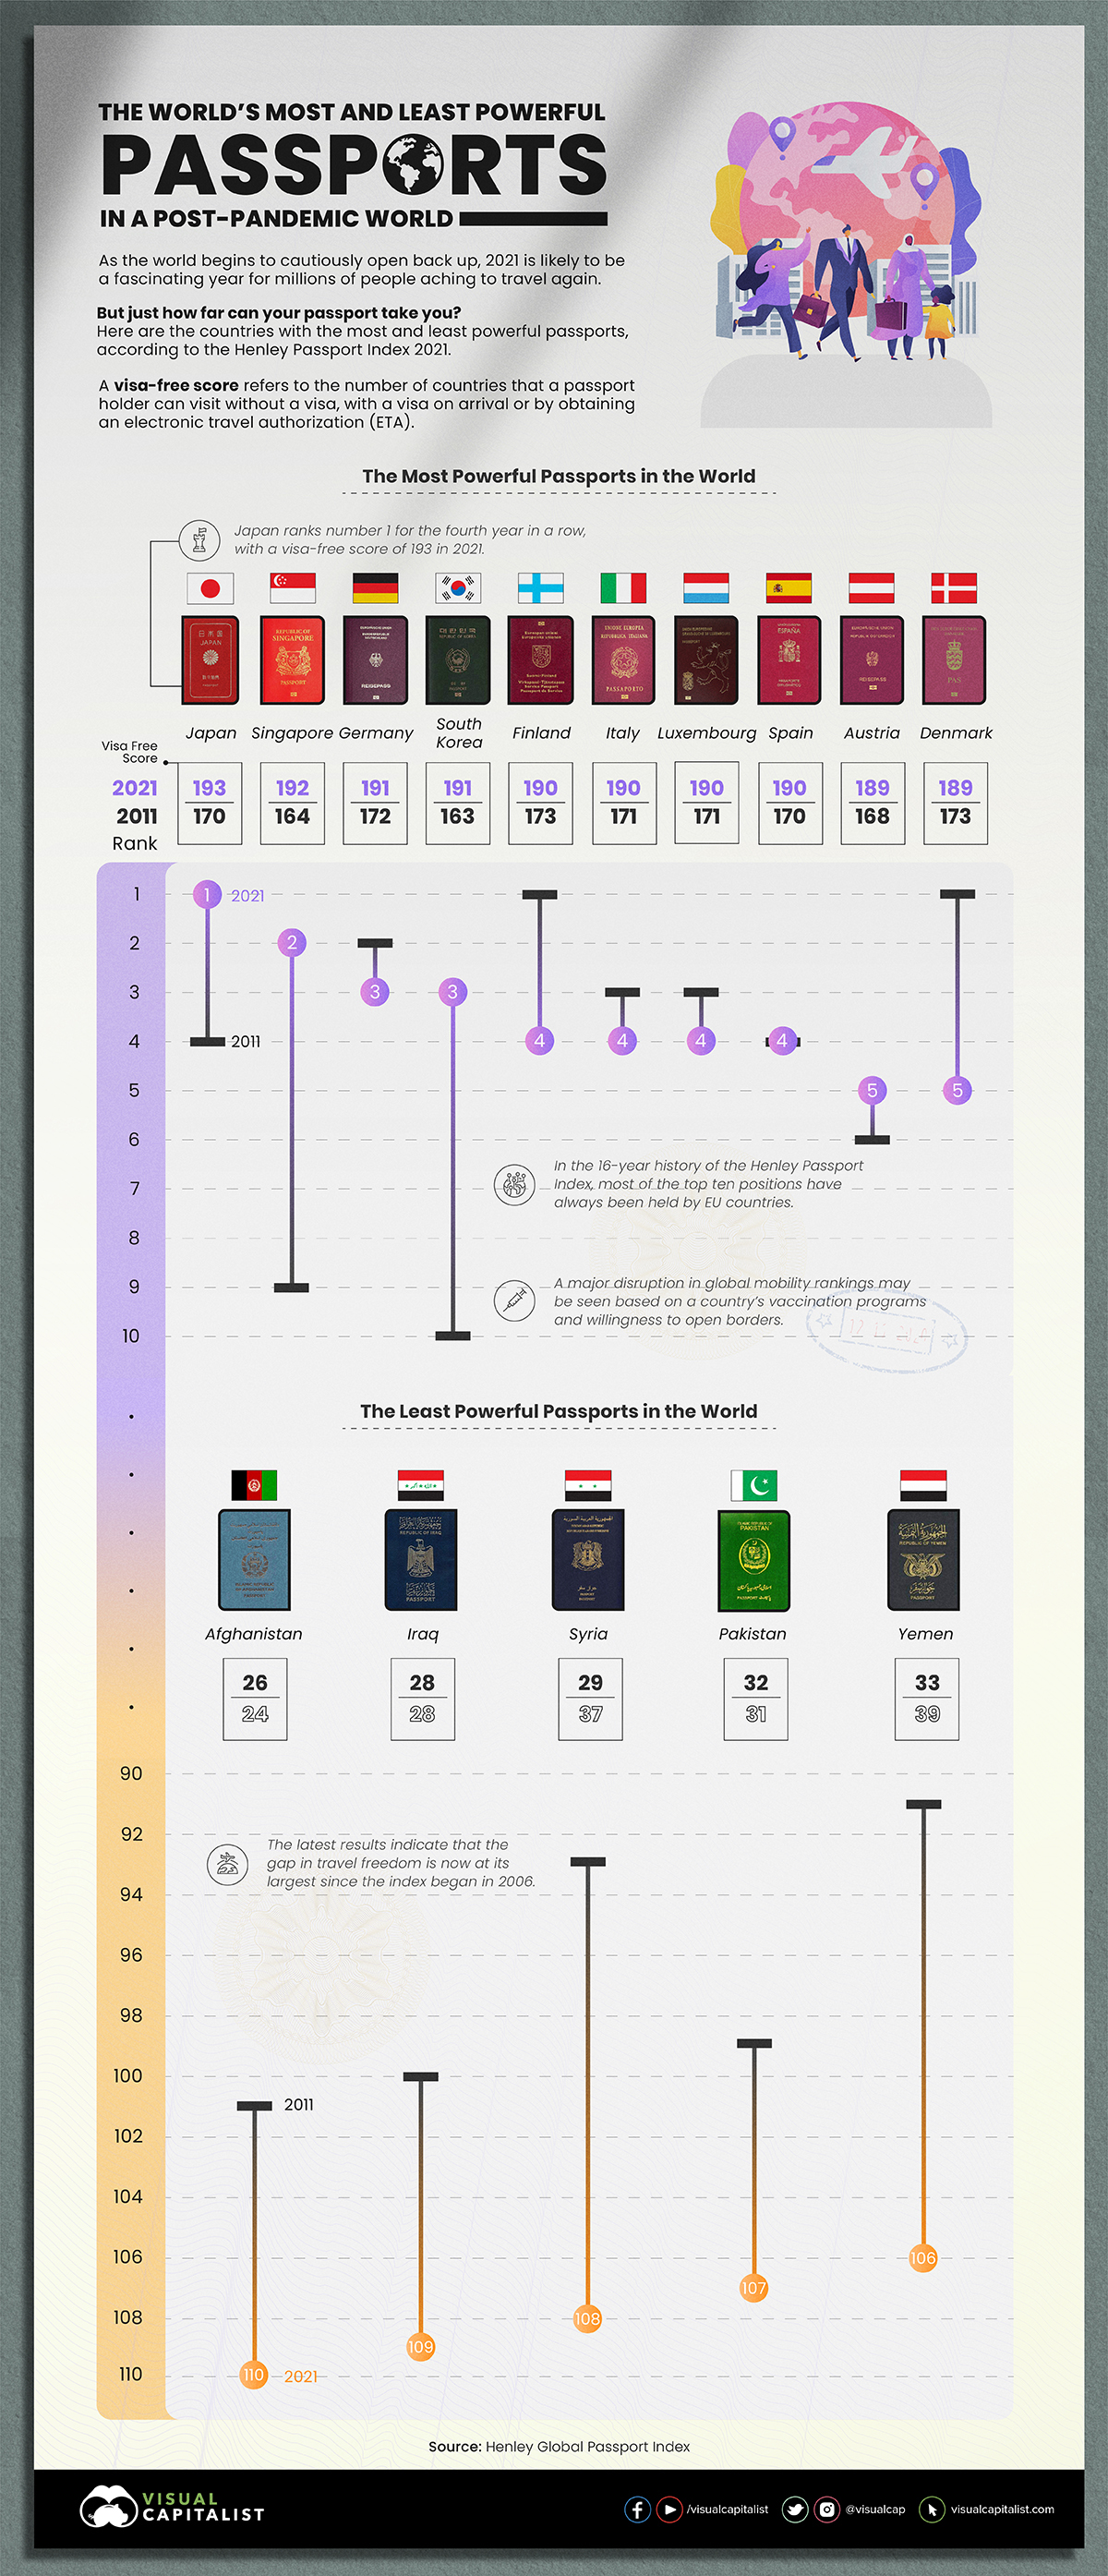
The rankings are based on the visa-free score of a particular country. A visa-free score refers to the number of countries that a passport holder can visit without a visa, with a visa on arrival, or by obtaining an electronic travel authorization (ETA).
Without considering the constantly changing COVID-19 restrictions, Japan firmly holds its position as the country with the strongest passport for the 4th year in a row.
This positioning is based on exclusive data from the International Air Transport Association (IATA)—with Japanese passport holders theoretically able to access a record 193 destinations from around the world visa-free.
The last time Japan didn’t hold the number one position was back in 2017, when it shared the 5th spot with countries like the United States, New Zealand, and Switzerland.
| Rank (2021) | Country | Visa-Free Score (2021) | Rank (2011) | Visa-Free Score (2011) |
|---|---|---|---|---|
| 1 | 🇯🇵 Japan | 193 | 4 | 170 |
| 2 | 🇸🇬 Singapore | 192 | 9 | 164 |
| 3 | 🇩🇪 Germany | 191 | 2 | 172 |
| 3 | 🇰🇷 South Korea | 191 | 10 | 163 |
| 4 | 🇫🇮 Finland | 190 | 1 | 173 |
| 4 | 🇮🇹 Italy | 190 | 3 | 171 |
| 4 | 🇱🇺 Luxembourg | 190 | 3 | 171 |
| 4 | 🇪🇸 Spain | 190 | 4 | 170 |
| 5 | 🇦🇹 Austria | 189 | 6 | 168 |
| 5 | 🇩🇰 Denmark | 189 | 1 | 173 |
Singapore remains in 2nd place, with a visa-free score of 192, while Germany and South Korea again share joint-3rd place, each with access to 191 destinations.
Throughout the 16-year history of the Henley Index, EU countries have maintained a dominant position in the passport strength reports. Finland, Italy, Luxembourg and Spain all hold the 4th position while Austria and Denmark round up the top 5 with a visa-free score of 189.
| Country | Rank (2011) | Rank (2021) | Difference |
|---|---|---|---|
| 🇺🇸 United States | 5 | 7 | -2 |
| 🇨🇦 Canada | 9 | 9 | 0 |
| 🇲🇽 Mexico | 29 | 23 | 6 |
| 🇬🇧 United Kingdom | 3 | 7 | -4 |
| 🇧🇷 Brazil | 25 | 17 | 8 |
The United States and the United Kingdom jointly share the 7th position with a visa-free score of 187 destinations. Canada, Mexico and Brazil hold the 9th, 23rd and 17th positions respectively, with Brazil experiencing a significant jump of eight places over the last 10 years.
Editor’s note: Visit the Henley Passport Index site for a full list and ranking of all countries around the world.
The Countries With The Least Travel Freedom
Afghanistan continues to be the country with the least amount of travel freedom, coming in last place (110th rank) with a visa-free score of 26 destinations. Iraq, Syria, Pakistan and Yemen have access to slightly more visa-free travel, but still linger at the bottom of the overall ranking.
| Rank (2021) | Country | Visa-Free Score (2021) | Rank (2011) | Visa-Free Score (2011) |
|---|---|---|---|---|
| 110 | 🇦🇫 Afghanistan | 26 | 101 | 24 |
| 109 | 🇮🇶 Iraq | 28 | 100 | 28 |
| 108 | 🇸🇾 Syria | 29 | 93 | 37 |
| 107 | 🇵🇰 Pakistan | 32 | 99 | 31 |
| 106 | 🇾🇪 Yemen | 33 | 91 | 39 |
The latest report indicates that the gap in travel freedom is now at its largest since the index began in 2006. Japanese passport holders can access 167 more destinations than citizens of Afghanistan, who can visit only 26.
The Biggest Gainers In a Decade
Over time, small annual moves in the Henley Passport Index can make a big impact—and in the last decade, countries like China and the UAE have been the biggest movers:
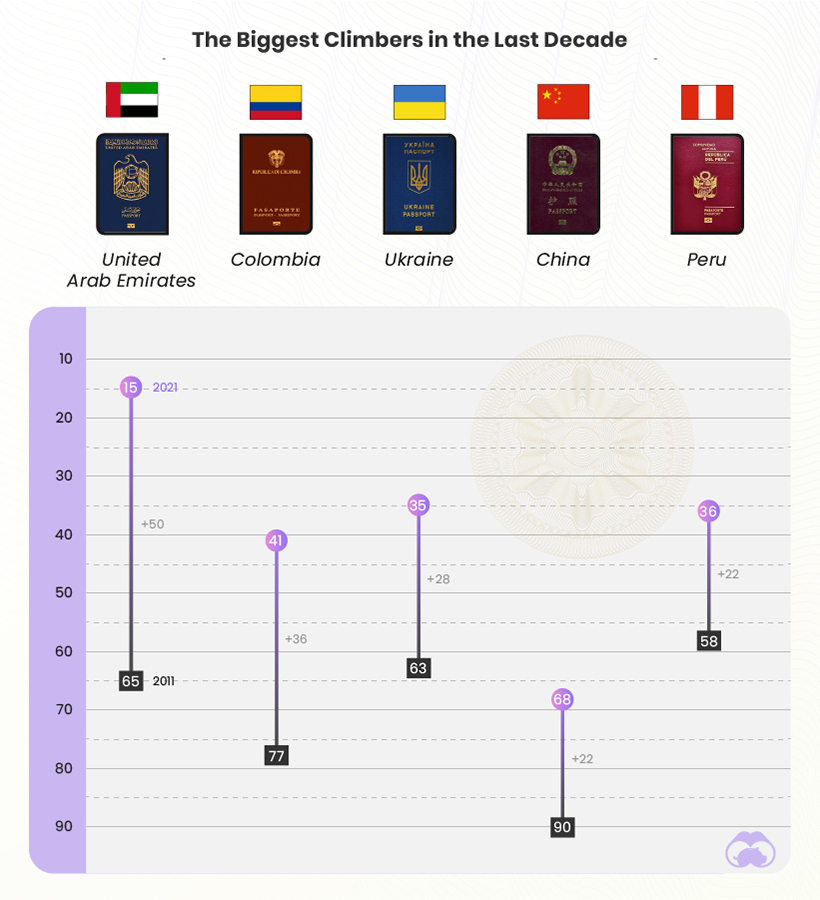
China has risen by 22 places in the ranking since 2011 by going from a visa-free/visa-on-arrival score of 40 destinations to now 77.
The most remarkable turnaround story on the index by far, however, is the UAE. In 2011, the UAE was ranked 65th with a visa-free score of 67 destinations. Today, thanks to the Emirates’ ongoing efforts to strengthen diplomatic ties with countries across the globe, it is now ranked 15th with a remarkable visa-free score of 174 destinations.


Brands
How Tech Logos Have Evolved Over Time
From complete overhauls to more subtle tweaks, these tech logos have had quite a journey. Featuring: Google, Apple, and more.


How Tech Logos Have Evolved Over Time
This was originally posted on our Voronoi app. Download the app for free on iOS or Android and discover incredible data-driven charts from a variety of trusted sources.
One would be hard-pressed to find a company that has never changed its logo. Granted, some brands—like Rolex, IBM, and Coca-Cola—tend to just have more minimalistic updates. But other companies undergo an entire identity change, thus necessitating a full overhaul.
In this graphic, we visualized the evolution of prominent tech companies’ logos over time. All of these brands ranked highly in a Q1 2024 YouGov study of America’s most famous tech brands. The logo changes are sourced from 1000logos.net.
How Many Times Has Google Changed Its Logo?
Google and Facebook share a 98% fame rating according to YouGov. But while Facebook’s rise was captured in The Social Network (2010), Google’s history tends to be a little less lionized in popular culture.
For example, Google was initially called “Backrub” because it analyzed “back links” to understand how important a website was. Since its founding, Google has undergone eight logo changes, finally settling on its current one in 2015.
| Company | Number of Logo Changes |
|---|---|
| 8 | |
| HP | 8 |
| Amazon | 6 |
| Microsoft | 6 |
| Samsung | 6 |
| Apple | 5* |
Note: *Includes color changes. Source: 1000Logos.net
Another fun origin story is Microsoft, which started off as Traf-O-Data, a traffic counter reading company that generated reports for traffic engineers. By 1975, the company was renamed. But it wasn’t until 2012 that Microsoft put the iconic Windows logo—still the most popular desktop operating system—alongside its name.
And then there’s Samsung, which started as a grocery trading store in 1938. Its pivot to electronics started in the 1970s with black and white television sets. For 55 years, the company kept some form of stars from its first logo, until 1993, when the iconic encircled blue Samsung logo debuted.
Finally, Apple’s first logo in 1976 featured Isaac Newton reading under a tree—moments before an apple fell on his head. Two years later, the iconic bitten apple logo would be designed at Steve Jobs’ behest, and it would take another two decades for it to go monochrome.

-

 Science1 week ago
Visualizing the Average Lifespans of Mammals
-

 Markets2 weeks ago
The Top 10 States by Real GDP Growth in 2023
-

 Demographics2 weeks ago
The Smallest Gender Wage Gaps in OECD Countries
-

 United States2 weeks ago
Where U.S. Inflation Hit the Hardest in March 2024
-

 Green2 weeks ago
Top Countries By Forest Growth Since 2001
-

 United States2 weeks ago
Ranked: The Largest U.S. Corporations by Number of Employees
-

 Maps2 weeks ago
The Largest Earthquakes in the New York Area (1970-2024)
-

 Green2 weeks ago
Ranked: The Countries With the Most Air Pollution in 2023