Demographics
The Population Race: A 300-Year Look at China vs. India
Click on “Add Country” to compare more population trajectories, or explore the historical map and full data tables.
The Population Race: A 300-Year Look at China vs. India
One of the biggest demographic milestones that our world faces is less than a decade away.
Today, China and India boast the largest populations, outpacing all others by a mile. The total populations of these two nations have been climbing for years, but India is moving at a faster clip. The big question is: When will India overtake China in population?
This interactive chart by Our World in Data pulls past and projected population data from the United Nations, comparing the 300-year trajectory of China vs. India to answer this burning question.
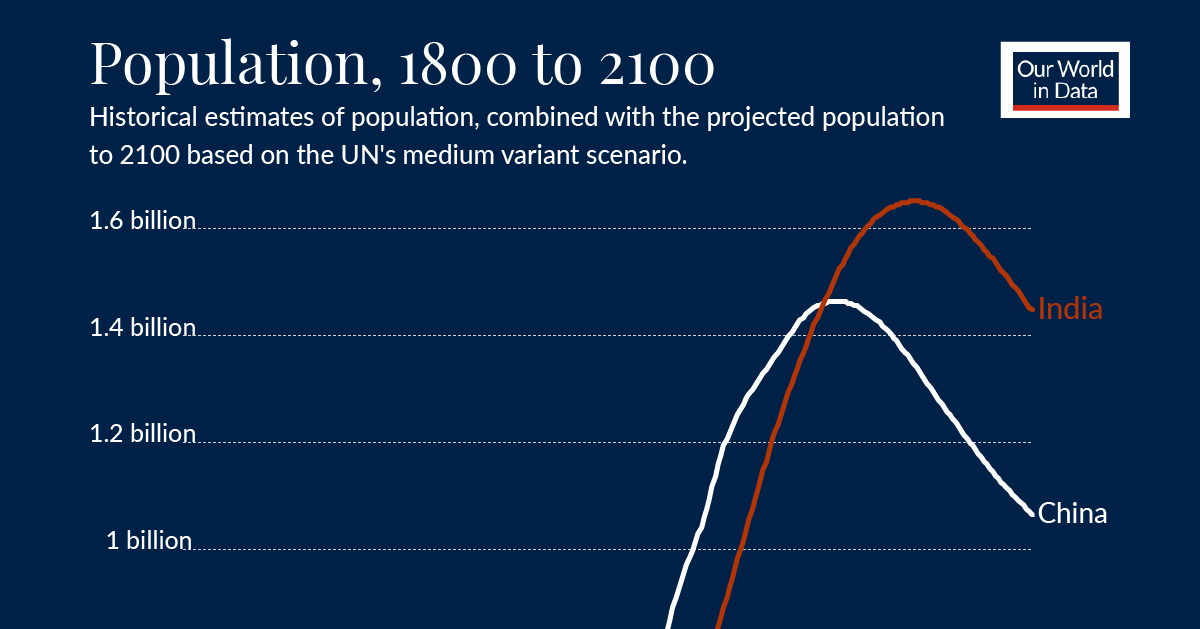
China vs. India Population (1800-2100p)
In 1800, India’s population was at a modest 169 million. In contrast, the Chinese population was nearly double that with 322 million at the turn of the 19th century.
It wasn’t until 1950 that the total populations of both countries started shooting up exponentially, and here’s where it starts to get interesting. China reached the 1 billion milestone in 1980, while India took a little longer to get there in 1997.
And now, India is on target to overtake China’s total population in 2026, when both countries are expected to be at the 1.46 billion people mark.
| Country | 1800 | 2026p | 2100p | Absolute change (1800-2100) | Relative change |
|---|---|---|---|---|---|
| 🇨🇳 China | 321.68M | 1.46B | 1.06B | +743.3M | 231% |
| 🇮🇳 India | 168.57M | 1.46B | 1.45B | +1.28B | 758% |
*Note: Absolute change numbers may not be exact due to rounding.
Although the populations of both countries will begin contracting in the mid-21st century, India is expected to stay atop the global population leaderboard even by more moderate estimates.
China vs. India Demographics
While it appears that population growth in India is effectively mirroring that of China, there’s more to examine under the surface.
What demographic trends lie behind the eventual contraction later this century? Let’s look at the two population pyramids to find out.
In China, growth has been underscored by a strict “one-child” policy, implemented in 1979. Even with the updated “two-child” policy in 2016, there’s no coming back from this decision—China is now contending with a rapidly aging population. It’s anticipated that over one-third of Chinese citizens will be 65 years old and above by 2050.
Meanwhile in neighboring India, the workforce is just beginning to take off—65% of its population is currently aged 35 years and below. High rates of digital adoption are further compounding economic growth in the country, especially as the world becomes increasingly reliant on telecom and IT services.
China vs. India Economy
Another question this dramatic change begs is: at these rates of population change, can India’s GDP growth also surpass China’s in the next several decades?
The short answer is likely a no, although both countries will still see immense GDP gains during this time. According to PwC, six of the seven largest economies in the world by 2050 will be today’s emerging markets—led by China and India in that order.
| Country | GDP (PPP) 2016 | GDP (PPP) 2050 | Share of global GDP (2050) | Change (2016-2050) |
|---|---|---|---|---|
| 🇨🇳 China | $21.3T | $58.5T | 20% | +2% (p.p.) |
| 🇮🇳 India | $8.7T | $44.1T | 15% | +8% (p.p.) |
| 🇺🇸 U.S. | $18.6T | $34.1T | 12% | -4% (p.p.) |
While India isn’t likely to be the “next” China in terms of global GDP, it’s certainly giving it a fair fight as a potential rising superpower—and it all stems from the combined might of its growing population.


Demographics
The Countries That Have Become Sadder Since 2010
Tracking Gallup survey data for more than a decade reveals some countries are witnessing big happiness declines, reflecting their shifting socio-economic conditions.


The Countries That Have Become Sadder Since 2010
This was originally posted on our Voronoi app. Download the app for free on iOS or Android and discover incredible data-driven charts from a variety of trusted sources.
Can happiness be quantified?
Some approaches that try to answer this question make a distinction between two differing components of happiness: a daily experience part, and a more general life evaluation (which includes how people think about their life as a whole).
The World Happiness Report—first launched in 2012—has been making a serious go at quantifying happiness, by examining Gallup poll data that asks respondents in nearly every country to evaluate their life on a 0–10 scale. From this they extrapolate a single “happiness score” out of 10 to compare how happy (or unhappy) countries are.
More than a decade later, the 2024 World Happiness Report continues the mission. Its latest findings also include how some countries have become sadder in the intervening years.
Which Countries Have Become Unhappier Since 2010?
Afghanistan is the unhappiest country in the world right now, and is also 60% unhappier than over a decade ago, indicating how much life has worsened since 2010.
In 2021, the Taliban officially returned to power in Afghanistan, after nearly two decades of American occupation in the country. The Islamic fundamentalist group has made life harder, especially for women, who are restricted from pursuing higher education, travel, and work.
On a broader scale, the Afghan economy has suffered post-Taliban takeover, with various consequent effects: mass unemployment, a drop in income, malnutrition, and a crumbling healthcare system.
| Rank | Country | Happiness Score Loss (2010–24) | 2024 Happiness Score (out of 10) |
|---|---|---|---|
| 1 | 🇦🇫 Afghanistan | -2.6 | 1.7 |
| 2 | 🇱🇧 Lebanon | -2.3 | 2.7 |
| 3 | 🇯🇴 Jordan | -1.5 | 4.2 |
| 4 | 🇻🇪 Venezuela | -1.3 | 5.6 |
| 5 | 🇲🇼 Malawi | -1.2 | 3.4 |
| 6 | 🇿🇲 Zambia | -1.2 | 3.5 |
| 7 | 🇧🇼 Botswana | -1.2 | 3.4 |
| 8 | 🇾🇪 Yemen | -1.0 | 3.6 |
| 9 | 🇪🇬 Egypt | -1.0 | 4.0 |
| 10 | 🇮🇳 India | -0.9 | 4.1 |
| 11 | 🇧🇩 Bangladesh | -0.9 | 3.9 |
| 12 | 🇨🇩 DRC | -0.7 | 3.3 |
| 13 | 🇹🇳 Tunisia | -0.7 | 4.4 |
| 14 | 🇨🇦 Canada | -0.6 | 6.9 |
| 15 | 🇺🇸 U.S. | -0.6 | 6.7 |
| 16 | 🇨🇴 Colombia | -0.5 | 5.7 |
| 17 | 🇵🇦 Panama | -0.5 | 6.4 |
| 18 | 🇵🇰 Pakistan | -0.5 | 4.7 |
| 19 | 🇿🇼 Zimbabwe | -0.5 | 3.3 |
| 20 | 🇮🇪 Ireland | -0.5 | 6.8 |
| N/A | 🌍 World | +0.1 | 5.5 |
Nine countries in total saw their happiness score drop by a full point or more, on the 0–10 scale.
Noticeably, many of them have seen years of social and economic upheaval. Lebanon, for example, has been grappling with decades of corruption, and a severe liquidity crisis since 2019 that has resulted in a banking system collapse, sending poverty levels skyrocketing.
In Jordan, unprecedented population growth—from refugees leaving Iraq and Syria—has aggravated unemployment rates. A somewhat abrupt change in the line of succession has also raised concerns about political stability in the country.

-

 Education1 week ago
How Hard Is It to Get Into an Ivy League School?
-

 Technology2 weeks ago
Ranked: Semiconductor Companies by Industry Revenue Share
-

 Markets2 weeks ago
Ranked: The World’s Top Flight Routes, by Revenue
-

 Demographics2 weeks ago
Population Projections: The World’s 6 Largest Countries in 2075
-

 Markets2 weeks ago
The Top 10 States by Real GDP Growth in 2023
-

 Demographics2 weeks ago
The Smallest Gender Wage Gaps in OECD Countries
-

 Economy2 weeks ago
Where U.S. Inflation Hit the Hardest in March 2024
-

 Green2 weeks ago
Top Countries By Forest Growth Since 2001