China
Visualizing How the Demographics of China and India are Diverging
How the Demographics of China and India are Diverging
Within popular discourse, especially in the West, the profiles of China and India have become inextricably linked.
Aside from their massive populations and geographical proximity in Asia, the two nations also have deep cultural histories and traditions, growing amounts of influence on the world stage, and burgeoning middle classes.
China and India combine to be home to one-third of the world’s megacities, and they even had identical real GDP growth rates of 6.1% in 2019, based on early estimates by the IMF.
Diverging Demographics
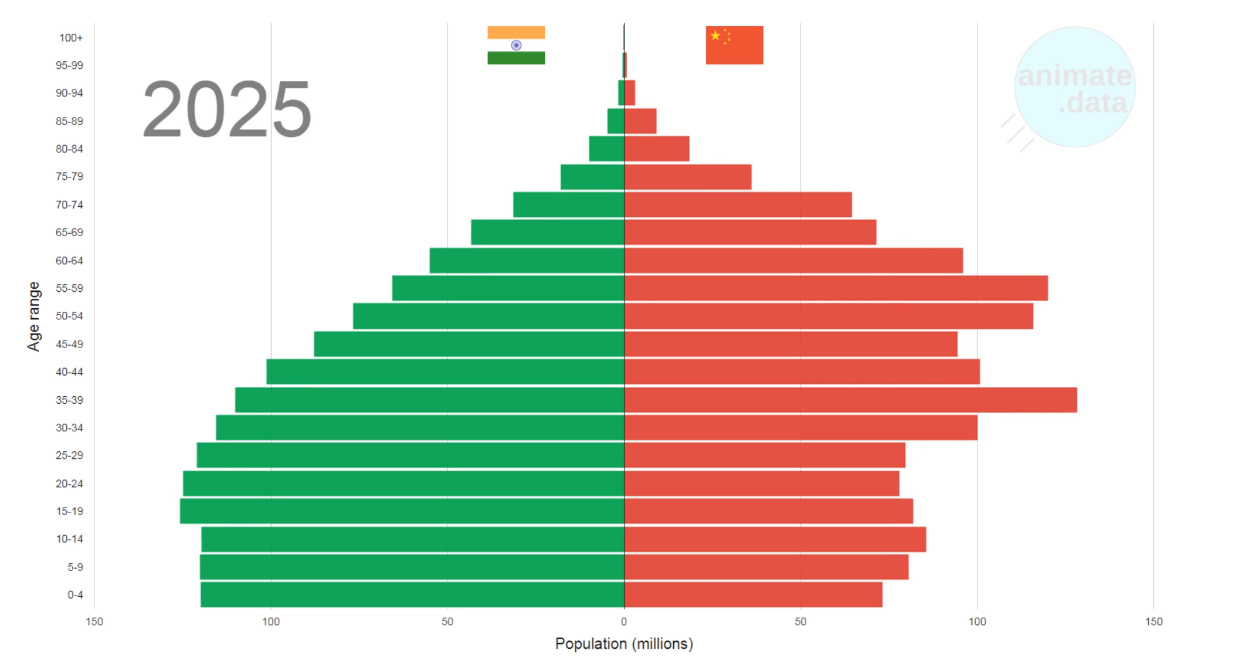
But aside from the obvious differences in their political regimes, the two populous nations have also diverged in another way: demographics.
As seen in today’s animation, which comes from AnimateData and leverages data from the United Nations, the two countries are expected to have very different demographic compositions over time as their populations age.
The easiest way to see this is through a macro lens:
Populations of China and India (1950-2100)
| 1950 | 2019 | 2050 | 2100 | |
|---|---|---|---|---|
| 🇮🇳 India | 0.38 billion | 1.37 billion | 1.64 billion | 1.45 billion |
| 🇨🇳 China | 0.55 billion | 1.43 billion | 1.40 billion | 1.06 billion |
Although the countries have roughly the same populations today — by 2050, India will add roughly 270 million more citizens, and China’s total will actually decrease by 30 million people.
Let’s look at the demographic profiles of these countries to break things down further. We’ll do this by charting populations of age groups (0-14 years, 15-24 years, 25-64 years, and 65+ years).
China: Aftermath of the One-Child Policy
China’s one-child policy was implemented in 1979 — and although it became no longer effective starting in 2016, there’s no doubt that the long-term demographic impacts of this drastic measure will be felt for generations:
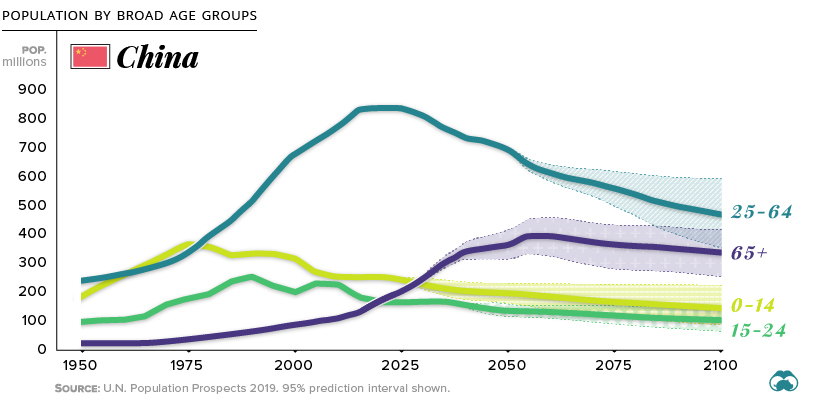
The first thing you’ll notice in the above chart is that China’s main working age population cohort (25-64 years) has essentially already peaked in size.
Further, you’ll notice that the populations of children (0-14 years) and young adults (15-24 years) have both been on the decline for decades.

A reduction in births is something that happens naturally in a demographic transition. As an economy becomes more developed, it’s common for fertility rates to decrease — but in China’s case, it has happened prematurely through policy. As a result, the country’s age distribution doesn’t really fit a typical profile.
India: A Workforce Peaking in 2050
Meanwhile, projections have India reaching a peak workforce age population near the year 2050:
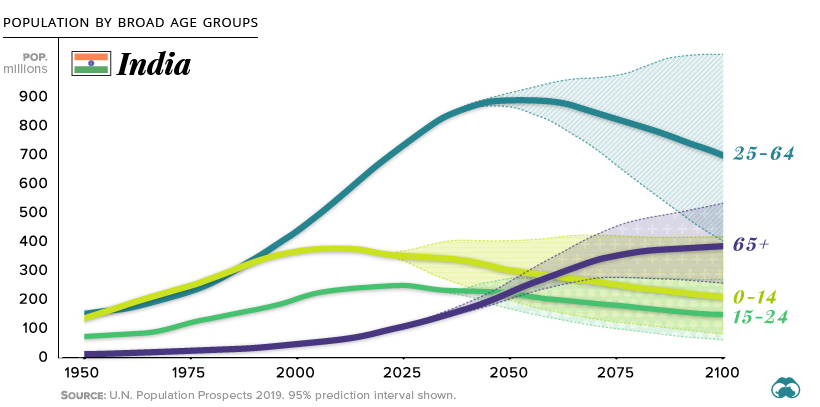
By the year 2050, it’s estimated that India’s workforce age population will be comparable in size to that of China’s today — over 800 million people strong.
However, given that this is at least 30 years in the future, it raises all kinds of questions around the economic relevance of a “working age” population in a landscape potentially dominated by technologies such as artificial intelligence and automation.
Different Paths
While it’s clear that the world’s two most populous countries have some key similarities, they are both on very different demographic paths at the moment.
China’s population has plateaued, and will eventually decline over the remainder of the 21st century. There is plenty of room to grow economically, but the weight of an aging population will create additional social and economic pressures. By 2050, it’s estimated that over one-third of the country will be 60 years or older.
On the other hand, India is following a more traditional demographic path, as long as it is uninterrupted by drastic policy decisions. The country will likely top out at 1.6-1.7 billion people, before it begins to experience the typical demographic transition already experienced by more developed economies in North America, Europe, and Japan.
And by the time the Indian workforce age group hits 800+ million people, it will be interesting to see how things interplay with the world’s inevitable technological shift to automation and a changing role for labor.
Markets
China’s Real Estate Crisis, Shown in Two Charts
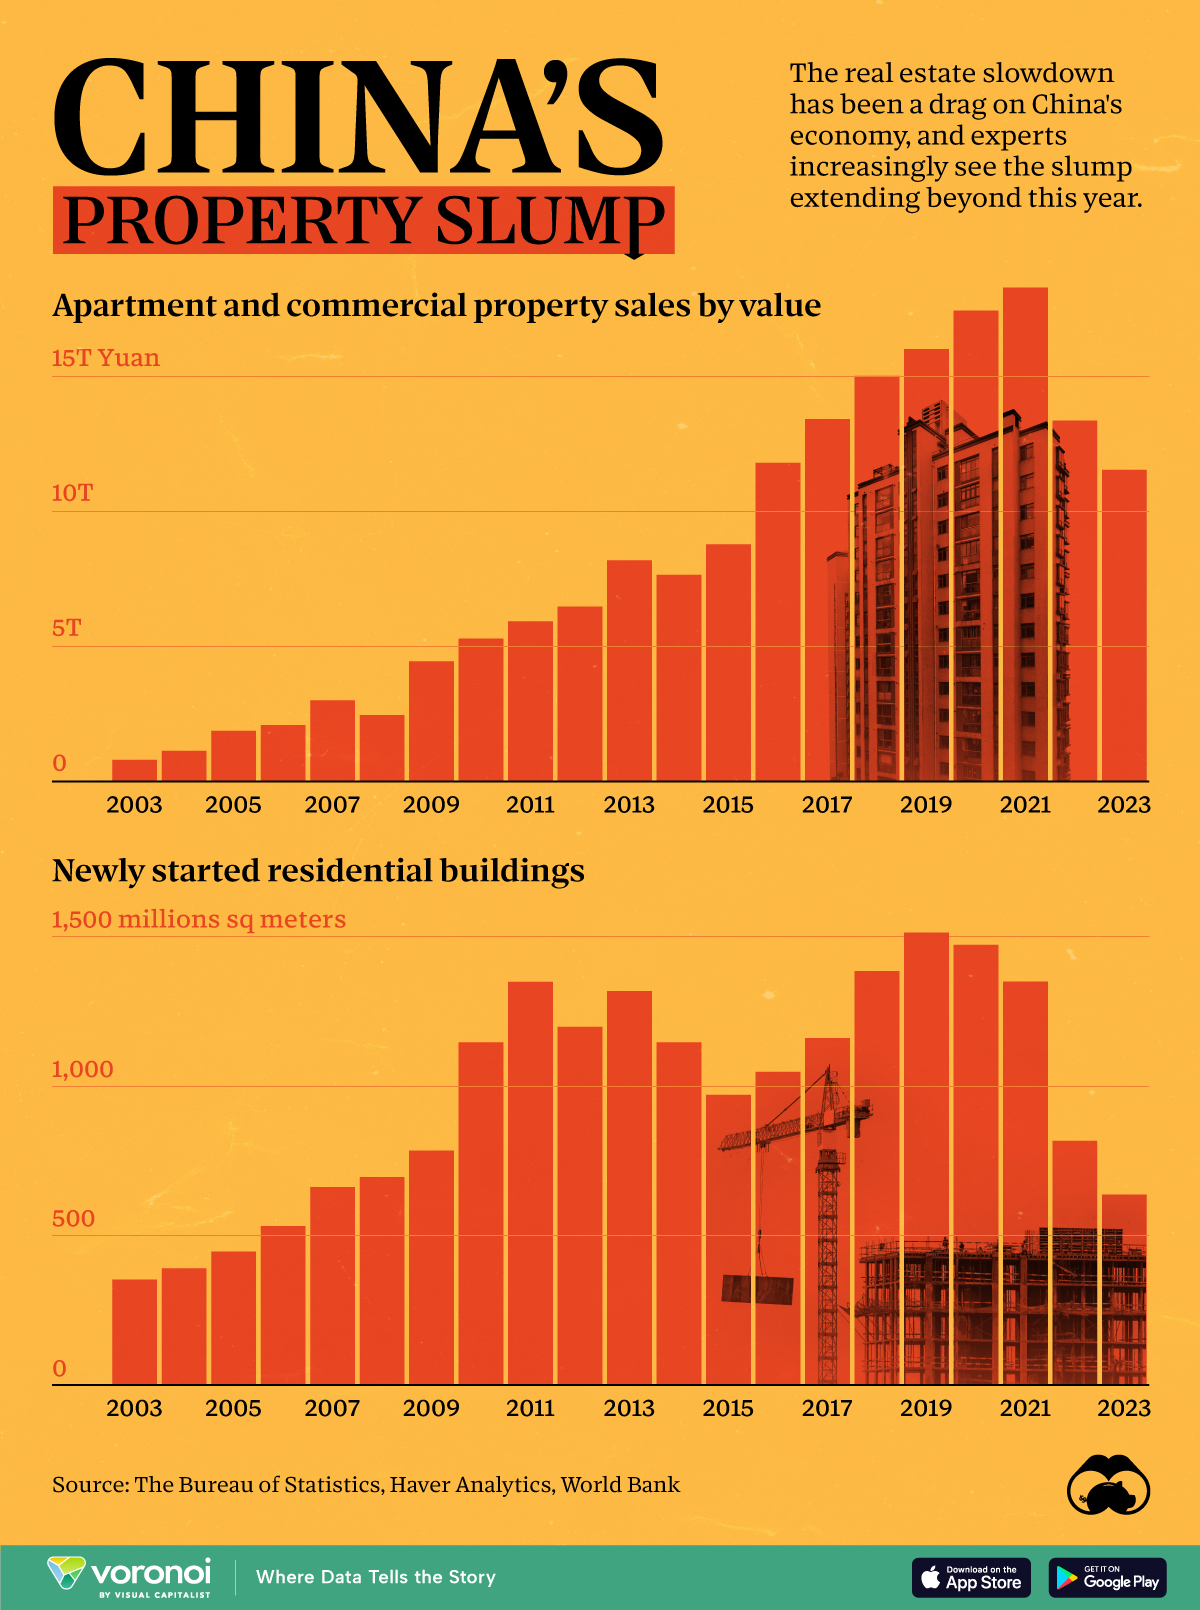
These charts show China’s real estate boom in the 21st century and the subsequent slowdown since 2022.
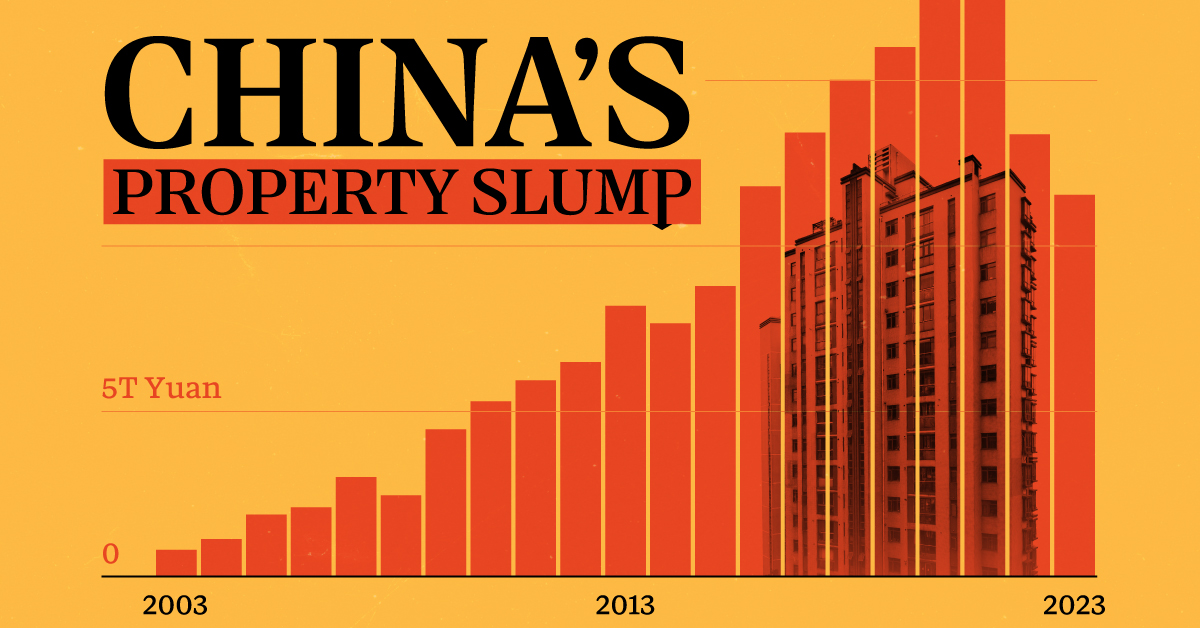
Visualizing China’s Real Estate Boom and Crisis
This was originally posted on our Voronoi app. Download the app for free on iOS or Android and discover incredible data-driven charts from a variety of trusted sources.
Evergrande—once China’s largest real estate developer—was forced to liquidate on January 28th. It was yet another strike against the country’s now fledgling real estate market, adding to a growing list of China’s economic worries.
In the charts above we show two annual metrics related to China’s real estate crisis from 2003 to 2023. The first looks at apartment and commercial property sales using Burreau of Statistics data from Bloomberg, and the second examines new housing starts using data from the World Bank.
Things to Know About China’s Property Slump
Property sales by value in China climbed pretty steadily from less than ¥1 trillion RMB in 2003 to over ¥15 trillion in 2021, but have since dropped to under ¥12 trillion in 2023.
This was the case across both residential and commercial sales. In China’s residential market specifically, new home sales dropped 6% in 2023, with secondhand home prices declining in major cities.
And on the development side, new residential developments have fallen 58% from 1,515 million m² in 2019 to 637 million m² in 2023.
| Year | New Residential Building Developments (million sq meters) |
|---|---|
| 2023 | 637.4 |
| 2022 | 817.3 |
| 2021 | 1,350.2 |
| 2020 | 1,473.4 |
| 2019 | 1,514.5 |
| 2018 | 1,385.4 |
| 2017 | 1,160.9 |
| 2016 | 1,047.8 |
| 2015 | 970.8 |
| 2014 | 1,146.4 |
| 2013 | 1,318.5 |
| 2012 | 1,199.1 |
| 2011 | 1,349.4 |
| 2010 | 1,147.2 |
| 2009 | 784.9 |
| 2008 | 695.4 |
| 2007 | 662.3 |
| 2006 | 531.8 |
| 2005 | 446.5 |
| 2004 | 390.0 |
| 2003 | 352.4 |
| 2002 | 276.5 |
Here are a few more things to know about the ongoing real estate crisis in China:
- Developer Defaults: Real estate firms faced $125 billion in bond defaults between 2020 and 2023.
- Economic Impact: The property sector’s slump has dragged down China’s economy, leading to layoffs and financial instability.
- Getting Creative: Municipalities, many of which rely on land sales as a key source of income, have been introducing “old-for-new” support measures meant to stimulate new home purchases.
Experts predict a prolonged downturn, with many people souring on Chinese investments, but exactly how things will develop after Evergrande’s collapse is unclear.
-

 Education1 week ago
How Hard Is It to Get Into an Ivy League School?
-

 Technology2 weeks ago
Ranked: Semiconductor Companies by Industry Revenue Share
-

 Markets2 weeks ago
Ranked: The World’s Top Flight Routes, by Revenue
-

 Demographics2 weeks ago
Population Projections: The World’s 6 Largest Countries in 2075
-

 Markets2 weeks ago
The Top 10 States by Real GDP Growth in 2023
-

 Demographics2 weeks ago
The Smallest Gender Wage Gaps in OECD Countries
-

 Economy2 weeks ago
Where U.S. Inflation Hit the Hardest in March 2024
-

 Green2 weeks ago
Top Countries By Forest Growth Since 2001

