Technology
The Outlook for Automation and Manufacturing Jobs in Seven Charts
View a high resolution version of this graphic.
The Outlook for Automation and Manufacturing in Seven Charts
View the high resolution version of today’s graphic by clicking here.
Over the last decade, the prospect of mass automation has seemingly shifted from a vague possibility to an inescapable reality.
While it’s still incredibly difficult to estimate the ultimate impact of automation and AI on the economy, the picture is starting to become a bit clearer as projections begin to converge.
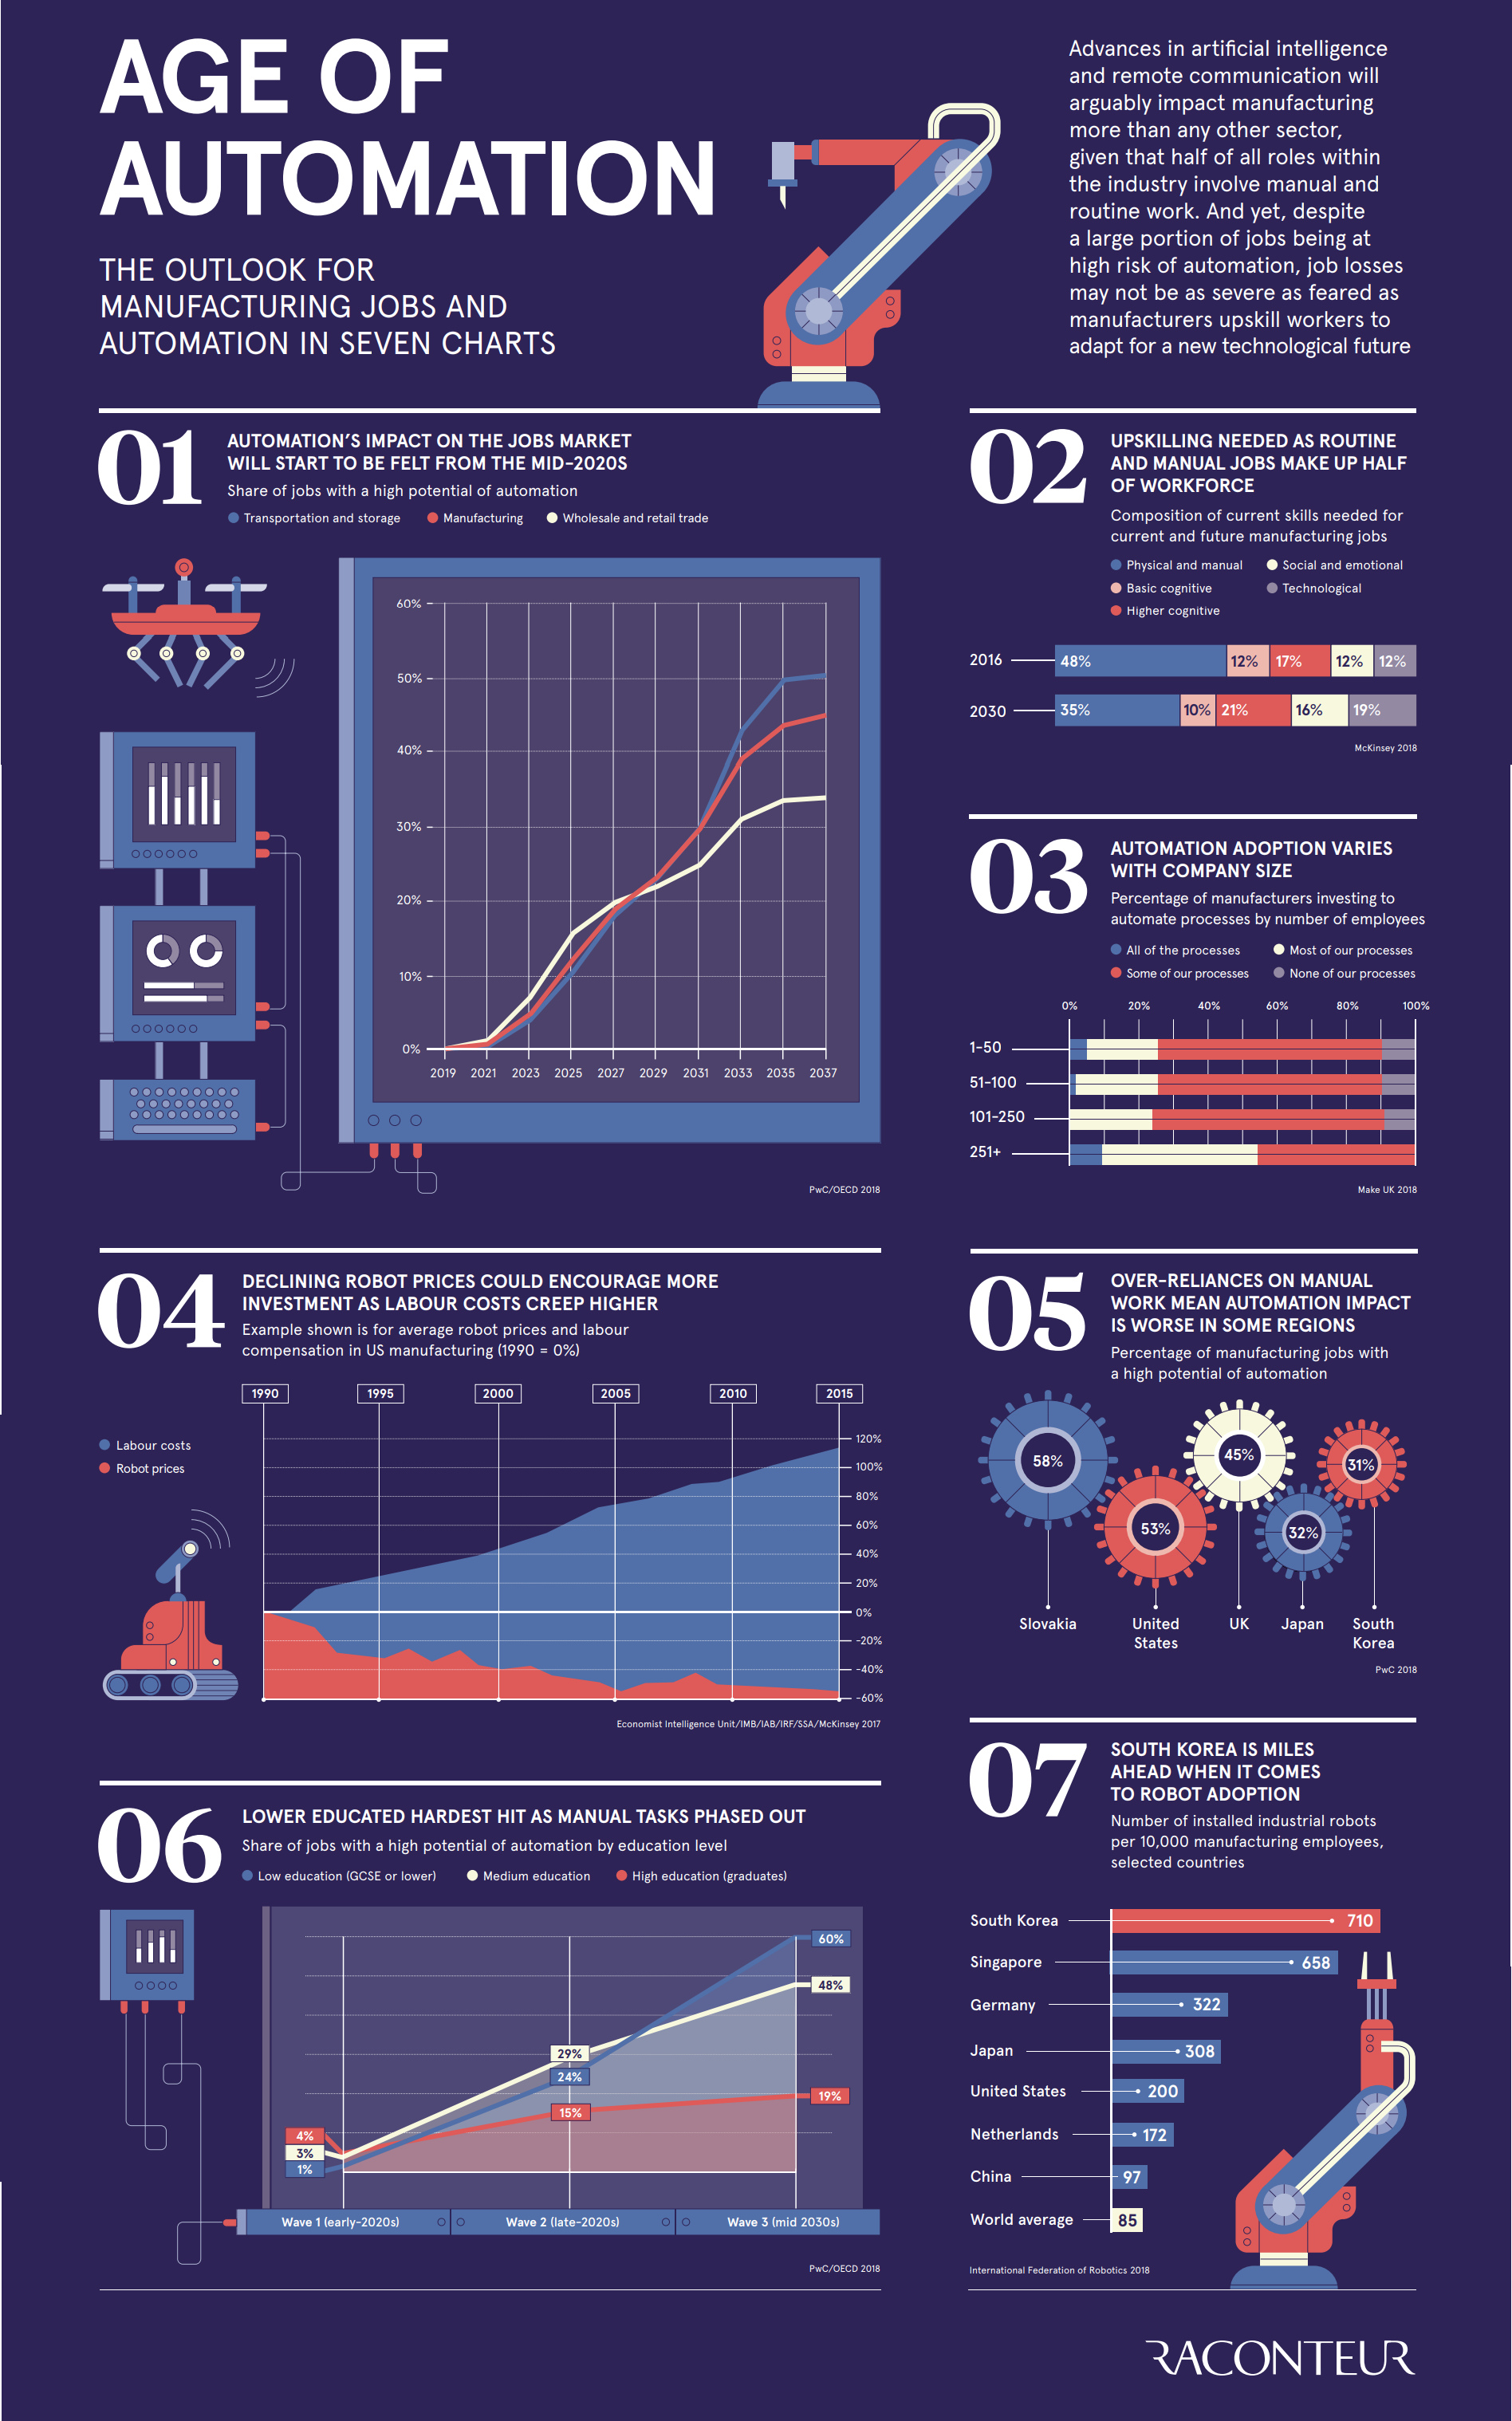
Today’s infographic comes to us from Raconteur, and it highlights seven different charts that show us how automation is shaping the world – and in particular, the future outlook for manufacturing jobs.
The Age of Automation
The precise details are up to debate, but here are a few key areas that many experts agree on with respect to the coming age of automation:
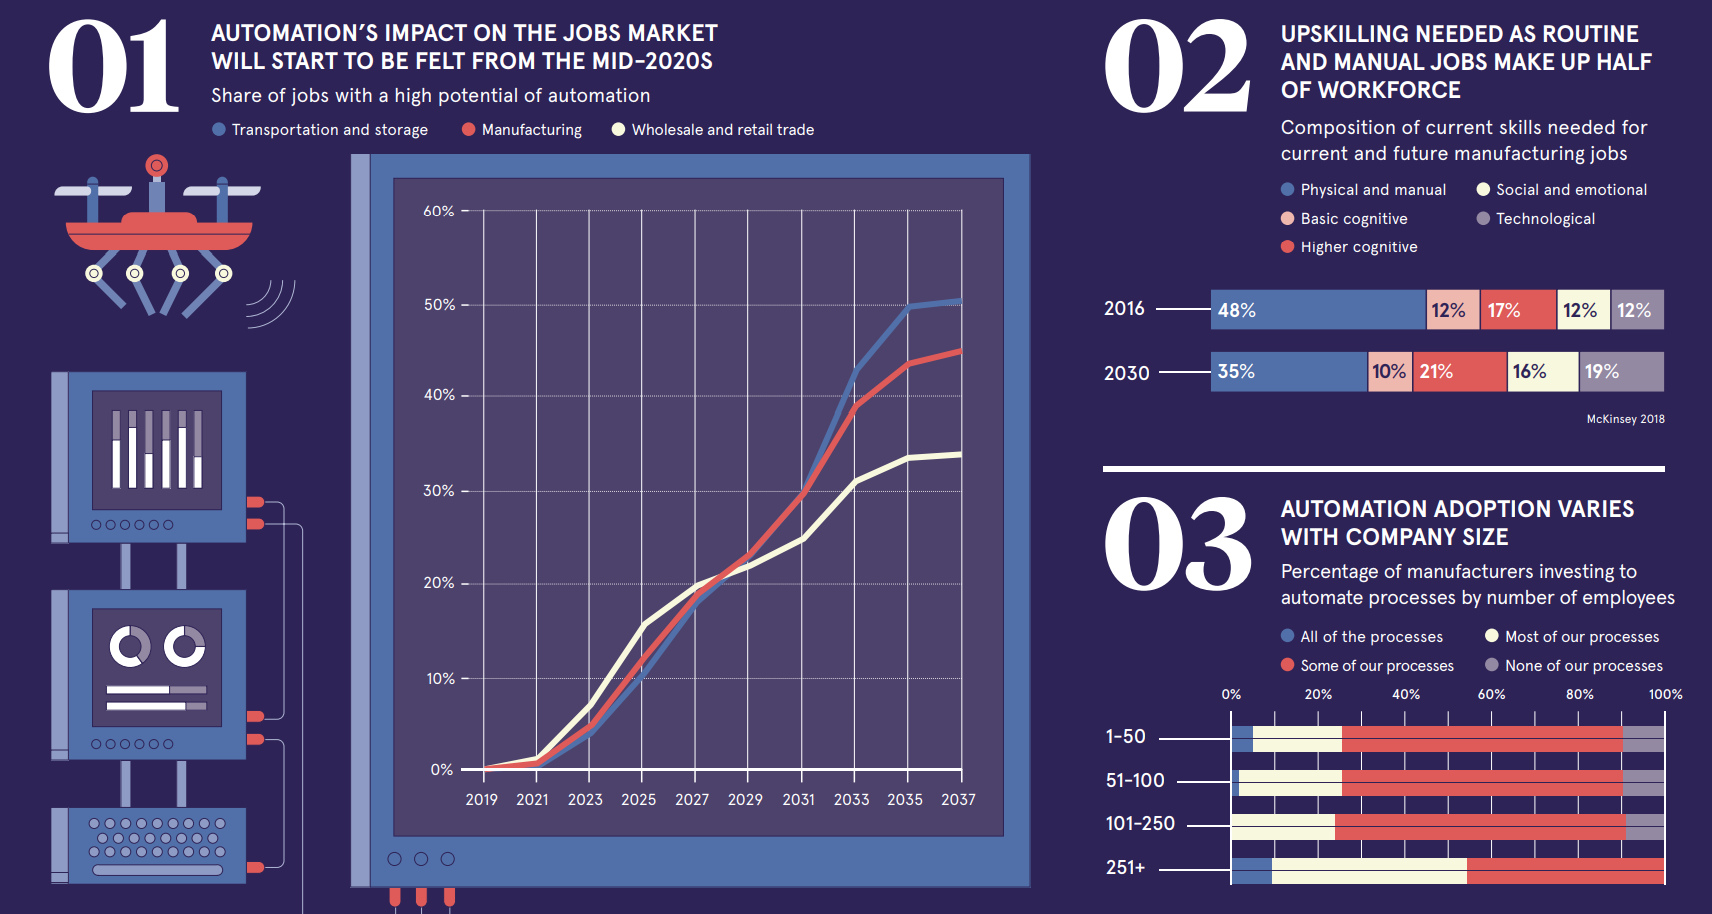
Half of manufacturing hours worked today are spent on manual jobs.
- In an analysis of North American and European manufacturing jobs, it was found that roughly 48% of hours primarily relied on the use of manual or physical labor.
- By the year 2030, it’s estimated that only 35% of time will be spent on such routine work.
Automation’s impact will be felt by the mid-2020s.
- According to a recent report from PwC, the impact on OECD jobs will start to be felt in the mid-2020s.
- By 2025, for example, it’s projected that 10-15% of jobs in three sectors (manufacturing, transportation and storage, and wholesales and retail trade) will have high potential for automation.
- By 2035, the range of jobs with high automation potential will be closer to 35-50% for those sectors.
Industrial robot prices are decreasing.
- Industrial robot sales are sky high, mainly the result of falling industry costs.
- This trend is expected to continue, with the cost of robots falling by 65% between 2015 and 2025.
- With the cost of labor generally rising, this makes it more difficult to keep low-skilled jobs.
Technology simultaneously creates jobs, but how many?
- One bright spot is that automation and AI will also create jobs, likely in functions that are difficult for us to conceive of today.
- Historically, technology has created more jobs than it has destroyed.
- AI alone is expected to have an economic impact of $15.7 trillion by 2030.
Unfortunately, although experts agree that jobs will be created by these technologies, they disagree considerably on how many. This important discrepancy is likely the biggest x-factor in determining the ultimate impact that these technologies will have in the coming years, especially on the workforce.


Technology
Ranked: Semiconductor Companies by Industry Revenue Share
Nvidia is coming for Intel’s crown. Samsung is losing ground. AI is transforming the space. We break down revenue for semiconductor companies.


Semiconductor Companies by Industry Revenue Share
This was originally posted on our Voronoi app. Download the app for free on Apple or Android and discover incredible data-driven charts from a variety of trusted sources.
Did you know that some computer chips are now retailing for the price of a new BMW?
As computers invade nearly every sphere of life, so too have the chips that power them, raising the revenues of the businesses dedicated to designing them.
But how did various chipmakers measure against each other last year?
We rank the biggest semiconductor companies by their percentage share of the industry’s revenues in 2023, using data from Omdia research.
Which Chip Company Made the Most Money in 2023?
Market leader and industry-defining veteran Intel still holds the crown for the most revenue in the sector, crossing $50 billion in 2023, or 10% of the broader industry’s topline.
All is not well at Intel, however, with the company’s stock price down over 20% year-to-date after it revealed billion-dollar losses in its foundry business.
| Rank | Company | 2023 Revenue | % of Industry Revenue |
|---|---|---|---|
| 1 | Intel | $51B | 9.4% |
| 2 | NVIDIA | $49B | 9.0% |
| 3 | Samsung Electronics | $44B | 8.1% |
| 4 | Qualcomm | $31B | 5.7% |
| 5 | Broadcom | $28B | 5.2% |
| 6 | SK Hynix | $24B | 4.4% |
| 7 | AMD | $22B | 4.1% |
| 8 | Apple | $19B | 3.4% |
| 9 | Infineon Tech | $17B | 3.2% |
| 10 | STMicroelectronics | $17B | 3.2% |
| 11 | Texas Instruments | $17B | 3.1% |
| 12 | Micron Technology | $16B | 2.9% |
| 13 | MediaTek | $14B | 2.6% |
| 14 | NXP | $13B | 2.4% |
| 15 | Analog Devices | $12B | 2.2% |
| 16 | Renesas Electronics Corporation | $11B | 1.9% |
| 17 | Sony Semiconductor Solutions Corporation | $10B | 1.9% |
| 18 | Microchip Technology | $8B | 1.5% |
| 19 | Onsemi | $8B | 1.4% |
| 20 | KIOXIA Corporation | $7B | 1.3% |
| N/A | Others | $126B | 23.2% |
| N/A | Total | $545B | 100% |
Note: Figures are rounded. Totals and percentages may not sum to 100.
Meanwhile, Nvidia is very close to overtaking Intel, after declaring $49 billion of topline revenue for 2023. This is more than double its 2022 revenue ($21 billion), increasing its share of industry revenues to 9%.
Nvidia’s meteoric rise has gotten a huge thumbs-up from investors. It became a trillion dollar stock last year, and broke the single-day gain record for market capitalization this year.
Other chipmakers haven’t been as successful. Out of the top 20 semiconductor companies by revenue, 12 did not match their 2022 revenues, including big names like Intel, Samsung, and AMD.
The Many Different Types of Chipmakers
All of these companies may belong to the same industry, but they don’t focus on the same niche.
According to Investopedia, there are four major types of chips, depending on their functionality: microprocessors, memory chips, standard chips, and complex systems on a chip.
Nvidia’s core business was once GPUs for computers (graphics processing units), but in recent years this has drastically shifted towards microprocessors for analytics and AI.
These specialized chips seem to be where the majority of growth is occurring within the sector. For example, companies that are largely in the memory segment—Samsung, SK Hynix, and Micron Technology—saw peak revenues in the mid-2010s.

-

 Misc2 weeks ago
Tesla Is Once Again the World’s Best-Selling EV Company
-

 AI1 week ago
The Stock Performance of U.S. Chipmakers So Far in 2024
-

 Misc1 week ago
Almost Every EV Stock is Down After Q1 2024
-

 Money2 weeks ago
Where Does One U.S. Tax Dollar Go?
-

 Green2 weeks ago
Ranked: Top Countries by Total Forest Loss Since 2001
-

 Real Estate2 weeks ago
Visualizing America’s Shortage of Affordable Homes
-

 Maps2 weeks ago
Mapped: Average Wages Across Europe
-

 Mining2 weeks ago
Charted: The Value Gap Between the Gold Price and Gold Miners