Politics
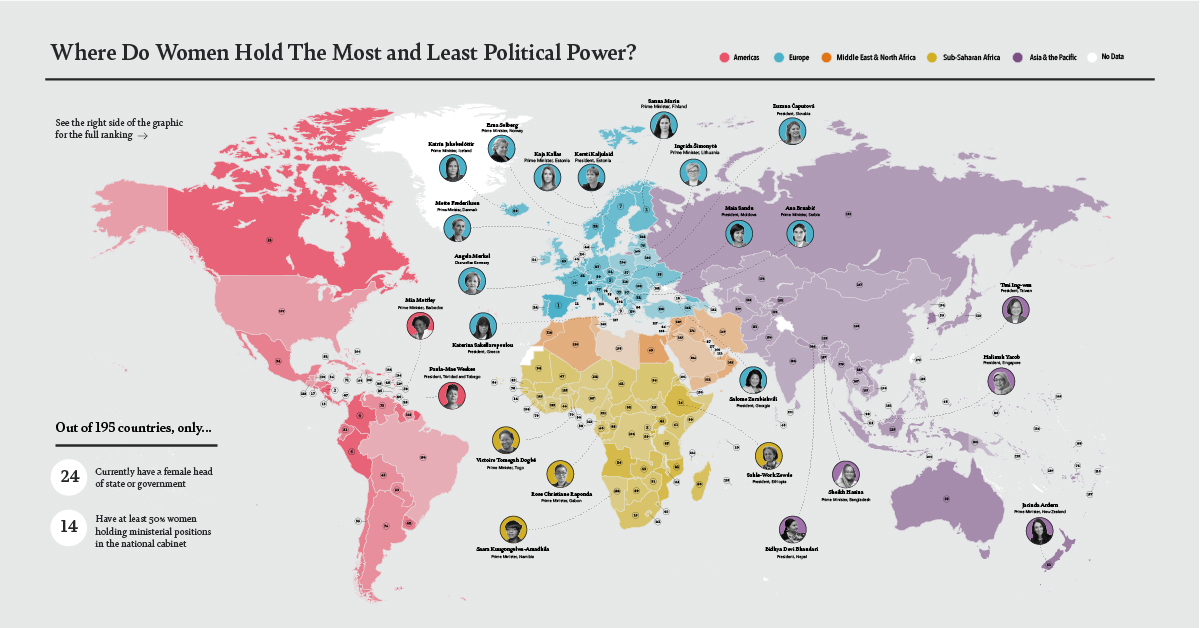
Mapped: Where Women Hold the Most and Least Political Power
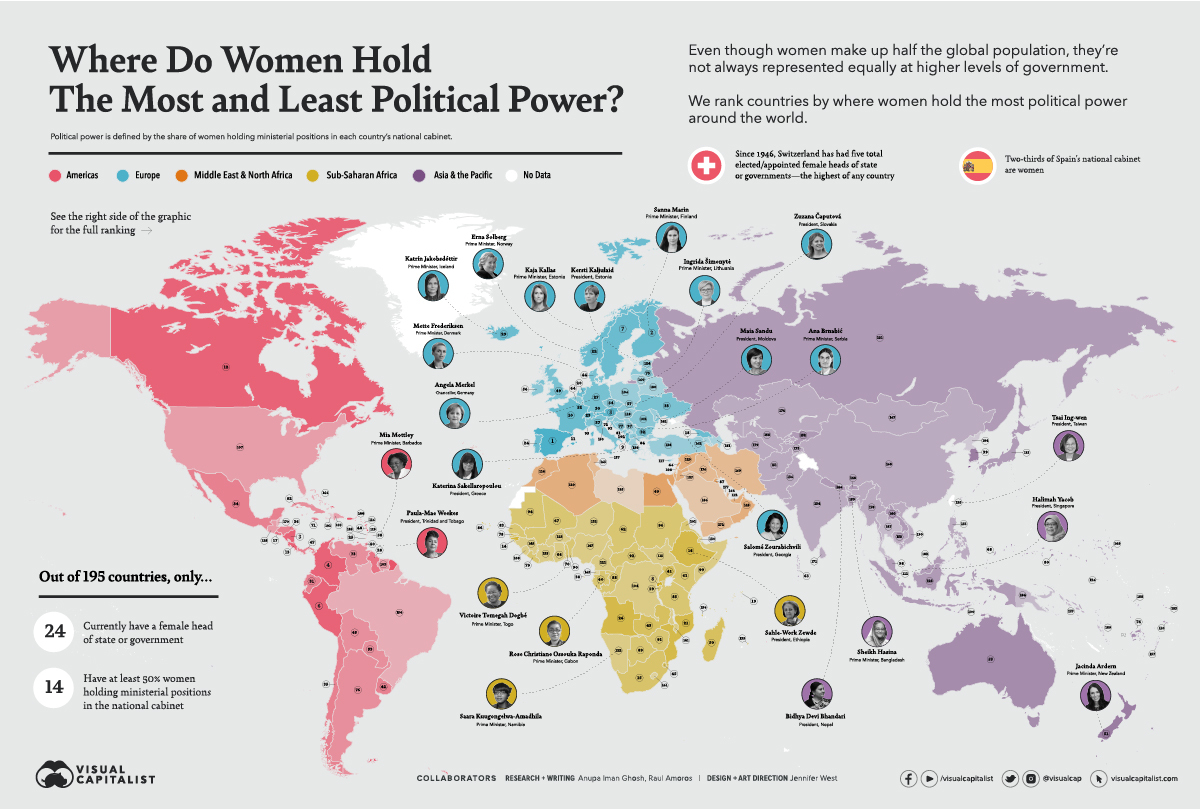


Where Women Hold the Most and Least Political Power
View the medium or highest resolution version of this map to explore all countries.
From the right to vote, to owning property and assets, women’s legal and economic rights have come a long way.
International Women’s Day, held annually on March 8th is an opportunity to commemorate global improvements around gender equality. One big driver for this is women’s political participation—however, progress in this area has not been distributed evenly worldwide.
Women’s Political Power: Share of Ministers in Cabinets
In this map, we dig into how much political power women hold around the world. The Council on Foreign Relations pulls the latest data from UN Women and the Inter-Parliamentary Union (IPU) to examine the shares of women holding ministerial positions in 195 national cabinets.
Here are the top five countries with the highest percentages of women’s political power:
- 🇪🇸 Spain: 66.7%
- 🇫🇮 Finland: 61.1%
- 🇳🇮 Nicaragua: 58.8%
- 🇨🇴 Colombia: 57.9%
- 🇦🇹 Austria: 57.1%
Even though women make up half the global population, they’re not always represented at higher levels of government. Only 14 countries have at least 50% women holding ministerial positions in the national cabinet.
| Country | Region | % Women in National Cabinet |
|---|---|---|
| Afghanistan | Asia-Pacific | 9.7 |
| Albania | Europe | 53.3 |
| Algeria | Middle East/North Africa | 15.2 |
| Andorra | Europe | 50.0 |
| Angola | Sub-Saharan Africa | 40.0 |
| Antigua and Barbuda | Americas | 15.4 |
| Argentina | Americas | 22.7 |
| Armenia | Europe | 7.1 |
| Australia | Asia-Pacific | 26.7 |
| Austria | Europe | 57.1 |
| Azerbaijan | Europe | 3.0 |
| Bahamas | Americas | 6.7 |
| Bahrain | Middle East/North Africa | 4.4 |
| Bangladesh | Asia-Pacific | 7.7 |
| Barbados | Americas | 26.1 |
| Belarus | Europe | 3.5 |
| Belgium | Europe | 25.0 |
| Belize | Americas | 6.3 |
| Benin | Sub-Saharan Africa | 20.8 |
| Bhutan | Asia-Pacific | 10.0 |
| Bolivia | Americas | 25.0 |
| Bosnia and Herzegovina | Europe | 22.2 |
| Botswana | Sub-Saharan Africa | 21.1 |
| Brazil | Americas | 9.1 |
| Brunei | Asia-Pacific | 0.0 |
| Bulgaria | Europe | 36.8 |
| Burkina Faso | Sub-Saharan Africa | 14.3 |
| Burundi | Sub-Saharan Africa | 26.1 |
| Cambodia | Asia-Pacific | 9.4 |
| Cameroon | Sub-Saharan Africa | 14.9 |
| Canada | Americas | 50.0 |
| Cape Verde | Sub-Saharan Africa | 21.4 |
| Central African Republic | Sub-Saharan Africa | 20.0 |
| Chad | Sub-Saharan Africa | 25.9 |
| Chile | Americas | 33.3 |
| China | Asia-Pacific | 6.5 |
| Colombia | Americas | 57.9 |
| Comoros | Sub-Saharan Africa | 8.3 |
| Costa Rica | Americas | 50.0 |
| Cote d'Ivoire | Sub-Saharan Africa | 12.8 |
| Croatia | Europe | 20.0 |
| Cuba | Americas | 21.9 |
| Cyprus | Europe | 15.4 |
| Czech Republic | Europe | 28.6 |
| Democratic Republic of Congo | Sub-Saharan Africa | 17.4 |
| Denmark | Europe | 31.6 |
| Djibouti | Sub-Saharan Africa | 13.0 |
| Dominica | Americas | 31.3 |
| Dominican Republic | Americas | 17.4 |
| East Timor | Asia-Pacific | 18.2 |
| Ecuador | Americas | 37.9 |
| Egypt | Middle East/North Africa | 24.2 |
| El Salvador | Americas | 47.1 |
| Equatorial Guinea | Sub-Saharan Africa | 7.1 |
| Eritrea | Sub-Saharan Africa | 17.7 |
| Estonia | Europe | 14.3 |
| Eswatini | Sub-Saharan Africa | 31.6 |
| Ethiopia | Sub-Saharan Africa | 47.6 |
| Fiji | Asia-Pacific | 23.1 |
| Finland | Europe | 61.1 |
| France | Europe | 52.9 |
| Gabon | Sub-Saharan Africa | 26.1 |
| Gambia | Sub-Saharan Africa | 22.2 |
| Georgia | Europe | 45.5 |
| Germany | Europe | 40.0 |
| Ghana | Sub-Saharan Africa | 25.0 |
| Greece | Europe | 11.1 |
| Grenada | Americas | 41.7 |
| Guatemala | Americas | 13.3 |
| Guinea | Sub-Saharan Africa | 10.8 |
| Guinea-Bissau | Sub-Saharan Africa | 50.0 |
| Guyana | Americas | 40.0 |
| Haiti | Americas | - |
| Honduras | Americas | 33.3 |
| Hungary | Europe | 15.4 |
| Iceland | Europe | 40.0 |
| India | Asia-Pacific | 12.5 |
| Indonesia | Asia-Pacific | 14.3 |
| Iran | Middle East/North Africa | 6.5 |
| Iraq | Middle East/North Africa | 4.6 |
| Ireland | Europe | 26.7 |
| Israel | Middle East/North Africa | 16.7 |
| Italy | Europe | 33.3 |
| Jamaica | Americas | 23.5 |
| Japan | Asia-Pacific | 15.8 |
| Jordan | Middle East/North Africa | 13.8 |
| Kazakhstan | Russia/Central Asia | 5.0 |
| Kenya | Sub-Saharan Africa | 26.1 |
| Kiribati | Asia-Pacific | 0.0 |
| Kosovo | Europe | - |
| Kuwait | Middle East/North Africa | 21.4 |
| Kyrgyzstan | Russia/Central Asia | 9.5 |
| Laos | Asia-Pacific | 11.1 |
| Latvia | Europe | 23.1 |
| Lebanon | Middle East/North Africa | 31.6 |
| Lesotho | Sub-Saharan Africa | 7.4 |
| Liberia | Sub-Saharan Africa | 22.2 |
| Libya | Middle East/North Africa | - |
| Liechtenstein | Europe | 40.0 |
| Lithuania | Europe | 7.7 |
| Luxembourg | Europe | 29.4 |
| Madagascar | Sub-Saharan Africa | 30.0 |
| Malawi | Sub-Saharan Africa | 11.1 |
| Malaysia | Asia-Pacific | 18.5 |
| Maldives | Asia-Pacific | 25.9 |
| Mali | Sub-Saharan Africa | 25.0 |
| Malta | Europe | 11.8 |
| Marshall Islands | Asia-Pacific | 10.0 |
| Mauritania | Sub-Saharan Africa | 20.0 |
| Mauritius | Sub-Saharan Africa | 12.5 |
| Mexico | Americas | 35.0 |
| Micronesia | Asia-Pacific | 22.2 |
| Moldova | Europe | 11.1 |
| Monaco | Europe | 20.0 |
| Mongolia | Asia-Pacific | 6.7 |
| Montenegro | Europe | 22.2 |
| Morocco | Middle East/North Africa | 15.8 |
| Mozambique | Sub-Saharan Africa | 42.9 |
| Myanmar | Asia-Pacific | 3.9 |
| Namibia | Sub-Saharan Africa | 14.8 |
| Nauru | Asia-Pacific | 14.3 |
| Nepal | Asia-Pacific | 10.5 |
| Netherlands | Europe | 44.4 |
| New Zealand | Asia-Pacific | 30.0 |
| Nicaragua | Americas | 58.8 |
| Niger | Sub-Saharan Africa | 12.8 |
| Nigeria | Sub-Saharan Africa | 10.3 |
| North Korea | Asia and the Pacific | - |
| North Macedonia | Europe | 21.7 |
| Norway | Europe | 42.9 |
| Oman | Middle East/North Africa | 11.1 |
| Pakistan | Asia-Pacific | 12.0 |
| Palau | Asia-Pacific | 25.0 |
| Panama | Americas | 31.6 |
| Papua New Guinea | Asia-Pacific | 0.0 |
| Paraguay | Americas | 29.4 |
| Peru | Americas | 55.0 |
| Philippines | Asia-Pacific | 8.6 |
| Poland | Europe | 17.4 |
| Portugal | Europe | 42.1 |
| Qatar | Middle East/North Africa | 7.1 |
| Republic of Congo | Sub-Saharan Africa | 21.2 |
| Romania | Europe | 17.7 |
| Russia | Russia/Central Asia | 12.9 |
| Rwanda | Sub-Saharan Africa | 53.6 |
| Saint Kitts and Nevis | Americas | 11.1 |
| Saint Lucia | Americas | 15.4 |
| Saint Vincent and the Grenadines | Americas | 0.0 |
| Samoa | Asia-Pacific | 16.7 |
| San Marino | Europe | 10.0 |
| Sao Tome and Principe | Sub-Saharan Africa | 33.3 |
| Saudi Arabia | Middle East/North Africa | 0.0 |
| Senegal | Sub-Saharan Africa | 21.9 |
| Serbia | Europe | 19.1 |
| Seychelles | Sub-Saharan Africa | 45.5 |
| Sierra Leone | Sub-Saharan Africa | 17.2 |
| Singapore | Asia-Pacific | 16.7 |
| Slovakia | Europe | 26.7 |
| Slovenia | Europe | 23.5 |
| Solomon Islands | Asia-Pacific | 5.0 |
| Somalia | Sub-Saharan Africa | 18.5 |
| South Africa | Sub-Saharan Africa | 48.3 |
| South Korea | Asia-Pacific | 33.3 |
| South Sudan | Sub-Saharan Africa | 15.6 |
| Spain | Europe | 66.7 |
| Sri Lanka | Asia-Pacific | 6.3 |
| Sudan | Sub-Saharan Africa | 20.0 |
| Suriname | Americas | 17.7 |
| Sweden | Europe | 54.6 |
| Switzerland | Europe | 42.9 |
| Syria | Middle East/North Africa | 13.3 |
| Taiwan | Asia-Pacific | - |
| Tajikistan | Russia/Central Asia | 5.9 |
| Tanzania | Sub-Saharan Africa | 21.7 |
| Thailand | Asia-Pacific | 0.0 |
| Togo | Sub-Saharan Africa | 24.0 |
| Tonga | Asia-Pacific | 8.3 |
| Trinidad and Tobago | Americas | 33.3 |
| Tunisia | Middle East/North Africa | 6.9 |
| Turkey | Europe | 11.8 |
| Turkmenistan | Russia/Central Asia | 3.7 |
| Tuvalu | Asia-Pacific | 0.0 |
| Uganda | Sub-Saharan Africa | 33.3 |
| Ukraine | Europe | 35.3 |
| United Arab Emirates | Middle East/North Africa | 16.7 |
| United Kingdom | Europe | 30.4 |
| United States | Americas | 17.4 |
| Uruguay | Americas | 33.3 |
| Uzbekistan | Russia/Central Asia | 8.0 |
| Vanuatu | Asia-Pacific | 0.0 |
| Venezuela | Americas | 23.5 |
| Vietnam | Asia-Pacific | 0.0 |
| Yemen | Middle East/North Africa | 6.3 |
| Zambia | Sub-Saharan Africa | 32.3 |
| Zimbabwe | Sub-Saharan Africa | 20.8 |
On the flip side, nine countries have 0% women in their national cabinet, such as Saudi Arabia and Thailand.
The silver lining to this is that Saudi Arabia is actually improving in some areas of women’s economic rights in recent years, such as granting more freedom of movement to travel and prohibiting employment discrimination on the basis on gender.
The Most Powerful Women: Female Heads of State/Government
From Indira Gandhi to Margaret Thatcher, many women have held notable and influential leadership positions in the past, serving as tours de force for the global economy.
Presently, there are only 24 countries with a female head of state or government. Moldova’s Maia Sandu is the latest to rise into a Presidential role as of December 2020. Here’s who the rest are, and their titles.
| Country | Name | Title |
|---|---|---|
| 🇧🇩 Bangladesh | Sheikh Hasina | Prime Minister |
| 🇧🇧 Barbados | Mia Mottley | Prime Minister |
| 🇩🇰 Denmark | Mette Frederiksen | Prime Minister |
| 🇪🇪 Estonia | Kersti Kaljulaid | President |
| 🇪🇪 Estonia | Kaja Kallas | Prime Minister |
| 🇪🇹 Ethiopia | Sahle-Work Zewde | President |
| 🇫🇮 Finland | Sanna Marin | Prime Minister |
| 🇬🇦 Gabon | Rose Christiane Ossouka Raponda | Prime Minister |
| 🇬🇪 Georgia | Salomé Zourabichvili | President |
| 🇩🇪 Germany | Angela Merkel | Chancellor |
| 🇬🇷 Greece | Katerina Sakellaropoulou | President |
| 🇮🇸 Iceland | Katrín Jakobsdóttir | Prime Minister |
| 🇱🇹 Lithuania | Ingrida Šimonytė | Prime Minister |
| 🇲🇩 Moldova | Maia Sandu | President |
| 🇳🇦 Namibia | Saara Kuugongelwa-Amadhila | Prime Minister |
| 🇳🇵 Nepal | Bidhya Devi Bhandari | President |
| 🇳🇿 New Zealand | Jacinda Ardern | Prime Minister |
| 🇳🇴 Norway | Erna Solberg | Prime Minister |
| 🇷🇸 Serbia | Ana Brnabić | Prime Minister |
| 🇸🇬 Singapore | Halimah Yacob | President |
| 🇸🇰 Slovakia | Zuzana Čaputová | President |
| 🇹🇬 Togo | Victoire Tomegah Dogbé | Prime Minister |
| 🇹🇹 Trinidad and Tobago | Paula-Mae Weekes | President |
| 🇹🇼 Taiwan | Tsai Ing-wen | President |
Last updated: Mar 2, 2021
As the chancellor of Germany, Angela Merkel holds the longest consecutive term of all female heads of state/government. With 15 years under her belt, Merkel is largely seen as a de facto leader of Europe. However, she intends to step down as chancellor after her term ends in September 2021.
Since 1946, Switzerland has had five total elected or appointed female heads of state or governments—the highest of any country. Simonette Sommaruga, the most recent female president of the nation, was only succeeded in the new year and dropped off this list.
Glass Ceiling in Politics?
While women have made strides in reaching their political potential worldwide, it’s interesting to note that they generally have a harder time ascending to office in larger countries compared to smaller economies.
For example, Estonia is the first country to have two female heads of state/government with both the president and prime minister positions being filled by women. On the flipside, many other countries have never had even one female head of state.
That said, shares of women holding seats in national legislatures are growing worldwide, which means that progress in these upper levels may be just around the corner.
“No country can ever truly flourish if it stifles the potential of its women and deprives itself of the contributions of half its citizens.”
—Michelle Obama


Economy
The Bloc Effect: International Trade with Geopolitical Allies on the Rise
Rising geopolitical tensions are shaping the future of international trade, but what is the effect on trading among G7 and BRICS countries?


The Bloc Effect: International Trade with Allies on the Rise
International trade has become increasingly fragmented over the last five years as countries have shifted to trading more with their geopolitical allies.
This graphic from The Hinrich Foundation, the first in a three-part series covering the future of trade, provides visual context to the growing divide in trade in G7 and pre-expansion BRICS countries, which are used as proxies for geopolitical blocs.
Trade Shifts in G7 and BRICS Countries
This analysis uses IMF data to examine differences in shares of exports within and between trading blocs from 2018 to 2023. For example, we looked at the percentage of China’s exports with other BRICS members as well as with G7 members to see how these proportions shifted in percentage points (pp) over time.
Countries traded nearly $270 billion more with allies in 2023 compared to 2018. This shift came at the expense of trade with rival blocs, which saw a decline of $314 billion.
Country Change in Exports Within Bloc (pp) Change in Exports With Other Bloc (pp)
🇮🇳 India 0.0 3.9
🇷🇺 Russia 0.7 -3.8
🇮🇹 Italy 0.8 -0.7
🇨🇦 Canada 0.9 -0.7
🇫🇷 France 1.0 -1.1
🇪🇺 EU 1.1 -1.5
🇩🇪 Germany 1.4 -2.1
🇿🇦 South Africa 1.5 1.5
🇺🇸 U.S. 1.6 -0.4
🇯🇵 Japan 2.0 -1.7
🇨🇳 China 2.1 -5.2
🇧🇷 Brazil 3.7 -3.3
🇬🇧 UK 10.2 0.5
All shifts reported are in percentage points. For example, the EU saw its share of exports to G7 countries rise from 74.3% in 2018 to 75.4% in 2023, which equates to a 1.1 percentage point increase.
The UK saw the largest uptick in trading with other countries within the G7 (+10.2 percentage points), namely the EU, as the post-Brexit trade slump to the region recovered.
Meanwhile, the U.S.-China trade dispute caused China’s share of exports to the G7 to fall by 5.2 percentage points from 2018 to 2023, the largest decline in our sample set. In fact, partly as a result of the conflict, the U.S. has by far the highest number of harmful tariffs in place.
The Russia-Ukraine War and ensuing sanctions by the West contributed to Russia’s share of exports to the G7 falling by 3.8 percentage points over the same timeframe.
India, South Africa, and the UK bucked the trend and continued to witness advances in exports with the opposing bloc.
Average Trade Shifts of G7 and BRICS Blocs
Though results varied significantly on a country-by-country basis, the broader trend towards favoring geopolitical allies in international trade is clear.
Bloc Change in Exports Within Bloc (pp) Change in Exports With Other Bloc (pp)
Average 2.1 -1.1
BRICS 1.6 -1.4
G7 incl. EU 2.4 -1.0
Overall, BRICS countries saw a larger shift away from exports with the other bloc, while for G7 countries the shift within their own bloc was more pronounced. This implies that though BRICS countries are trading less with the G7, they are relying more on trade partners outside their bloc to make up for the lost G7 share.
A Global Shift in International Trade and Geopolitical Proximity
The movement towards strengthening trade relations based on geopolitical proximity is a global trend.
The United Nations categorizes countries along a scale of geopolitical proximity based on UN voting records.
According to the organization’s analysis, international trade between geopolitically close countries rose from the first quarter of 2022 (when Russia first invaded Ukraine) to the third quarter of 2023 by over 6%. Conversely, trade with geopolitically distant countries declined.
The second piece in this series will explore China’s gradual move away from using the U.S. dollar in trade settlements.
Visit the Hinrich Foundation to learn more about the future of geopolitical trade

-

 Misc7 hours ago
Visualizing the Most Common Pets in the U.S.
Lions, tigers, and bears, oh my!—these animals do not feature on this list of popular American household pets.
-

 Economy3 days ago
Economic Growth Forecasts for G7 and BRICS Countries in 2024
The IMF has released its economic growth forecasts for 2024. How do the G7 and BRICS countries compare?
-

 United States2 weeks ago
Ranked: The Largest U.S. Corporations by Number of Employees
We visualized the top U.S. companies by employees, revealing the massive scale of retailers like Walmart, Target, and Home Depot.
-

 Economy2 weeks ago
Where U.S. Inflation Hit the Hardest in March 2024
We visualized product categories that saw the highest % increase in price due to U.S. inflation as of March 2024.
-

 Economy1 month ago
G20 Inflation Rates: Feb 2024 vs COVID Peak
We visualize inflation rates across G20 countries as of Feb 2024, in the context of their COVID-19 pandemic peak.
-

 Economy1 month ago
Mapped: Unemployment Claims by State
This visual heatmap of unemployment claims by state highlights New York, California, and Alaska leading the country by a wide margin.


-

 Science1 week ago
Visualizing the Average Lifespans of Mammals
-

 Markets2 weeks ago
The Top 10 States by Real GDP Growth in 2023
-

 Demographics2 weeks ago
The Smallest Gender Wage Gaps in OECD Countries
-
Economy2 weeks ago
Where U.S. Inflation Hit the Hardest in March 2024
-

 Green2 weeks ago
Top Countries By Forest Growth Since 2001
-
United States2 weeks ago
Ranked: The Largest U.S. Corporations by Number of Employees
-

 Maps2 weeks ago
The Largest Earthquakes in the New York Area (1970-2024)
-

 Green2 weeks ago
Ranked: The Countries With the Most Air Pollution in 2023