Sponsored
Recycling in America: How Can Investors Help Fix a Broken System?
The following content is sponsored by The Recycling Partnership.
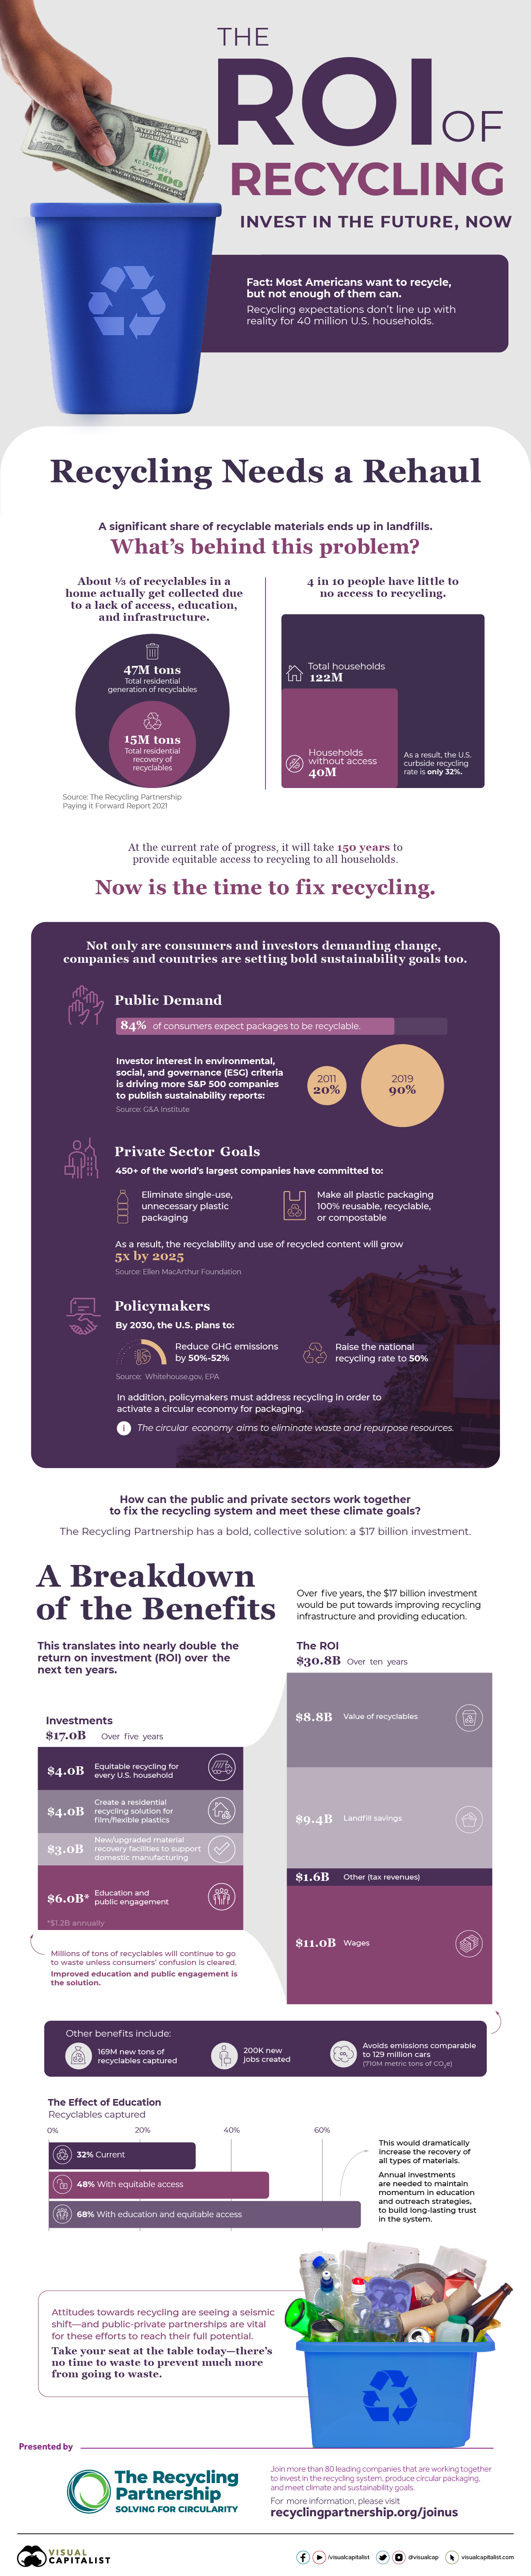
Recycling in America: Can Investors Help Fix a Broken System?
Reduce, reuse, recycle. Many are familiar with this mantra, but it’s not always easy to practice what we preach.
Even though most Americans want to recycle, not enough of them actually can. In fact, nearly 40 million households in the U.S. have little to no access to recycling.
This infographic from the Recycling Partnership highlights why this gap persists, and provides solutions to help bridge it. It also explains why bold investments in recycling now could have potential payoffs down the line.
The Reality of Recycling Issues in America
Of 47 million tons of total generated recyclables in a year, only one-third is actually recovered. This disparity is attributed to a combination of factors: lack of recycling access, education, and infrastructure.
As a result, the curbside recycling rate in the U.S. is only 32%. If progress continues at this glacial pace, the country will only achieve equitable access to recycling for all households in 150 years.
Recycling in America is broken—so why is now the opportune time to fix it?
Consumer Demands Are Fueling Global Targets
First and foremost, consumers are demanding change: 84% of consumers expect packages to be recyclable. The corporate sector is responding positively to these demands. Over 450 of the world’s largest companies have come together to sign a commitment to:
- Eliminate single-use, unnecessary plastic packaging
- Make all plastic packaging 100% reusable, recyclable, or compostable
This move will not only boost recyclability rates, but also raise recyclable content up 5x by the year 2025.
Because of these shifting winds, investors are wanting to incorporate more environmental, social, and governance (ESG) factors in their financial decisions. As a result, the number of S&P 500 companies publishing sustainability reports has leapt from just 20% in 2011 up to 90% in 2019.
Finally, at the highest level of action, America is also committing to bold climate-related goals, which are to:
Policymakers also stress the importance of a circular economy for packaging (which aims to eliminate waste and repurpose resources) which would mean rethinking America’s current recycling system.
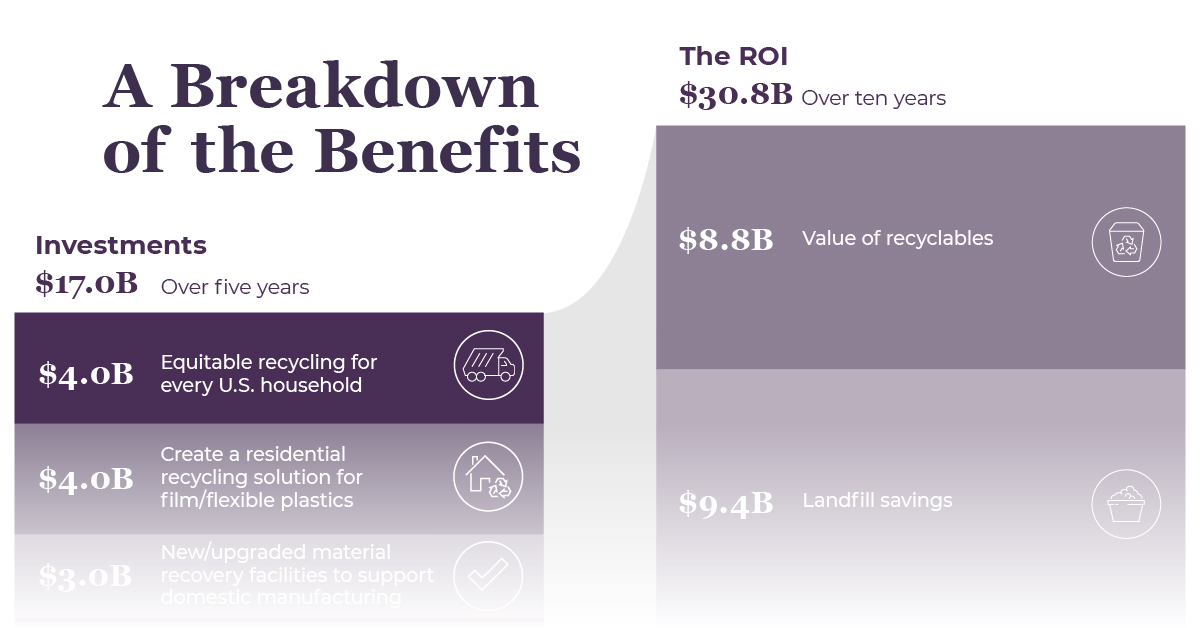
How can the public and private sectors work together on these goals? The Recycling Partnership has a collective solution: a $17 billion investment for a better future.
A Breakdown of the Benefits
Spread over five years, this $17 billion investment could improve recycling infrastructure, and bolster the need for recycling-related education in the process.
Here’s what goes into this calculation:
- $4 billion
Equitable recycling for every U.S. household - $4 billion
Create a residential recycling solution for film/flexible plastics - $3 billion
New/upgraded material recovery facilities to support domestic manufacturing - $6 billion
Education and public engagement (breaks down to just $1.2 billion annually)
The last factor is worth looking into a bit deeper, seeing as it makes up the biggest portion of the required investment for a reason.
Education’s Role in Helping Fix Recycling in America
Consumers express high levels of confusion over what they can and can’t recycle, leading to more recyclables ending up in landfills. For example, did you know that most plastic container lids can’t be recycled? By some estimates, barely ¼ of plastic waste is actually recycled, while the rest is incinerated or ends up in landfills.
Unless this confusion is cleared, millions of tons of recyclables will continue to go to waste. Improved education and public engagement is the solution.
This table highlights the significant knock-on effect that public education can have on recycling rates and the recovery of all types of materials:
Recyclables captured | |
---|---|
Current rate | 32% |
With equitable recycling access alone | 48% |
With both equitable recycling access and education | 68% |
That’s why consistent annual investments are needed to maintain momentum in education and outreach strategies, to build long-lasting trust in the recycling system.
How Recycling Investments Can Pay Dividends
In the long run, the potential return on investment (ROI) in recycling in America could be nearly double the amount of the initial amount put in. Over 10 years, $30.8 billion could be made back or saved, in the form of:
- $11 billion in wages
- $9.4 billion in landfill savings
- $8.8 billion from the value of recyclables
- $1.6 billion from other avenues (including tax revenues)
Other more intangible benefits include avoiding emissions comparable to 129 million cars, the creation of 200,000 jobs, and capturing 169 million new tons of recyclables.
It’s clear that consumer and corporate attitudes towards recycling are seeing a seismic shift. Public-private partnerships are thus vital for these efforts to reach their full potential.
The Recycling Partnership is bringing together various stakeholders at the same table, to rebuild the recycling system in America and achieve just that.
Support the Future of Data Storytelling
Sorry to interrupt your reading, but we have a favor to ask. At Visual Capitalist we believe in a world where data can be understood by everyone. That’s why we want to build the VC App - the first app of its kind combining verifiable and transparent data with beautiful, memorable visuals. All available for free.
As a small, independent media company we don’t have the expertise in-house or the funds to build an app like this. So we’re asking our community to help us raise funds on Kickstarter.
If you believe in data-driven storytelling, join the movement and back us on Kickstarter!
Thank you.

Sponsored
ESG Data: The Four Motivations Driving Usage
ESG controversies can damage a company’s value, but ESG data may be able to help manage this risk. What are other reasons for using ESG data?

ESG Data: The Four Motivations Driving Usage
Data is key to the environmental, social, and governance (ESG) revolution. Access to granular ESG data can help boost transparency for market participants. Unfortunately, 63% of U.S. and European asset managers say a lack of quantitative data inhibits their ESG implementation.
Being clear on the potential application of this data is equally important.
- Investors and banks can use ESG data for risk assessment, to spot opportunities, and to push companies for change.
- Companies can publish their own ESG data, quantify progress on their ESG goals, and use data to inform decisions.
- Policymakers can use ESG data to inform regulatory frameworks and measure policy effectiveness.
This graphic from ICE, the second in a three part series on the ESG toolkit, explores four primary motivations of ESG data users.
1. Right Thing
The objective: Having a positive social or environmental impact.
For investors, this can involve screening out companies that conflict with their values and selecting companies that align with their ESG objectives.
As another example, it can involve comparing the social impact of municipal bonds. One way investors can measure social impact is through scores that quantify the potential socioeconomic need of an area, using metrics like poverty and education levels. Here are the social impact scores for three actual municipal bonds issued in Florida.
State | Bond Issuer | Social Impact Score (Higher = larger potential impact) |
---|---|---|
Florida | Issuer #1 | 76.5 |
Florida | Issuer #2 | 66.6 |
Florida | Issuer #3 | 43.2 |
Issuer #1’s bond is projected to have a community impact that is nearly twice as high/positive as Issuer #3’s bond.
For companies, doing the right thing can include assessing their progress on ESG goals and benchmarking themselves to peers. For example, gender and racial representation is a growing area of focus.
2. Risk
The objective: Managing ESG risks, such as climate and reputational risks.
For investors, this can involve back-testing or analysis around specific risk events before they materialize. Here are the risk profiles of two actual municipal bonds in California. The shown bonds are practically identical in many ways, except their wildlife score.
Issuer #1 | Issuer #2 | |
---|---|---|
Current Coupon Rate | 5.0% | 5.0% |
Maturity Date | Aug 01, 2048 | August 01, 2048 |
S&P Rating | AA | AA |
Price to Date (Call Date) | Aug 01, 2027 | Aug 01, 2027 |
Price | 122.0 | 122.0 |
Yield | 1.0% | 1.0% |
Wildfire Score (Higher = more risk) | 3.6 | 2.7 |
Managing ESG risk can also involve analyzing a company’s policies and governance for weaknesses. This is important as an ESG controversy can have long-lasting effects on the valuation of a company.
In one study, companies with ESG controversies dropped more than 10% in value relative to the S&P 500. They hadn’t fully recovered a year after the incident.
3. Revenue
The objective: Targeting outperformance through ESG analysis.
Selecting companies with strong ESG data can align with long-term growth trends and may help boost performance. For heavy emitting industries, research indicates that European companies with lower emissions trade at much higher valuations. The chart below shows companies’ price-to-book ratio relative to the Stoxx 600* sector median.
Utilities | Energy | Materials | |
---|---|---|---|
Above Median Emission Intensity (Bad) | 1.9 | 1.1 | 2.0 |
Below Median Emissions Intensity (Good) | 2.7 | 1.9 | 2.1 |
*The Stoxx 600 Index represents large, mid and small capitalization companies across 17 countries of the European region: Austria, Belgium, Denmark, Finland, France, Germany, Ireland, Italy, Luxembourg, the Netherlands, Norway, Poland, Portugal, Spain, Sweden, Switzerland and the United Kingdom.
Energy companies with low emissions trade at a valuation nearly two times higher than energy companies with high emissions.
4. Regulation
The objective: Understanding and complying with relevant ESG regulation.
The International Sustainability Standards Board has announced a global reporting proposal aligned with the Task Force on Climate-related Financial Disclosures (TCFD). In addition, a growing number of jurisdictions will require organizational reporting that aligns with the TCFD.
- Brazil
- European Union
- Hong Kong
- Japan
- New Zealand
- Singapore
- Switzerland
- UK
Not only that, a European Union regulation known as Sustainable Finance Disclosure Regulation (SFDR) came into effect in 2021. It seeks greater transparency in disclosures from firms marketing investment products. Even firms located outside the EU could be impacted if they serve EU customers. In total, the market cap of these non-EU companies exposed to SFDR amounts to $3.2 trillion.
Matching ESG Data with Motivation
There will be growing demand for transparent data as ESG investing flourishes. To remain competitive, investors, policymakers, and companies need access to ESG data that meets their unique objectives.
In Part 3 of the ESG Toolkit series sponsored by ICE, we’ll look at key sustainability index types.
Sponsored
The Hierarchy of Zero Waste
In a world that generates 2 billion tonnes of waste every year, waste management has become a global concern. Here are some strategies to help guide zero waste policies.

The Hierarchy of Zero Waste
Many cities have set ambitious zero waste targets in the upcoming decades.
The idea is to have communities where waste generation is avoided, and products are shared, reused, or refurbished.
This graphic, sponsored by Northstar Clean Technologies, shows the main strategies and hierarchy to guide zero waste policies.
What is Zero Waste?
In a world that generates approximately 2 billion tons of waste every year, waste management has become a global concern. Thus, countries and cities are increasing efforts to reduce or even eliminate waste when possible.
The Zero Waste International Alliance defines zero waste as “the conservation of all resources by means of responsible production, consumption, reuse, and recovery of products, packaging, and materials without burning and with no discharges to land, water, or air that threaten the environment or human health.”
Becoming a zero waste community, however, is a complex task.
Currently, Sweden recycles 99% of locally-produced waste and is considered the best country in the world when it comes to recycling and reusing waste. However, such results only came after almost 40 years of recycling and reuse policies.
In line with this, here are seven commonly accepted steps you can use to achieve zero waste:
1. Rethink, Redesign Products
The global population consumes 110 billion tons of materials each year, but only 8.6% is reused or recycled. In a zero waste society, single-use products are avoided and products are designed with sustainable practices and materials.
2. Reduce
Consumption must be planned carefully to reduce the unnecessary use of materials. Consumers must choose products that maximize the usable lifespan and opportunities for continuous reuse. Companies must minimize the quantity and toxicity of materials used.
3. Reuse
The value of products is maintained by reusing, repairing, or refurbishing for alternative uses.
4. Recycle
Products are diverted from waste streams and recirculated into use. Resilient local markets are developed, allowing the highest and best use of materials.
5. Material Recovery
Component materials like cement, metals, or asphalt are recovered from mixed waste and collected for other applications.
In the U.S. alone, around 12 million tons of asphalt shingle tear-off waste and installation scrap are generated from roof installation each year. Currently, more than 90% of this is discarded in landfills. This material can be repurposed to create new products like liquid asphalt, fiber, and aggregate.
6. Residuals Management
Waste is biologically stabilized and sent to responsibly managed landfills.
7. Unacceptable
The production of materials that are not recoverable and can negatively impact the environment must be avoided.
Reducing our Climate Impact
Reducing, recycling, and recovering materials can be a key part of a climate change strategy to reduce our greenhouse gas emissions.
According to the U.S. Environmental Protection Agency, about 42% of all greenhouse gas emissions are caused by the production and use of goods, including food, products, and packaging.
Even though 100% zero waste may sound difficult to achieve in the near future, a zero waste approach is essential to reduce our impact on the environment.
Northstar Clean Technologies aims to become the leading recovery and reprocessing company for asphalt shingles in North America.
-
Money3 weeks ago
Mapping the Migration of the World’s Millionaires
-
Markets3 weeks ago
Visualizing the Coming Shift in Global Economic Power (2006-2036p)
-
Energy4 days ago
Who’s Still Buying Fossil Fuels From Russia?
-
Datastream4 weeks ago
Ranked: These Are 10 of the World’s Least Affordable Housing Markets
-
Demographics2 weeks ago
Mapped: A Decade of Population Growth and Decline in U.S. Counties
-
Misc4 weeks ago
Visualizing Well-Known Airlines by Fleet Composition
-
Misc2 weeks ago
Iconic Infographic Map Compares the World’s Mountains and Rivers
-
Markets1 week ago
Interest Rate Hikes vs. Inflation Rate, by Country