Misc
Mapped: Global Happiness Levels in 2021
Check out the latest map of countries by happiness levels in 2023.


Mapped: Global Happiness Levels in 2021
Check out the latest map of countries by happiness levels in 2023.
“Are you happy?” is a deceptively complex question to both ask and answer.
It’s generally understood that having enough money to cover your needs and wants can help you live a relatively happy, comfortable life—and recent research shows this relationship may increase linearly as income levels grow, as well.
However, there’s much more to it than that. Happiness levels depend not just on financial security, but also broader perceptions of one’s social support, personal freedom, and more.
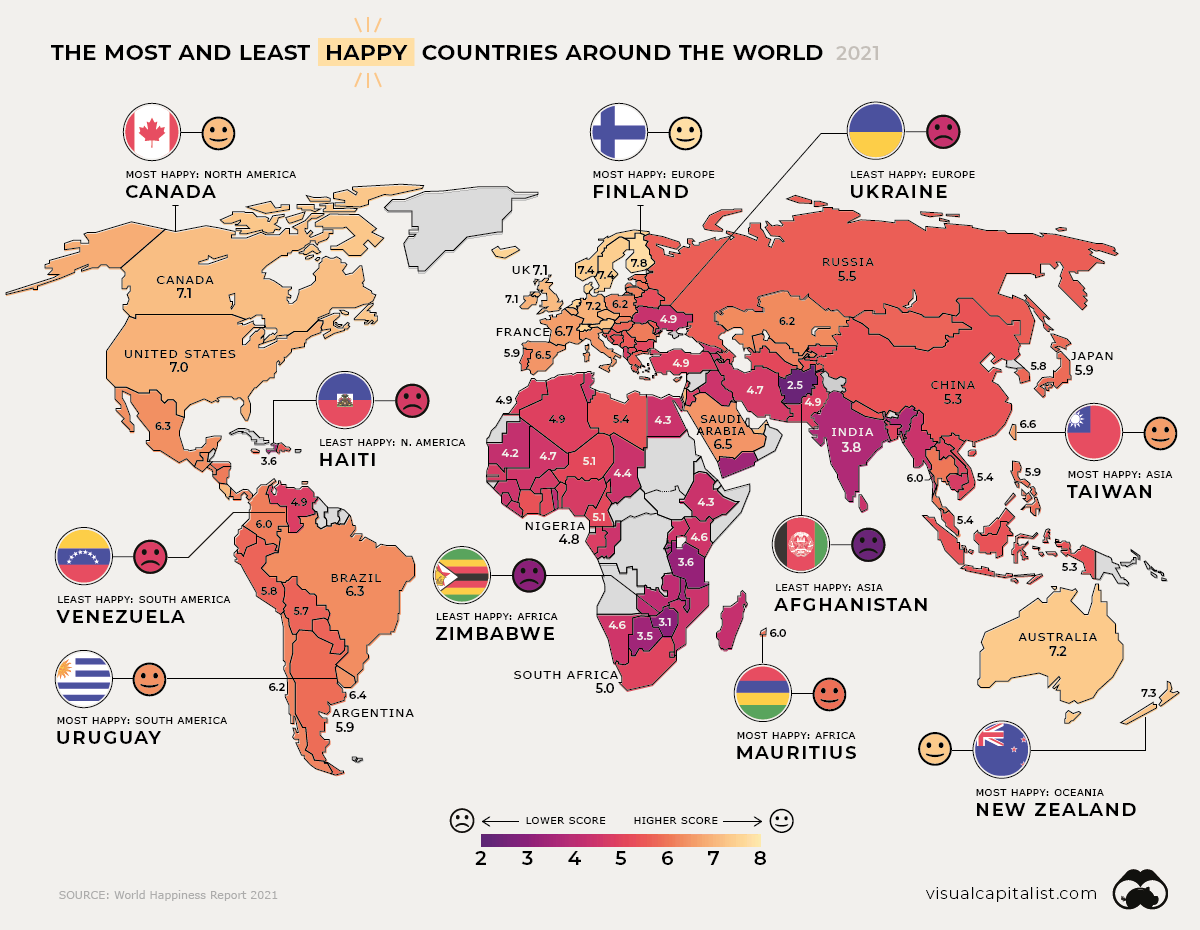
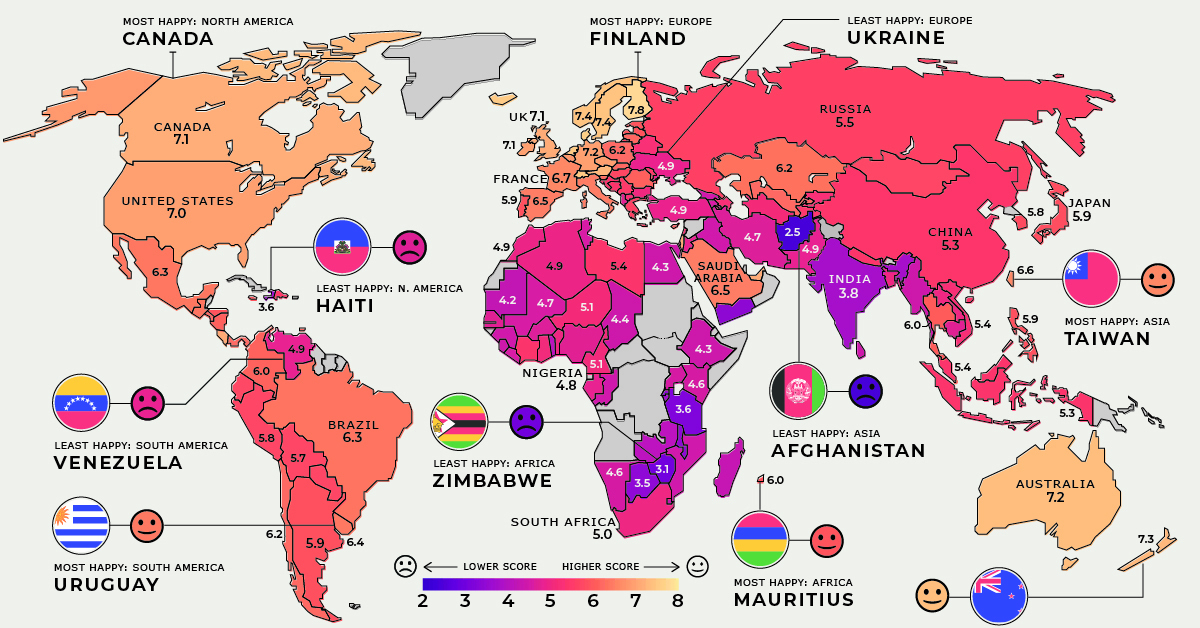
This series of map pulls data from the World Happiness Report to uncover the average scores of 149 countries between 2018-2020, and which ones emerged the happiest or unhappiest. We also look at the most and least improved countries in every region.
How is Happiness Measured?
First, let’s look at the factors used to calculate world happiness levels. Some clear indicators are health and wealth, both metrics that have been steadily on the rise worldwide. The report takes these into account, weighting GDP per capita and life expectancy at birth into the scores.
The report also looks at more intangible aspects, collecting survey responses around:
- Social support
- Freedom to make life choices
- Generosity
- Perceptions of government/ business corruption
- Positive or negative affects (Recent experience of emotions)
This year, there was a natural focus on the negative affect measure of the COVID-19 pandemic on happiness levels, such as exacerbating mental health risks. In addition, such measurements varied depending on each country’s response to the crisis.
Looking Closely at Regional Happiness Levels
Worldwide happiness comes in at an average score of 5.5, a marginal improvement since our previous coverage of this report in 2019. Let’s dive into regional outlooks for happiness levels.
North America
Current Mood: Happy (6.1)
Canada retains its spot as the happiest country in North America, although its overall global ranking has dropped over the years. In 2019, it was ranked in ninth place globally, dropping to 11th in the 2020 edition, and declining further to 14th place in this year’s report.
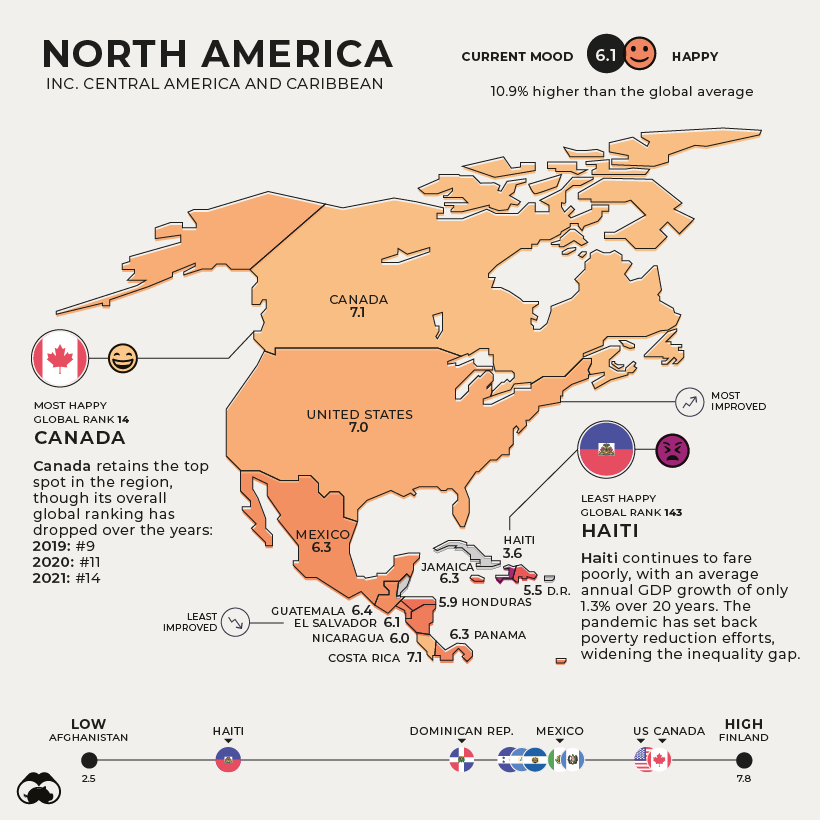
Haiti continues to fare poorly as the unhappiest in the region, with an average annual GDP growth of only 1.3% over 20 years. Its weak economy and political instability have been worsened by the pandemic—setting back efforts to reduce poverty and widening inequality.
South America
Current Mood: Content (5.9)
With the largest middle class in the Americas—60% of its population—and a miniscule 0.1% extreme poverty rate, Uruguay is the happiest South American country. The nation has also achieved equitable access to basic services, from education to electricity.
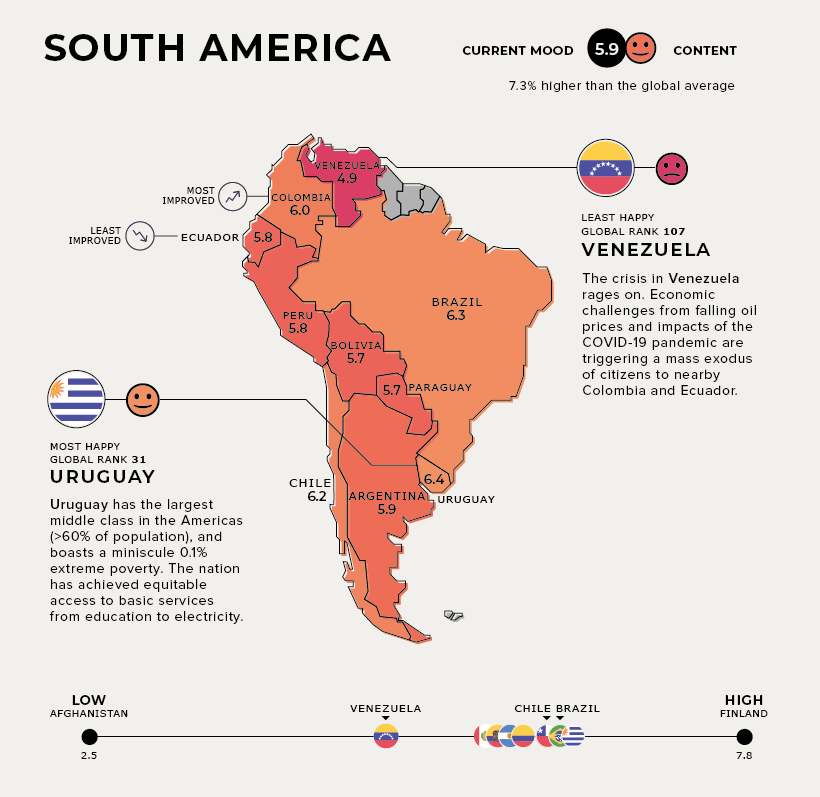
The trio of Colombia, Ecuador, and Venezuela are experiencing different stages of progress in happiness levels, but their relationship is very much interdependent.
Venezuela and Ecuador face similar economic challenges and sharp declines in oil prices. Venezuela is additionally acutely affected by socio-political unrest, triggering a mass exodus of citizens to Ecuador and Colombia alike. The silver lining is that the influx of highly-educated Venezuelan migrants may provide a 2% boost to Ecuador’s GDP.
Colombia, the most improved country, has halved its poverty rate in the last decade. In addition, it has welcomed almost 2 million Venezuelan migrants as of Dec 2020—and plans to provide them up to 10 years of protective status.
Europe
Current Mood: Happy (6.4)
Finland remains at the top of the leaderboard as the world’s happiest country. This year’s ranking was also influenced by high levels of trust in the way the COVID-19 pandemic was handled.
Meanwhile, the shock of the COVID-19 crisis is expected to be short-lived in Croatia, which is the most improved country. This is partly due to its steady pre-pandemic economic gains, although risks remain.
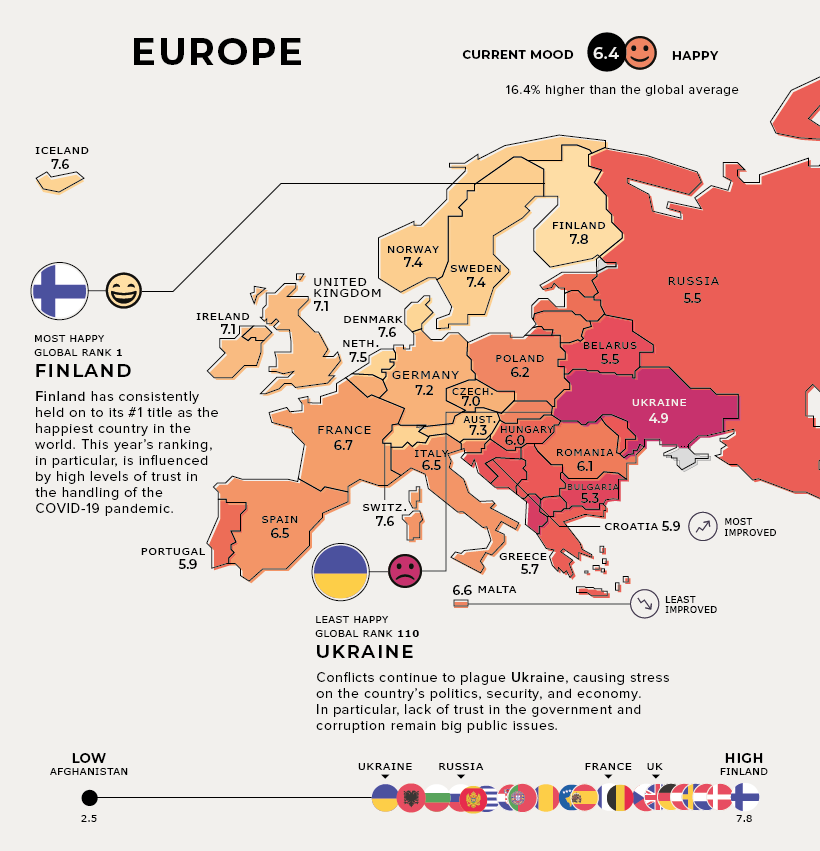
In the unhappiest country of Ukraine, conflicts continue to cause stress on its politics, security, and economy. In particular, government corruption remains a big public issue.
Middle East and Central Asia
Current Mood: It’s Complicated (5.3)
Saudi Arabia is the most improved country in the region, as it continues to reduce its oil dependence, diversify its economy, and bolster its public services. It has also been making some progress towards gender equality.
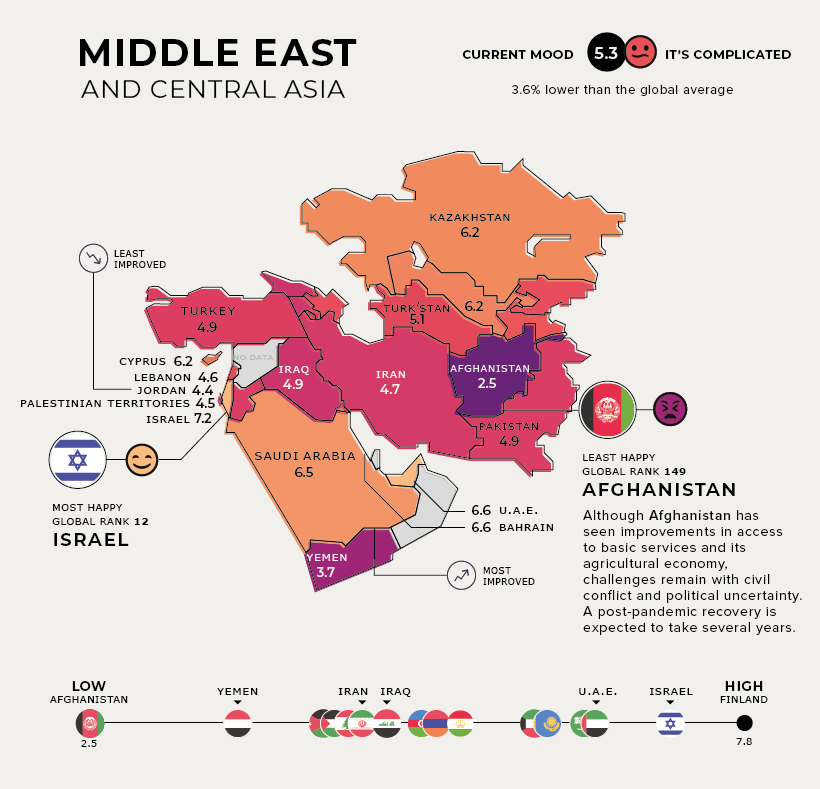
The tourism and hospitality industries contribute nearly 20% of Jordan’s GDP—and COVID-19 has caused a prolonged economic decline in the country along with the headwinds of these industries.
Although Afghanistan has seen improvements in access to basic services and its agricultural economy, challenges remain with prolonged conflict and violence. A post-pandemic recovery in the world’s unhappiest country might take several years.
East Asia and Oceania
Current Mood: Neutral (5.5)
Both New Zealand and Taiwan saw a successful COVID-19 response and recovery boosting their positions in the global happiness rankings. In fact, New Zealand was the only non-European country to make it into the top 10 on the global happiness list.
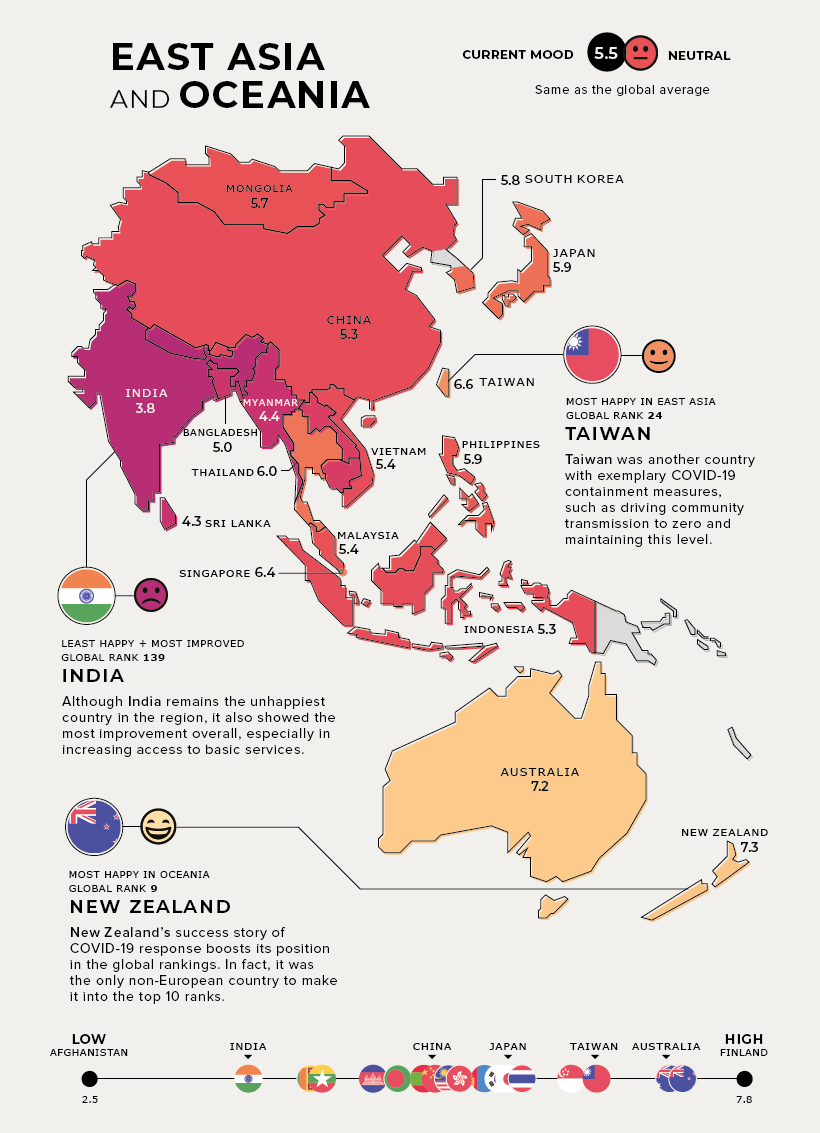
Note: As the report only covers 149 countries, “Oceania” only refers to Australia and New Zealand in this instance.
Although India remains the unhappiest country in the region, it also showed the most improvement overall, possibly due to its increased access to basic services. Notably though, the pandemic caused a sharp economic contraction in real GDP by 23.9% year-over-year in Q1’2021.
Africa
Current Mood: Unhappy (4.5)
In July 2020, the island nation of Mauritius joined Seychelles to become the second high-income country in Africa, helping cement its status as the happiest in the region.
Zambia, the most improved African country, has one of the world’s youngest populations by median age—which presents long-term opportunities for labor force participation.
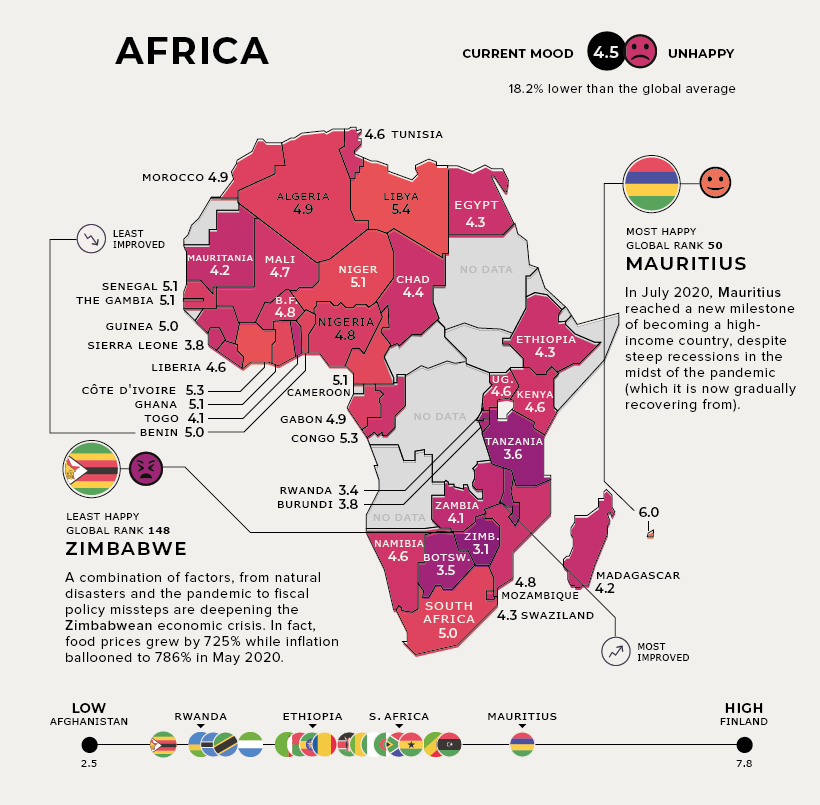
On the flip side, agriculturally-reliant Benin struggles with high poverty, with close to 40% of the population living below $1.90 per day.
Zimbabwe, the unhappiest country, has been through not just natural disasters but financial disasters too. It experienced hyperinflation of 786% in May 2020, accompanied by an equally sharp rise in food prices.
Although each country has been uniquely impacted by the pandemic, it’s clear that on the whole, happiness levels take into account so much more. How will future rankings look like in a post-pandemic world?


Misc
How Hard Is It to Get Into an Ivy League School?
We detail the admission rates and average annual cost for Ivy League schools, as well as the median SAT scores required to be accepted.


How Hard Is It to Get Into an Ivy League School?
This was originally posted on our Voronoi app. Download the app for free on iOS or Android and discover incredible data-driven charts from a variety of trusted sources.
Ivy League institutions are renowned worldwide for their academic excellence and long-standing traditions. But how hard is it to get into one of the top universities in the U.S.?
In this graphic, we detail the admission rates and average annual cost for Ivy League schools, as well as the median SAT scores required to be accepted. The data comes from the National Center for Education Statistics and was compiled by 24/7 Wall St.
Note that “average annual cost” represents the net price a student pays after subtracting the average value of grants and/or scholarships received.
Harvard is the Most Selective
The SAT is a standardized test commonly used for college admissions in the United States. It’s taken by high school juniors and seniors to assess their readiness for college-level academic work.
When comparing SAT scores, Harvard and Dartmouth are among the most challenging universities to gain admission to. The median SAT scores for their students are 760 for reading and writing and 790 for math. Still, Harvard has half the admission rate (3.2%) compared to Dartmouth (6.4%).
| School | Admission rate (%) | SAT Score: Reading & Writing | SAT Score: Math | Avg Annual Cost* |
|---|---|---|---|---|
| Harvard University | 3.2 | 760 | 790 | $13,259 |
| Columbia University | 3.9 | 750 | 780 | $12,836 |
| Yale University | 4.6 | 760 | 780 | $16,341 |
| Brown University | 5.1 | 760 | 780 | $26,308 |
| Princeton University | 5.7 | 760 | 780 | $11,080 |
| Dartmouth College | 6.4 | 760 | 790 | $33,023 |
| University of Pennsylvania | 6.5 | 750 | 790 | $14,851 |
| Cornell University | 7.5 | 750 | 780 | $29,011 |
*Costs after receiving federal financial aid.
Additionally, Dartmouth has the highest average annual cost at $33,000. Princeton has the lowest at $11,100.
While student debt has surged in the United States in recent years, hitting $1.73 trillion in 2023, the worth of obtaining a degree from any of the schools listed surpasses mere academics. This is evidenced by the substantial incomes earned by former students.
Harvard grads, for example, have the highest average starting salary in the country, at $91,700.

-

 Real Estate2 weeks ago
Visualizing America’s Shortage of Affordable Homes
-

 Technology1 week ago
Ranked: Semiconductor Companies by Industry Revenue Share
-

 Money1 week ago
Which States Have the Highest Minimum Wage in America?
-

 Real Estate1 week ago
Ranked: The Most Valuable Housing Markets in America
-

 Business2 weeks ago
Charted: Big Four Market Share by S&P 500 Audits
-

 AI2 weeks ago
The Stock Performance of U.S. Chipmakers So Far in 2024
-

 Misc2 weeks ago
Almost Every EV Stock is Down After Q1 2024
-

 Money2 weeks ago
Where Does One U.S. Tax Dollar Go?