Datastream
Chart: The 20 Top Stocks of 2020 by Price Return
The Briefing
- In 2020, a handful of companies thrived in the face of the pandemic
- Medical stocks made up nine of the top 20 stocks, followed by seven in the Tech/Online category
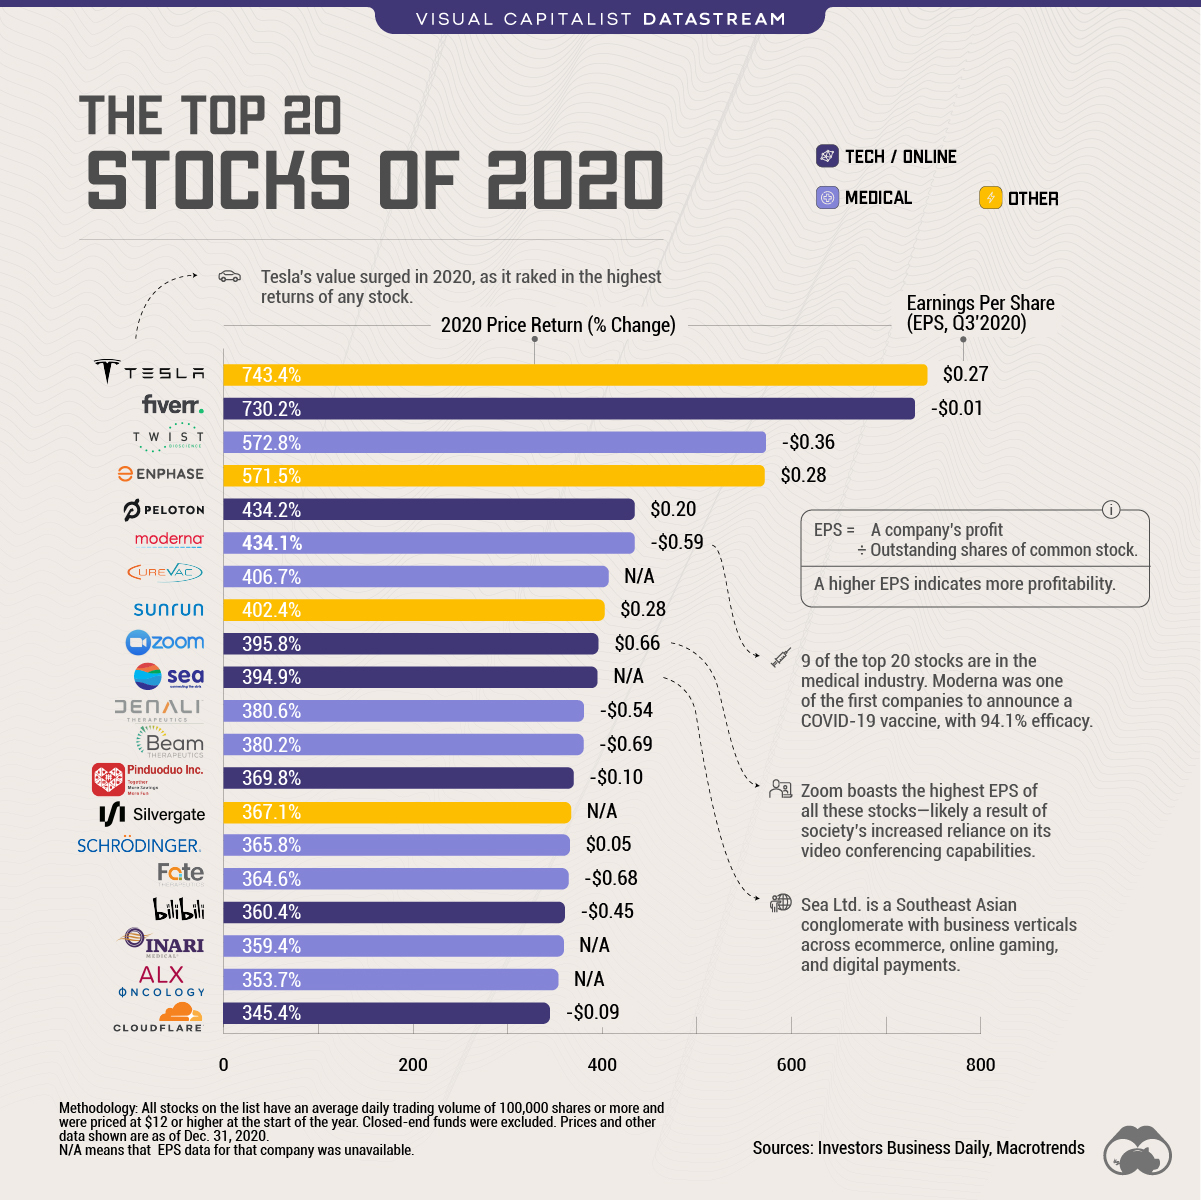
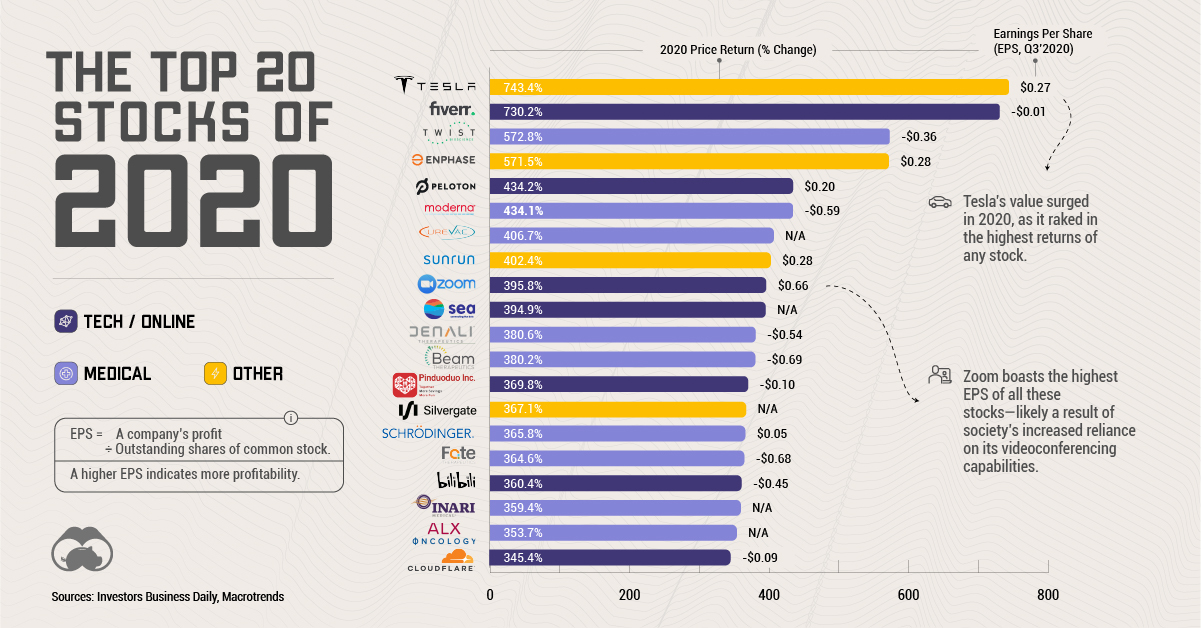
Chart: The 20 Top Stocks of 2020, by Price Return and EPS
In the whirlwind of the pandemic, most businesses experienced chaos. From shuttered physical stores to the rapid rise of online activity, only a select few companies successfully weathered the storm.
We look at the 20 top stocks of 2020 by price return (% change), and earnings per share (EPS), which is an indicator of a company’s profitability.
EPS is calculated by dividing a company’s profit by its outstanding shares of common stock. The higher an EPS value, the more profitable a company is deemed.
A Closer Look at the Leaderboard
Tesla’s value surged in 2020, as it raked in 743.4% in returns—the highest of any stock. In fact, it’s the only automaker to enter this list.
| Rank | Company | Industry | % Change | EPS, Q3’2020 |
|---|---|---|---|---|
| #1 | Tesla Inc | Other (Auto Manufacturer) | 743.4% | $0.27 |
| #2 | Fiverr International Ltd | Tech/Online (Retail) | 730.2% | -$0.01 |
| #3 | Twist Bioscience Corp | Medical (Biotech) | 572.8% | -$0.36 |
| #4 | Enphase Energy Inc | Other (Solar Energy | 571.5% | $0.28 |
| #5 | Peloton Interactive Cl A | Tech/Online (Leisure) | 434.2% | $0.20 |
| #6 | Moderna Inc | Medical (Biotech) | 434.1% | -$0.59 |
| #7 | Curevac N V | Medical (Biotech) | 406.7% | N/A |
| #8 | Sunrun Inc | Other (Solar Energy) | 402.4% | $0.28 |
| #9 | Zoom Video Comm Cl A | Tech/Online (Software) | 395.8% | $0.66 |
| #10 | Sea Limited Ads Cl A | Tech/Online (Retail, Leisure) | 394.9% | N/A |
| #11 | Denali Therapeutics Inc | Medical (Biotech) | 380.6% | -$0.54 |
| #12 | Beam Therapeutics Inc | Medical (Biotech) | 380.2% | -$0.69 |
| #13 | Pinduoduo Inc Cl A Ads | Tech/Online (Retail) | 369.8% | -$0.10 |
| #14 | Silvergate Cap Corp Cl A | Other (Finance/Banks) | 367.1% | N/A |
| #15 | Schrodinger Inc | Medical (Service) | 365.8% | $0.05 |
| #16 | Fate Therapeutics Inc | Medical (Biotech) | 364.6% | -$0.68 |
| #17 | Bilibili Inc Cl Z Ads | Tech/Online (Leisure) | 360.4% | -$0.45 |
| #18 | Inari Medical Inc | Medical (Service) | 359.4% | N/A |
| #19 | Alx Oncology Holding Inc | Medical (Biotech) | 353.7% | N/A |
| #20 | Cloudflare Inc Cl A | Tech/Online (Software) | 345.4% | -$0.09 |
Zoom comes out on top with $0.66 in earnings per share. This is likely a result of society’s increased reliance on its videoconferencing capabilities, a trend that became clear quite early on last year.
Notable Stocks by Category
If we look at the overall categories, the medical industry pulled in nine of the top 20 stocks in 2020. As the world scrambled to develop an immunization against COVID-19, Moderna was one of the first companies to get there, announcing a vaccine with 94.1% efficacy. As a result, the company showed an impressive 434% in returns.
The Tech/Online category came in second, although slightly more diversification is found here, ranging from software to retail and leisure:
- In the growing global gig economy, Fiverr’s platform connects freelancers with those in need of their services.
- Peloton is tapping into the lucrative home fitness market, particularly with people now spending more time at home.
- Sea Ltd. is a Southeast Asian conglomerate with business verticals across ecommerce, online gaming, and digital payments.
One final interesting observation is that of the stocks in the Other category, two of them deal in the business of solar energy, exhibiting high returns and similar EPS values, likely from a global shift towards cleaner energy sources.
Where does this data come from?
Source: 2020 Price Return (% Change) values are from Investors Business Daily
EPS values come from Macrotrends, the latest data reported by all companies is from Q3’2020.
Methodology: All stocks on the list have an average daily trading volume of 100,000 shares or more and were priced at $12 or higher at the start of the year. Closed-end funds were excluded. Prices and other data shown are as of Dec. 31, 2020. N/A means that EPS data for that company was unavailable.


Datastream
Can You Calculate Your Daily Carbon Footprint?
Discover how the average person’s carbon footprint impacts the environment and learn how carbon credits can offset your carbon footprint.


The Briefing
- A person’s carbon footprint is substantial, with activities such as food consumption creating as much as 4,500 g of CO₂ emissions daily.
- By purchasing carbon credits from Carbon Streaming Corporation, you can offset your own emissions and fund positive climate action.
Your Everyday Carbon Footprint
While many large businesses and countries have committed to net-zero goals, it is essential to acknowledge that your everyday activities also contribute to global emissions.
In this graphic, sponsored by Carbon Streaming Corporation, we will explore how the choices we make and the products we use have a profound impact on our carbon footprint.
Carbon Emissions by Activity
Here are some of the daily activities and products of the average person and their carbon footprint, according to Clever Carbon.
| Household Activities & Products | CO2 Emissions (g) |
|---|---|
| 💡 Standard Light Bulb (100 watts, four hours) | 172 g |
| 📱 Mobile Phone Use (195 minutes per day)* | 189 g |
| 👕 Washing Machine (0.63 kWh) | 275 g |
| 🔥 Electric Oven (1.56 kWh) | 675 g |
| ♨️ Tumble Dryer (2.5 kWh) | 1,000 g |
| 🧻 Toilet Roll (2 ply) | 1,300 g |
| 🚿 Hot Shower (10 mins) | 2,000 g |
| 🚙 Daily Commute (one hour, by car) | 3,360 g |
| 🍽️ Average Daily Food Consumption (three meals of 600 calories) | 4,500 g |
| *Phone use based on yearly use of 69kg per the source, Reboxed | |
Your choice of transportation plays a crucial role in determining your carbon footprint. For instance, a 15 km daily commute to work on public transport generates an average of 1,464 g of CO₂ emissions. Compared to 3,360 g—twice the volume for a journey the same length by car.
By opting for more sustainable modes of transport, such as cycling, walking, or public transportation, you can significantly reduce your carbon footprint.
Addressing Your Carbon Footprint
One way to compensate for your emissions is by purchasing high-quality carbon credits.
Carbon credits are used to help fund projects that avoid, reduce or remove CO₂ emissions. This includes nature-based solutions such as reforestation and improved forest management, or technology-based solutions such as the production of biochar and carbon capture and storage (CCS).
While carbon credits offer a potential solution for individuals to help reduce global emissions, public awareness remains a significant challenge. A BCG-Patch survey revealed that only 34% of U.S. consumers are familiar with carbon credits, and only 3% have purchased them in the past.
About Carbon Streaming
By financing the creation or expansion of carbon projects, Carbon Streaming Corporation secures the rights to future carbon credits generated by these sustainable projects. You can then purchase these carbon credits to help fund climate solutions around the world and compensate for your own emissions.
Ready to get involved?
>> Learn more about purchasing carbon credits at Carbon Streaming

-

 Mining2 weeks ago
Charted: The Value Gap Between the Gold Price and Gold Miners
-

 Real Estate1 week ago
Ranked: The Most Valuable Housing Markets in America
-

 Business1 week ago
Charted: Big Four Market Share by S&P 500 Audits
-

 AI1 week ago
The Stock Performance of U.S. Chipmakers So Far in 2024
-

 Misc1 week ago
Almost Every EV Stock is Down After Q1 2024
-

 Money2 weeks ago
Where Does One U.S. Tax Dollar Go?
-

 Green2 weeks ago
Ranked: Top Countries by Total Forest Loss Since 2001
-

 Markets2 weeks ago
Visualizing America’s Shortage of Affordable Homes