Green
5 Drivers Behind the Sustainable Investing Shift
View the full-resolution version of this infographic.

5 Drivers Behind the Sustainable Investing Shift
View the high resolution infographic by clicking here.
Against all odds, sustainable investing in the U.S. smashed records in 2020.
Estimated net flows reached $20.9 billion in the first six months alone—that’s nearly equal to the amount of new money invested in all of 2019.
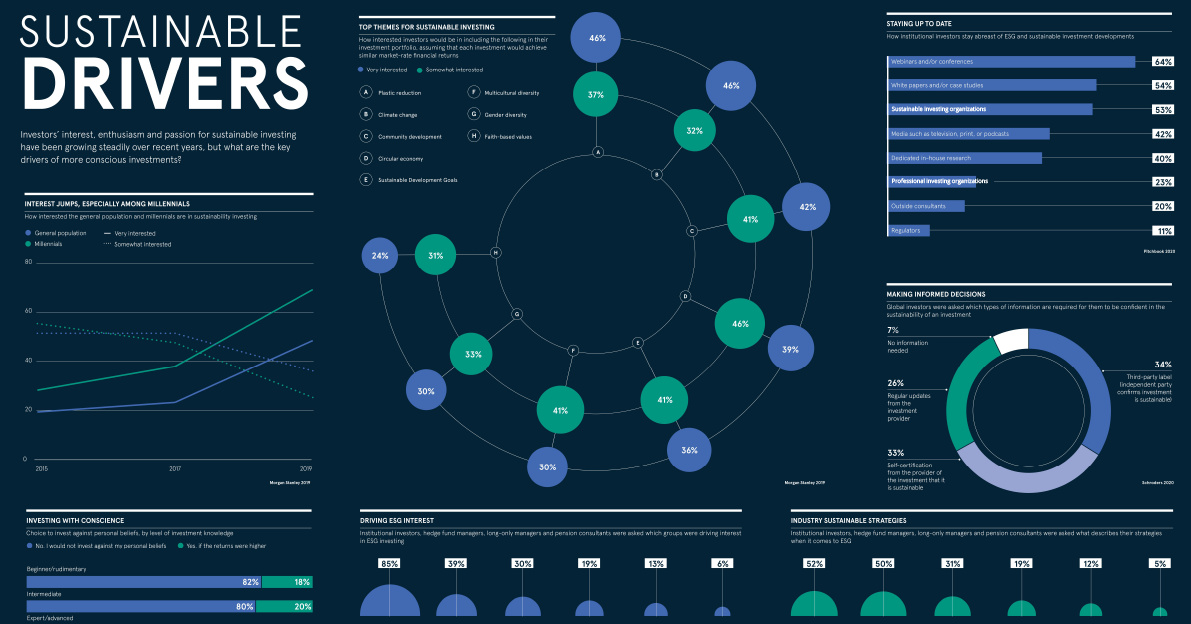
What is driving the shift to sustainable investing? This visual dashboard from Raconteur explains five key drivers, from generational shifts to investors’ preferred strategies.
DRIVER #1:
Millennial Investors and Personal Beliefs
Interest in sustainable investing is booming across the general population. However, there’s a clear generational trend, as well.
While the portion of each group that is “very interested” in sustainable investing has shot up since 2015, this share is significantly higher for millennials.
| Year | General Population | Millennials |
|---|---|---|
| 2015 | 19% | 28% |
| 2017 | 23% | 38% |
| 2019 | 49% | 70% |
Another correlated trend emerges with this.
These days, investors are more likely to follow their conscience. Acccording to a recent report by Schroders, the majority of investors will not budge on investing against their beliefs, even if returns were theoretically higher.
| Level of Investment Knowledge | |||
|---|---|---|---|
| Would you invest against your personal beliefs? | Beginner | Intermediate | Expert |
| Yes, if returns are higher | 18% | 20% | 29% |
| No, I would not invest against my beliefs. | 82% | 80% | 71% |
DRIVER #2:
Top Themes of Interest
Powered by these personal beliefs, which categories are attracting investors? It turns out many investors are very interested in including environment-related themes into their portfolios:
- Plastic reduction: 46%
- Climate change: 46%
- Community development: 42%
- Circular economy: 39%
- Sustainable Development Goals: 36%
- Multicultural diversity: 30%
- Gender diversity: 30%
- Faith-based values: 24%
However, these aren’t the only considerations. Other themes that fit into broader ESG categories such as gender diversity or faith-based values make an appearance, too.
DRIVER #3:
Which Investor Groups are Driving Interest?
Now, we turn our attention to the specific groups that are responsible for the growing momentum towards sustainable investing. This may be surprising to some, but it is institutional investors that are leading the pack by far:
| Group | Share of Group |
|---|---|
| Institutional investors | 85% |
| Institutional consultants | 39% |
| Internal stakeholders | 30% |
| High net worth (HNW) investors | 19% |
| Politicians or regulators | 13% |
| Industry trade bodies | 6% |
This also disproves a common myth that millennials are the only ones interested in the sector. Institutional investors equally want to see a double bottom line: an ROI on their money, while also making the world a more sustainable place.
DRIVER #4:
Sources of Information
So where are institutional investors sourcing their information around sustainable investing? Sharing their ideas in like-minded communities, such as webinars and conferences emerged as the preference for nearly two-thirds of those surveyed in this group.
But how do investors know that their investment is truly sustainable? For this, 34% of global investors feel that third-party labels from independent organizations help lend credibility, and confirm that the chosen investment in question is indeed carried out in a responsible manner.
As more and more institutional investors are digital natives, a significant share of them are also beginning to use social media to influence their decision-making process—and some even rely on it as their key source of research.
DRIVER #5:
Sustainable Investing Strategies
We’ve left the best for last—armed with this knowledge and confidence, which sustainable investing strategies are the most attractive? Here’s how organizations are approaching ESG:
- Sustainability integration: 52%
- Negative screening: 50%
- Shareholder engagement: 31%
- Impact investing: 19%
- Positive screening: 12%
- Thematic investing: 5%
While negative screening—avoiding investments in “sin” stocks such as tobacco or fossil fuels—is still a popular strategy, actively integrating sustainability into one’s portfolio is emerging more front and center.
The Overall Trend of Sustainable Investing
The data makes clear that institutional investors are the main driving forces behind sustainable investment for the time being. But as millennials accumulate wealth, their values may naturally lead them towards more sustainable investment.
Another important point to note is that sustainable investing has been resilient to change. In fact, despite the COVID-induced stock selloff in early 2020, ESG leaders exceeded expectations.
While these drivers evolve over time, it’s clear that sustainable investing is more than having its moment in the spotlight—it’s here to stay.


Green
The Carbon Footprint of Major Travel Methods
Going on a cruise ship and flying domestically are the most carbon-intensive travel methods.


The Carbon Footprint of Major Travel Methods
This was originally posted on our Voronoi app. Download the app for free on iOS or Android and discover incredible data-driven charts from a variety of trusted sources.
Did you know that transport accounts for nearly one-quarter of global energy-related carbon dioxide (CO₂) emissions?
This graphic illustrates the carbon footprints of major travel methods measured in grams of carbon dioxide equivalent (CO₂e) emitted per person to travel one kilometer. This includes both CO₂ and other greenhouse gases.
Data is sourced from Our World in Data, the UK Government’s Department for Energy Security and Net Zero, and The International Council on Clean Transportation, as of December 2022.
These figures should be interpreted as approximations, rather than exact numbers. There are many variables at play that determine the actual carbon footprint in any individual case, including vehicle type or model, occupancy, energy mix, and even weather.
Cruise Ships are the Most Carbon-Intensive Travel Method
According to these estimates, taking a cruise ship, flying domestically, and driving alone are some of the most carbon-intensive travel methods.
Cruise ships typically use heavy fuel oil, which is high in carbon content. The average cruise ship weighs between 70,000 to 180,000 metric tons, meaning they require large engines to get moving.
These massive vessels must also generate power for onboard amenities such as lighting, air conditioning, and entertainment systems.
Short-haul flights are also considered carbon-intensive due to the significant amount of fuel consumed during initial takeoff and climbing altitude, relative to a lower amount of cruising.
| Transportation method | CO₂ equivalent emissions per passenger km |
|---|---|
| Cruise Ship | 250 |
| Short-haul flight (i.e. within a U.S. state or European country) | 246 |
| Diesel car | 171 |
| Gas car | 170 |
| Medium-haul flight (i.e. international travel within Europe, or between U.S. states) | 151 |
| Long-haul flight (over 3,700 km, about the distance from LA to NY) | 147 |
| Motorbike | 113 |
| Bus (average) | 96 |
| Plug-in hybrid | 68 |
| Electric car | 47 |
| National rail | 35 |
| Tram | 28 |
| London Underground | 27 |
| Ferry (foot passenger) | 19 |
| Eurostar (International rail) | 4.5 |
Are EVs Greener?
Many experts agree that EVs produce a lower carbon footprint over time versus traditional internal combustion engine (ICE) vehicles.
However, the batteries in electric vehicles charge on the power that comes straight off the electrical grid—which in many places may be powered by fossil fuels. For that reason, the carbon footprint of an EV will depend largely on the blend of electricity sources used for charging.
There are also questions about how energy-intensive it is to build EVs compared to a comparable ICE vehicle.

-

 Brands6 days ago
How Tech Logos Have Evolved Over Time
-

 Demographics2 weeks ago
The Smallest Gender Wage Gaps in OECD Countries
-

 Economy2 weeks ago
Where U.S. Inflation Hit the Hardest in March 2024
-

 Green2 weeks ago
Top Countries By Forest Growth Since 2001
-

 United States2 weeks ago
Ranked: The Largest U.S. Corporations by Number of Employees
-

 Maps2 weeks ago
The Largest Earthquakes in the New York Area (1970-2024)
-

 Green2 weeks ago
Ranked: The Countries With the Most Air Pollution in 2023
-

 Green2 weeks ago
Ranking the Top 15 Countries by Carbon Tax Revenue