Investor Education
Sustainable Investing: Debunking 5 Common Myths

Sustainable Investing: Debunking 5 Common Myths
It began as a niche desire. Originally, sustainable investing was confined to a subset of investors who wanted their investments to match their values. In recent years, the strategy has grown dramatically: sustainable assets totaled $12 trillion in 2018.
This represents a 38% increase over 2016, with many investors now considering environmental, social, and governance (ESG) factors alongside traditional financial analysis.
Despite the strategy’s growth, lingering misconceptions remain. In today’s infographic from New York Life Investments, we address the five key myths of sustainable investing and shine a light on the realities.
1. Performance
| Myth | Reality |
|---|---|
| Sustainable strategies underperform conventional strategies | Sustainable strategies historically match or outperform conventional strategies |
In 2015, academics analyzed more than 2,000 studies—and found that in roughly 90% of the studies, companies with strong ESG profiles had equal or better financial performance than their non-ESG counterparts.
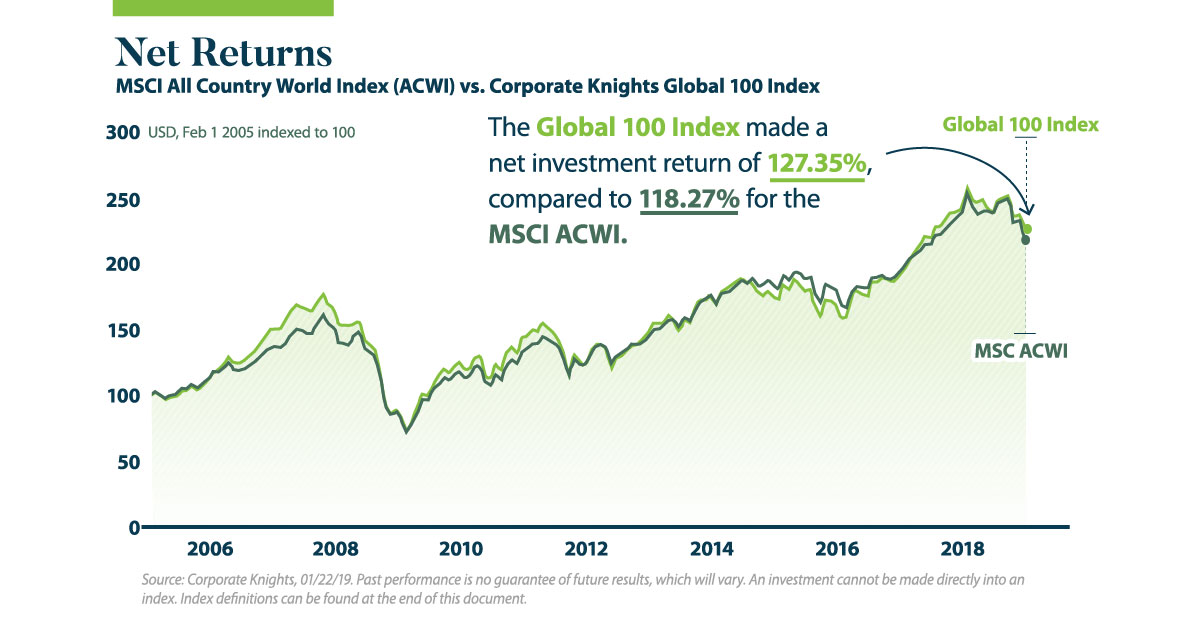
A recent ranking of the 100 most sustainable corporations found similar results. Between February 2005 and August 2018, the Global 100 Index made a net investment return of 127.35%, compared to 118.27% for the MSCI All Country World Index (ACWI).
The Global 100 companies show that doing what is good for the world can also be good for financial performance.
—Toby Heaps, CEO of Corporate Knights
2. Approach
| Myth | Reality |
|---|---|
| Sustainable investing only involves screening out “sin” stocks | Positive approaches that integrate sustainability factors are gaining traction |
In modern investing, exclusionary or “screens-based” approaches do play a large role—and tend to avoid stocks or bonds of companies in the following “sin” categories:
- Alcohol
- Tobacco
- Firearms
- Casinos
However, investment managers are increasingly taking an inclusive approach to sustainability, integrating ESG factors throughout the investment process. ESG integration strategies now total $17.5 trillion in global assets, a 69% increase over the past two years.
3. Longevity
| Myth | Reality |
|---|---|
| Sustainable investing is a passing fad | Sustainable investing has been around for decades and continues to grow |
Over the past decade, sustainable strategies have shown both strong AUM growth and positive asset flows. ESG funds attracted record net flows of nearly $5.5 billion in 2018 despite unfavorable market conditions, and continue to demonstrate strong growth in 2019.
Not only that, the number of sustainable offerings has increased as well. In 2018, Morningstar recognized 351 sustainable funds—a 50% increase over the prior year.
4. Interest
| Myth | Reality |
|---|---|
| Interest in sustainable investing is mostly confined to millennials and women | There is widespread interest in sustainable strategies, with institutional investors leading the way |
Millennials are more likely to factor in sustainability concerns than previous generations. However, institutional investors have adopted sustainable investments more than any other group—accounting for nearly 75% of the managed assets that follow an ESG approach.
In addition, over half of surveyed consumers are “values-driven”, having taken one or more of the following actions with sustainability in mind:
- Boycotted a brand
- Sold shares of a company
- Changed the types of products they used
Women and men are almost equally likely to be motivated by sustainable values, and half of “values-driven” consumers are open to ESG investing.
5. Asset Classes
| Myth | Reality |
|---|---|
| Sustainable investing only works for equities | Sustainable strategies are offered across asset classes |
This myth has a basis in history, but other asset classes are increasingly incorporating ESG analysis. For instance, 36% of today’s sustainable investments are in fixed income.
While the number of sustainable equity investments remained unchanged from 2017-2018, fixed-income and alternative assets showed remarkable growth over the same period.
Tapping into the Potential of Sustainable Investing
It’s clear that sustainable investing is not just a buzzword. Instead, this strategy is integral to many portfolios.
By staying informed, advisors and individual investors can take advantage of this growing strategy—and improve both their impact and return potential.


Investor Education
How MSCI Builds Thematic Indexes: A Step-by-Step Guide
From developing an index objective to choosing relevant stocks, this graphic breaks down how MSCI builds thematic indexes using examples.


How MSCI Builds Thematic Indexes: A Step-by-Step Guide
Have you ever wondered how MSCI builds its thematic indexes?
To capture long-term, structural trends that could drive business performance in the future, the company follows a systematic approach. This graphic from MSCI breaks down each step in the process used to create its thematic indexes.
Step 1: Develop an Index Objective
MSCI first builds a broad statement of what the theme aims to capture based on extensive research and insights from industry experts.
Steps 2 and 3: List Sub-Themes, Generate Keyword List
Together with experts, MSCI creates a list of sub-themes or “seedwords” to identify aligned business activities.
The team then assembles a collection of suitable documents describing the theme. Natural language processing efficiently analyzes word frequency and relevance to generate a more detailed set of keywords contextually similar to the seedwords.
Step 4: Find Relevant Companies
By analyzing financial reports, MSCI picks companies relevant to the theme using two methods:
- Direct approach: Revenue from a company’s business segment is considered 100% relevant if the segment name matches a theme keyword. Standard Industrial Classification (SIC) codes from these directly-matched segments make up the eligible SIC code list used in the indirect approach.
- Indirect approach: If a segment name doesn’t match theme keywords, MSCI will:
- Analyze the density of theme keywords mentioned in the company’s description. A minimum of two unique keywords is required.
- The keyword density determines a “discount factor” to reflect lower certainty in theme alignment.
- Revenue from business segments with an eligible SIC code, regardless of how they are named, is scaled down by the discount factor.
The total percentage of revenue applicable to the theme from both approaches determines a company’s relevance score.
Step 5: Select the Stocks
Finally, MSCI narrows down the stocks that will be included:
- Global parent universe: The ACWI Investable Market Index (IMI) is the starting point for standard thematic indexes.
- Relevance filter: The universe is filtered for companies with a relevance score of at least 25%.
- False positive control: Eligible companies that are mapped to un-related GICS sub-industries are removed.
Companies with higher relevance scores and market caps have a higher weighting in the index, with the maximum weighting for any one issuer capped at 5%. The final selected stocks span various sectors.
MSCI Thematic Indexes: Regularly Updated and Rules-Based
Once an index is built, it is reviewed semi-annually and updated based on:
- Changes to the parent index
- Changes at individual companies
- Theme developments based on expert input
Theme keywords are reviewed yearly in May. Overall, MSCI’s thematic index construction process is objective, scalable, and flexible. The process can be customized based on the theme(s) you want to capture.
Learn more about MSCI’s thematic indexes.

-

 Investor Education6 months ago
The 20 Most Common Investing Mistakes, in One Chart
Here are the most common investing mistakes to avoid, from emotionally-driven investing to paying too much in fees.
-

 Stocks10 months ago
Visualizing BlackRock’s Top Equity Holdings
BlackRock is the world’s largest asset manager, with over $9 trillion in holdings. Here are the company’s top equity holdings.
-

 Investor Education11 months ago
10-Year Annualized Forecasts for Major Asset Classes
This infographic visualizes 10-year annualized forecasts for both equities and fixed income using data from Vanguard.
-

 Investor Education1 year ago
Visualizing 90 Years of Stock and Bond Portfolio Performance
How have investment returns for different portfolio allocations of stocks and bonds compared over the last 90 years?
-

 Debt2 years ago
Countries with the Highest Default Risk in 2022
In this infographic, we examine new data that ranks the top 25 countries by their default risk.
-

 Markets2 years ago
The Best Months for Stock Market Gains
This infographic analyzes over 30 years of stock market performance to identify the best and worst months for gains.


-

 Lithium6 days ago
Ranked: The Top 10 EV Battery Manufacturers in 2023
-

 Green2 weeks ago
Top Countries By Forest Growth Since 2001
-

 United States2 weeks ago
Ranked: The Largest U.S. Corporations by Number of Employees
-

 Maps2 weeks ago
The Largest Earthquakes in the New York Area (1970-2024)
-

 Green2 weeks ago
Ranked: The Countries With the Most Air Pollution in 2023
-

 Green2 weeks ago
Ranking the Top 15 Countries by Carbon Tax Revenue
-

 Markets2 weeks ago
U.S. Debt Interest Payments Reach $1 Trillion
-

 Mining2 weeks ago
Gold vs. S&P 500: Which Has Grown More Over Five Years?