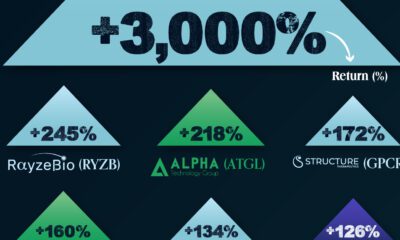
Markets
Venture Capital Mega-Deals on Pace to Set New Record in 2019
The Rise of Mega-Deals in Venture Capital Financing
Venture capital “mega-deals”—which rake in $100 million or more—have taken off at breakneck speed. A total of 185 were signed by the end of September, setting the pace for a record number of mega-deals in 2019.
Interestingly, mega-deal counts aren’t the only thing ballooning in venture capital financing. Almost everything has gotten bigger: venture capital funds, deal sizes, and exit valuations.
Today’s infographic comes from Pitchbook’s quarterly Venture Monitor, and visualizes the trends shaping the U.S. venture capital landscape.
Fundraising
Venture capital fundraising remains robust, with $29.6 billion raised across 162 funds year-to-date. Not only that, a higher proportion of funds are quite large. Roughly 9% were sized $500 million or more, with 15 such mega-funds closed year-to-date.
What does it mean to “close” a fund? Before they can begin operations, a venture capital fund manager will raise money from investors. The fund closes to signify the end of a fundraising round and can go through multiple closings until it reaches its targeted fundraising amount.
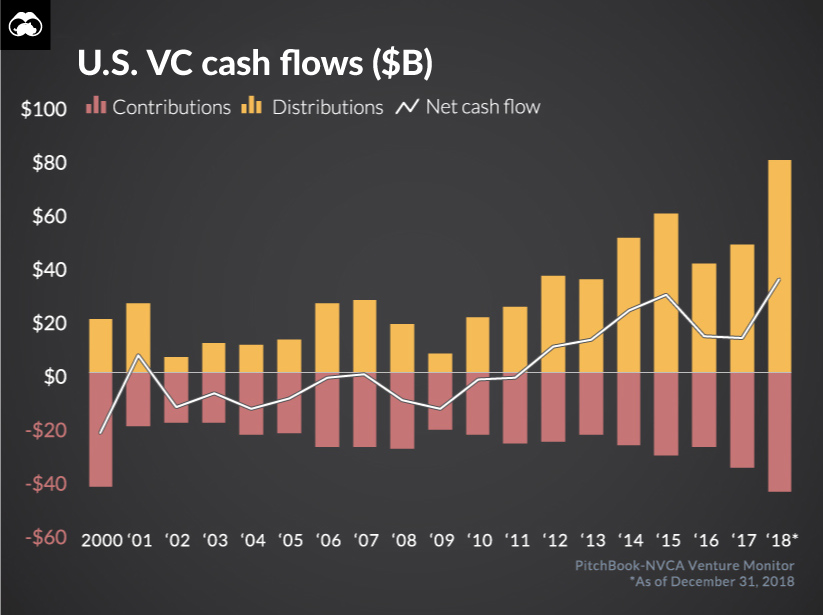
In the coming years, fundraising will likely remain strong. Venture capital net cash flows have been positive since 2012, which means capital is being returned to the limited partners of a fund faster than they can reinvest it into new vehicles.
With this excess cash, investors will likely contribute to the next round of venture capital funds—continuing the virtuous cycle.
Dealmaking
Total deal value is set to surpass $100 billion for a second consecutive year, partly driven by the rise of mega-deals. At every stage of startup financing, average deal sizes remain elevated.
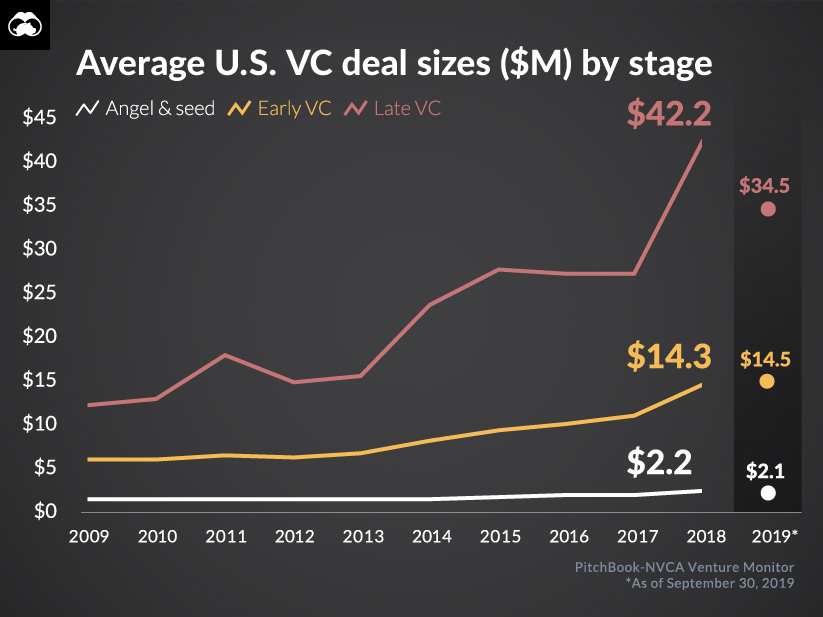
While the focus has shifted to the massive amount of capital available at later stages, angel and seed-stage deals are still quite healthy, with an average deal size of over $2 million.
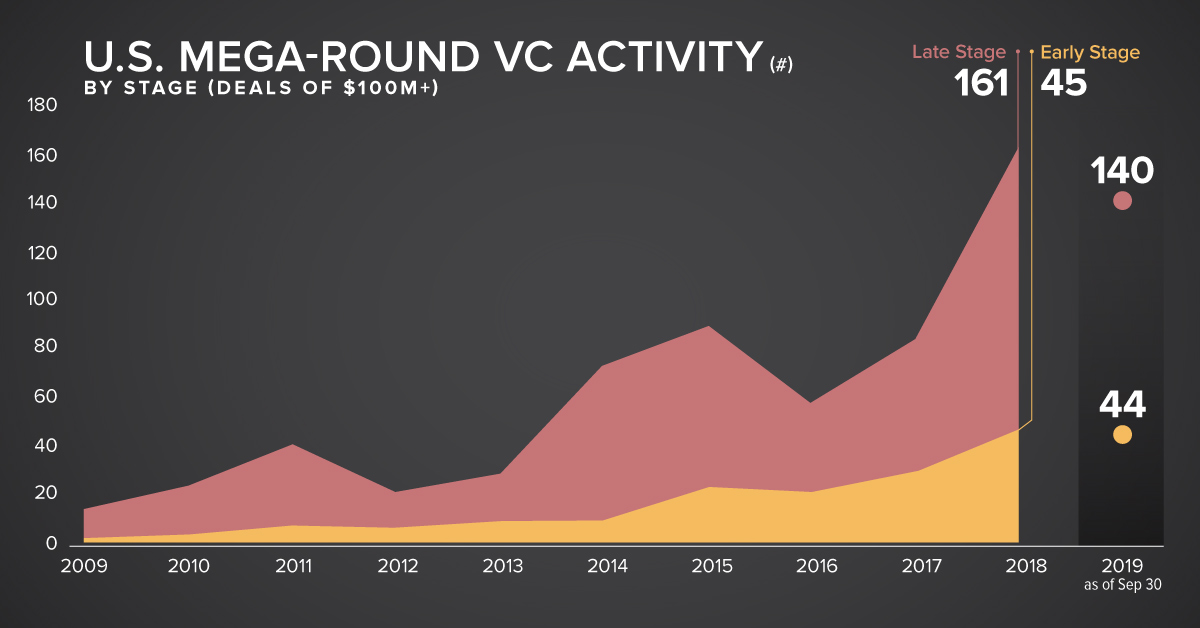
At late financing stages, the 2019 average deal size is nearly $35 million, second only to 2018’s record of $44 million. Companies continue to raise large sums of capital prior to going public, with 140 late-stage mega-deals completed in 2019.
Exits
Total exit value reached $200 billion for the first time in a decade. Interestingly, initial public offerings (IPOs) comprised a whopping 82% of overall exit value.
Multi-billion dollar IPOs continue to dominate headlines, with six such public debuts occurring in the third quarter.
| Company | Industry | Pre-Money Valuation at IPO | Amount Raised at IPO |
|---|---|---|---|
| Datadog | Network Management Software | $7.2B | $648M |
| Peloton Interactive | Recreational Goods | $6.9B | $1.2B |
| Cloudflare | Network Management Software | $3.9B | $525M |
| 10X Genomics | Biotechnology | $3.3B | $390M |
| Medallia | Business/Productivity Software | $2.3B | $326M |
| Livongo | Healthcare Technology | $2.2B | $355M |
Notably missing from the list is WeWork. The company failed to go public due to profitability concerns, and anchor investor Softbank recently provided $9.5 billion in bailout financing in an attempt to rescue the company.
Sky High Valuations
As venture capital reaches new heights, analysts will be paying closer attention to each startup’s profitability potential.
“… new companies are shifting their focus to measured growth in an effort to prioritize long-term success and a more sustainable, scalable business model.”
–Alex Song, CEO and Co-Founder of Innovation Department
With 2019 coming to a close, will fourth quarter venture capital activity be able to maintain its present momentum?


Economy
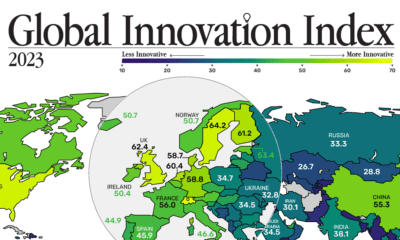
Economic Growth Forecasts for G7 and BRICS Countries in 2024
The IMF has released its economic growth forecasts for 2024. How do the G7 and BRICS countries compare?


G7 & BRICS Real GDP Growth Forecasts for 2024
The International Monetary Fund’s (IMF) has released its real gross domestic product (GDP) growth forecasts for 2024, and while global growth is projected to stay steady at 3.2%, various major nations are seeing declining forecasts.
This chart visualizes the 2024 real GDP growth forecasts using data from the IMF’s 2024 World Economic Outlook for G7 and BRICS member nations along with Saudi Arabia, which is still considering an invitation to join the bloc.
Get the Key Insights of the IMF’s World Economic Outlook
Want a visual breakdown of the insights from the IMF’s 2024 World Economic Outlook report?
This visual is part of a special dispatch of the key takeaways exclusively for VC+ members.
Get the full dispatch of charts by signing up to VC+.
Mixed Economic Growth Prospects for Major Nations in 2024
Economic growth projections by the IMF for major nations are mixed, with the majority of G7 and BRICS countries forecasted to have slower growth in 2024 compared to 2023.
Only three BRICS-invited or member countries, Saudi Arabia, the UAE, and South Africa, have higher projected real GDP growth rates in 2024 than last year.
| Group | Country | Real GDP Growth (2023) | Real GDP Growth (2024P) |
|---|---|---|---|
| G7 | 🇺🇸 U.S. | 2.5% | 2.7% |
| G7 | 🇨🇦 Canada | 1.1% | 1.2% |
| G7 | 🇯🇵 Japan | 1.9% | 0.9% |
| G7 | 🇫🇷 France | 0.9% | 0.7% |
| G7 | 🇮🇹 Italy | 0.9% | 0.7% |
| G7 | 🇬🇧 UK | 0.1% | 0.5% |
| G7 | 🇩🇪 Germany | -0.3% | 0.2% |
| BRICS | 🇮🇳 India | 7.8% | 6.8% |
| BRICS | 🇨🇳 China | 5.2% | 4.6% |
| BRICS | 🇦🇪 UAE | 3.4% | 3.5% |
| BRICS | 🇮🇷 Iran | 4.7% | 3.3% |
| BRICS | 🇷🇺 Russia | 3.6% | 3.2% |
| BRICS | 🇪🇬 Egypt | 3.8% | 3.0% |
| BRICS-invited | 🇸🇦 Saudi Arabia | -0.8% | 2.6% |
| BRICS | 🇧🇷 Brazil | 2.9% | 2.2% |
| BRICS | 🇿🇦 South Africa | 0.6% | 0.9% |
| BRICS | 🇪🇹 Ethiopia | 7.2% | 6.2% |
| 🌍 World | 3.2% | 3.2% |
China and India are forecasted to maintain relatively high growth rates in 2024 at 4.6% and 6.8% respectively, but compared to the previous year, China is growing 0.6 percentage points slower while India is an entire percentage point slower.
On the other hand, four G7 nations are set to grow faster than last year, which includes Germany making its comeback from its negative real GDP growth of -0.3% in 2023.
Faster Growth for BRICS than G7 Nations
Despite mostly lower growth forecasts in 2024 compared to 2023, BRICS nations still have a significantly higher average growth forecast at 3.6% compared to the G7 average of 1%.
While the G7 countries’ combined GDP is around $15 trillion greater than the BRICS nations, with continued higher growth rates and the potential to add more members, BRICS looks likely to overtake the G7 in economic size within two decades.
BRICS Expansion Stutters Before October 2024 Summit
BRICS’ recent expansion has stuttered slightly, as Argentina’s newly-elected president Javier Milei declined its invitation and Saudi Arabia clarified that the country is still considering its invitation and has not joined BRICS yet.
Even with these initial growing pains, South Africa’s Foreign Minister Naledi Pandor told reporters in February that 34 different countries have submitted applications to join the growing BRICS bloc.
Any changes to the group are likely to be announced leading up to or at the 2024 BRICS summit which takes place October 22-24 in Kazan, Russia.
Get the Full Analysis of the IMF’s Outlook on VC+
This visual is part of an exclusive special dispatch for VC+ members which breaks down the key takeaways from the IMF’s 2024 World Economic Outlook.
For the full set of charts and analysis, sign up for VC+.

-

 Markets1 week ago
U.S. Debt Interest Payments Reach $1 Trillion
-

 Markets2 weeks ago
Ranked: The Most Valuable Housing Markets in America
-

 Money2 weeks ago
Which States Have the Highest Minimum Wage in America?
-

 AI2 weeks ago
Ranked: Semiconductor Companies by Industry Revenue Share
-

 Markets2 weeks ago
Ranked: The World’s Top Flight Routes, by Revenue
-

 Countries2 weeks ago
Population Projections: The World’s 6 Largest Countries in 2075
-

 Markets2 weeks ago
The Top 10 States by Real GDP Growth in 2023
-

 Money2 weeks ago
The Smallest Gender Wage Gaps in OECD Countries