Markets
How Different Generations Think About Investing
View the full-size version of the infographic
How Different Generations Think About Investing
View the full-size version of the infographic by clicking here
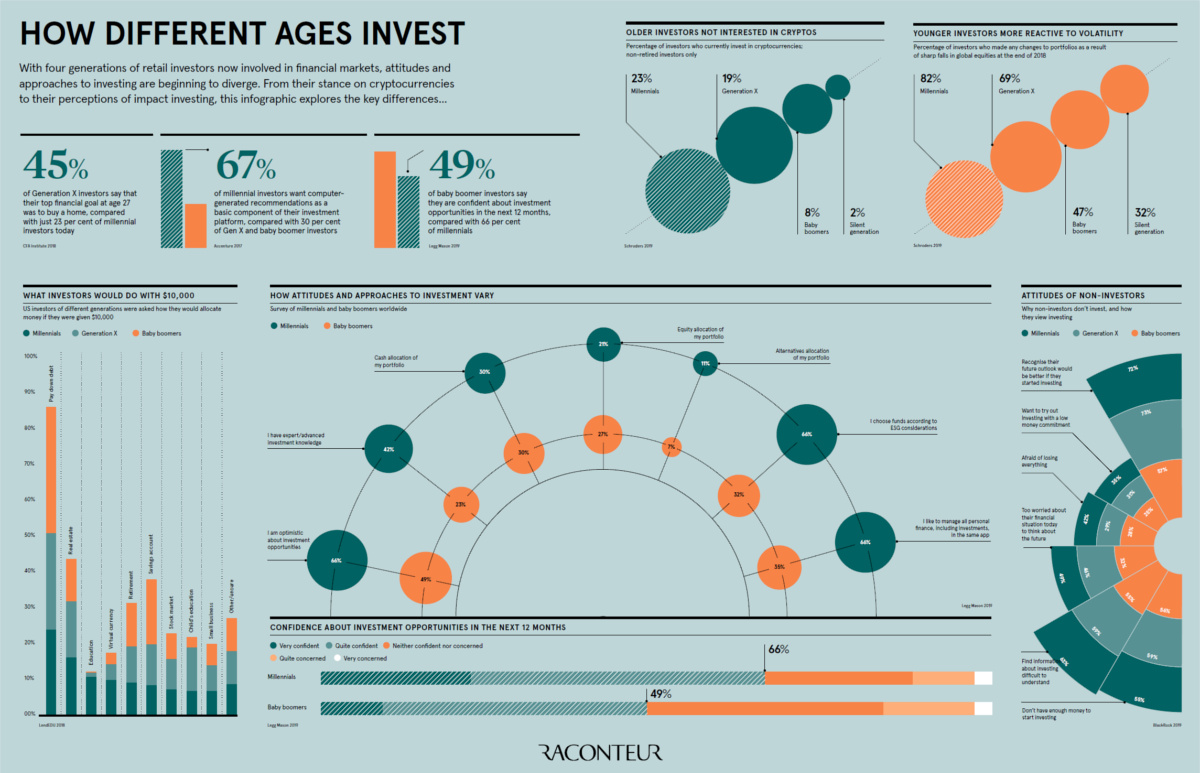
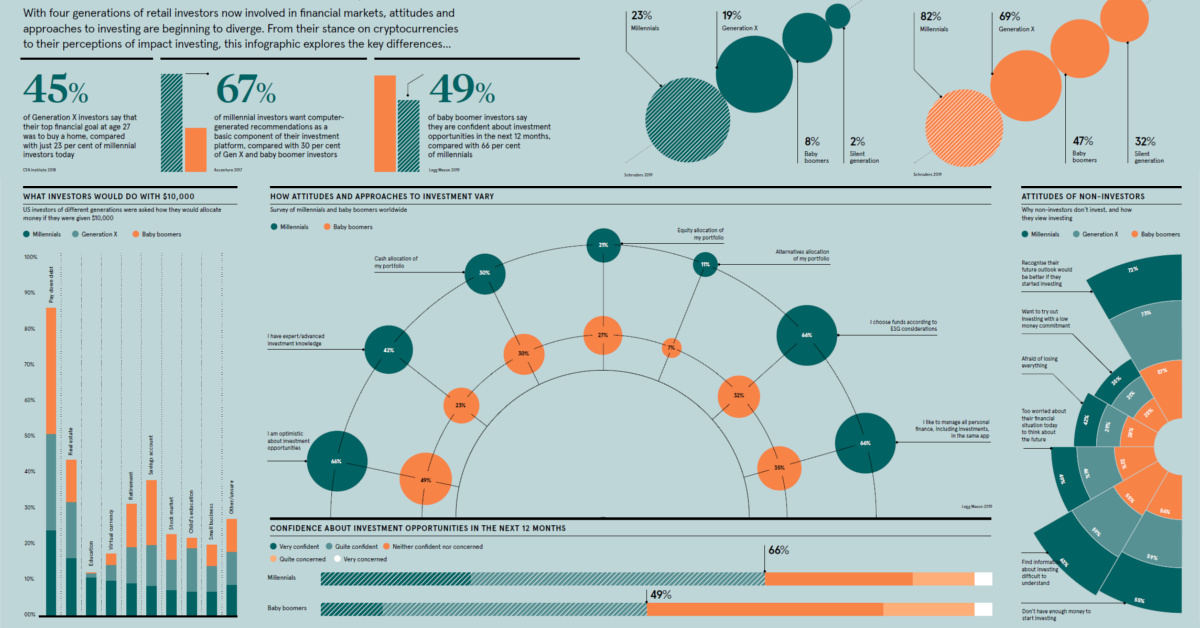
Every generation thinks about investing a little differently.
This is partially due to the fact that each cohort finds itself on a distinct leg of life’s journey. While boomers focus on retirement, Gen Zers are thinking about education and careers. As a result, it’s not surprising to find that investment objectives can differ by age group.
However, there are other major reasons that contribute to each unique generational view. For example, what major world events shaped the mindset of each generation? Also, what role did culture play, and how do things like economic cycles factor in?
Finding Generational Discrepancies
Today’s infographic comes to us from Raconteur, and it showcases some of the most significant differences in how generations think about investing.
Let’s dive into some of the most interesting data:
1. Investment Outlook
The majority of millennials (66%) are confident about investment opportunities in the next 12 months. This drops down to 49% when boomers are asked the same question.
2. Volatility
How did different generations of investors react to recent bouts of volatility in the market?
- 82% of millennials made changes to their portfolios
- 69% of Gen X made changes
- 47% of boomers made changes
- 32% of the Silent Generation made changes
3. Knowledge and Ability
In terms of investment knowledge, 42% of millennials considered themselves to be experts in the field. On the same question, only 23% of boomers could say the same.
4. Financial Goals
Back when they were 27 years old, 45% of Gen Xers said their primary goal was to buy a home. Compare this to just 23% of millennials that consider a home to be their primary investment objective today.
5. Managing Investments
The majority of millennials (66%) saw the ability to manage all aspects of personal finance, including investments, in the same app as being important. Only 35% of boomers agreed.
Similarly, 67% of millennials saw recommendations made by artificial intelligence as being a basic part of any investment platform. Both Gen Xers and Baby Boomers were more hesitant, with 30% seeing computer-based recommendations as being integral.
6. Impact Investing
Millennials are twice as interested in ESG (environmental, social, and governance) investing, compared to their boomer counterparts. In fact, the majority of millennials (66%) choose funds according to ESG considerations.
Reasons for Not Investing
While generations may have varying investment philosophies, they seem a little more in sync when it comes to having reasons not to invest.
| Statement | Millennials | Gen X | Boomers |
|---|---|---|---|
| Recognize future outlook would be better if they start investing | 72% | 73% | 57% |
| Want to try out investing with a low money commitment | 35% | 31% | 25% |
| Afraid of losing everything | 42% | 29% | 28% |
| Too worried about current financial situation to think about future | 49% | 46% | 32% |
| Find information about investing difficult to understand | 63% | 59% | 55% |
| Don't have enough money to start investing | 55% | 59% | 56% |
There are some similarities in the data here – for example, non-investors of all generations seem to have an equally tough time learning about investing, and similar proportions do not believe they have the funds to start investing.
On the flipside, it seems that millennials are more worried about their financial future, while simultaneously seeing a risk of “losing everything” stemming from investing.


Markets
The European Stock Market: Attractive Valuations Offer Opportunities
On average, the European stock market has valuations that are nearly 50% lower than U.S. valuations. But how can you access the market?


European Stock Market: Attractive Valuations Offer Opportunities
Europe is known for some established brands, from L’Oréal to Louis Vuitton. However, the European stock market offers additional opportunities that may be lesser known.
The above infographic, sponsored by STOXX, outlines why investors may want to consider European stocks.
Attractive Valuations
Compared to most North American and Asian markets, European stocks offer lower or comparable valuations.
| Index | Price-to-Earnings Ratio | Price-to-Book Ratio |
|---|---|---|
| EURO STOXX 50 | 14.9 | 2.2 |
| STOXX Europe 600 | 14.4 | 2 |
| U.S. | 25.9 | 4.7 |
| Canada | 16.1 | 1.8 |
| Japan | 15.4 | 1.6 |
| Asia Pacific ex. China | 17.1 | 1.8 |
Data as of February 29, 2024. See graphic for full index names. Ratios based on trailing 12 month financials. The price to earnings ratio excludes companies with negative earnings.
On average, European valuations are nearly 50% lower than U.S. valuations, potentially offering an affordable entry point for investors.
Research also shows that lower price ratios have historically led to higher long-term returns.
Market Movements Not Closely Connected
Over the last decade, the European stock market had low-to-moderate correlation with North American and Asian equities.
The below chart shows correlations from February 2014 to February 2024. A value closer to zero indicates low correlation, while a value of one would indicate that two regions are moving in perfect unison.
| EURO STOXX 50 | STOXX EUROPE 600 | U.S. | Canada | Japan | Asia Pacific ex. China |
|
|---|---|---|---|---|---|---|
| EURO STOXX 50 | 1.00 | 0.97 | 0.55 | 0.67 | 0.24 | 0.43 |
| STOXX EUROPE 600 | 1.00 | 0.56 | 0.71 | 0.28 | 0.48 | |
| U.S. | 1.00 | 0.73 | 0.12 | 0.25 | ||
| Canada | 1.00 | 0.22 | 0.40 | |||
| Japan | 1.00 | 0.88 | ||||
| Asia Pacific ex. China | 1.00 |
Data is based on daily USD returns.
European equities had relatively independent market movements from North American and Asian markets. One contributing factor could be the differing sector weights in each market. For instance, technology makes up a quarter of the U.S. market, but health care and industrials dominate the broader European market.
Ultimately, European equities can enhance portfolio diversification and have the potential to mitigate risk for investors.
Tracking the Market
For investors interested in European equities, STOXX offers a variety of flagship indices:
| Index | Description | Market Cap |
|---|---|---|
| STOXX Europe 600 | Pan-regional, broad market | €10.5T |
| STOXX Developed Europe | Pan-regional, broad-market | €9.9T |
| STOXX Europe 600 ESG-X | Pan-regional, broad market, sustainability focus | €9.7T |
| STOXX Europe 50 | Pan-regional, blue-chip | €5.1T |
| EURO STOXX 50 | Eurozone, blue-chip | €3.5T |
Data is as of February 29, 2024. Market cap is free float, which represents the shares that are readily available for public trading on stock exchanges.
The EURO STOXX 50 tracks the Eurozone’s biggest and most traded companies. It also underlies one of the world’s largest ranges of ETFs and mutual funds. As of November 2023, there were €27.3 billion in ETFs and €23.5B in mutual fund assets under management tracking the index.
“For the past 25 years, the EURO STOXX 50 has served as an accurate, reliable and tradable representation of the Eurozone equity market.”
— Axel Lomholt, General Manager at STOXX
Partnering with STOXX to Track the European Stock Market
Are you interested in European equities? STOXX can be a valuable partner:
- Comprehensive, liquid and investable ecosystem
- European heritage, global reach
- Highly sophisticated customization capabilities
- Open architecture approach to using data
- Close partnerships with clients
- Part of ISS STOXX and Deutsche Börse Group
With a full suite of indices, STOXX can help you benchmark against the European stock market.
Learn how STOXX’s European indices offer liquid and effective market access.

-

 Economy2 days ago
Economic Growth Forecasts for G7 and BRICS Countries in 2024
The IMF has released its economic growth forecasts for 2024. How do the G7 and BRICS countries compare?
-

 Markets1 week ago
U.S. Debt Interest Payments Reach $1 Trillion
U.S. debt interest payments have surged past the $1 trillion dollar mark, amid high interest rates and an ever-expanding debt burden.
-

 United States2 weeks ago
Ranked: The Largest U.S. Corporations by Number of Employees
We visualized the top U.S. companies by employees, revealing the massive scale of retailers like Walmart, Target, and Home Depot.
-

 Markets2 weeks ago
The Top 10 States by Real GDP Growth in 2023
This graphic shows the states with the highest real GDP growth rate in 2023, largely propelled by the oil and gas boom.
-

 Markets2 weeks ago
Ranked: The World’s Top Flight Routes, by Revenue
In this graphic, we show the highest earning flight routes globally as air travel continued to rebound in 2023.
-

 Markets3 weeks ago
Ranked: The Most Valuable Housing Markets in America
The U.S. residential real estate market is worth a staggering $47.5 trillion. Here are the most valuable housing markets in the country.


-

 Debt1 week ago
How Debt-to-GDP Ratios Have Changed Since 2000
-
Markets2 weeks ago
Ranked: The World’s Top Flight Routes, by Revenue
-

 Countries2 weeks ago
Population Projections: The World’s 6 Largest Countries in 2075
-
Markets2 weeks ago
The Top 10 States by Real GDP Growth in 2023
-

 Demographics2 weeks ago
The Smallest Gender Wage Gaps in OECD Countries
-

 United States2 weeks ago
Where U.S. Inflation Hit the Hardest in March 2024
-

 Green2 weeks ago
Top Countries By Forest Growth Since 2001
-
United States2 weeks ago
Ranked: The Largest U.S. Corporations by Number of Employees