Markets
Visualizing the Most Populous Countries in the World
Visualizing the Most Populous Countries in the World
India’s population is projected to surpass China’s as soon as 2022.
While this is consequential on a global economic level, it also leaves other population trends overlooked. For instance, Nigeria is projected to have more people than the U.S., the world’s third-largest country by population, by the year 2050.
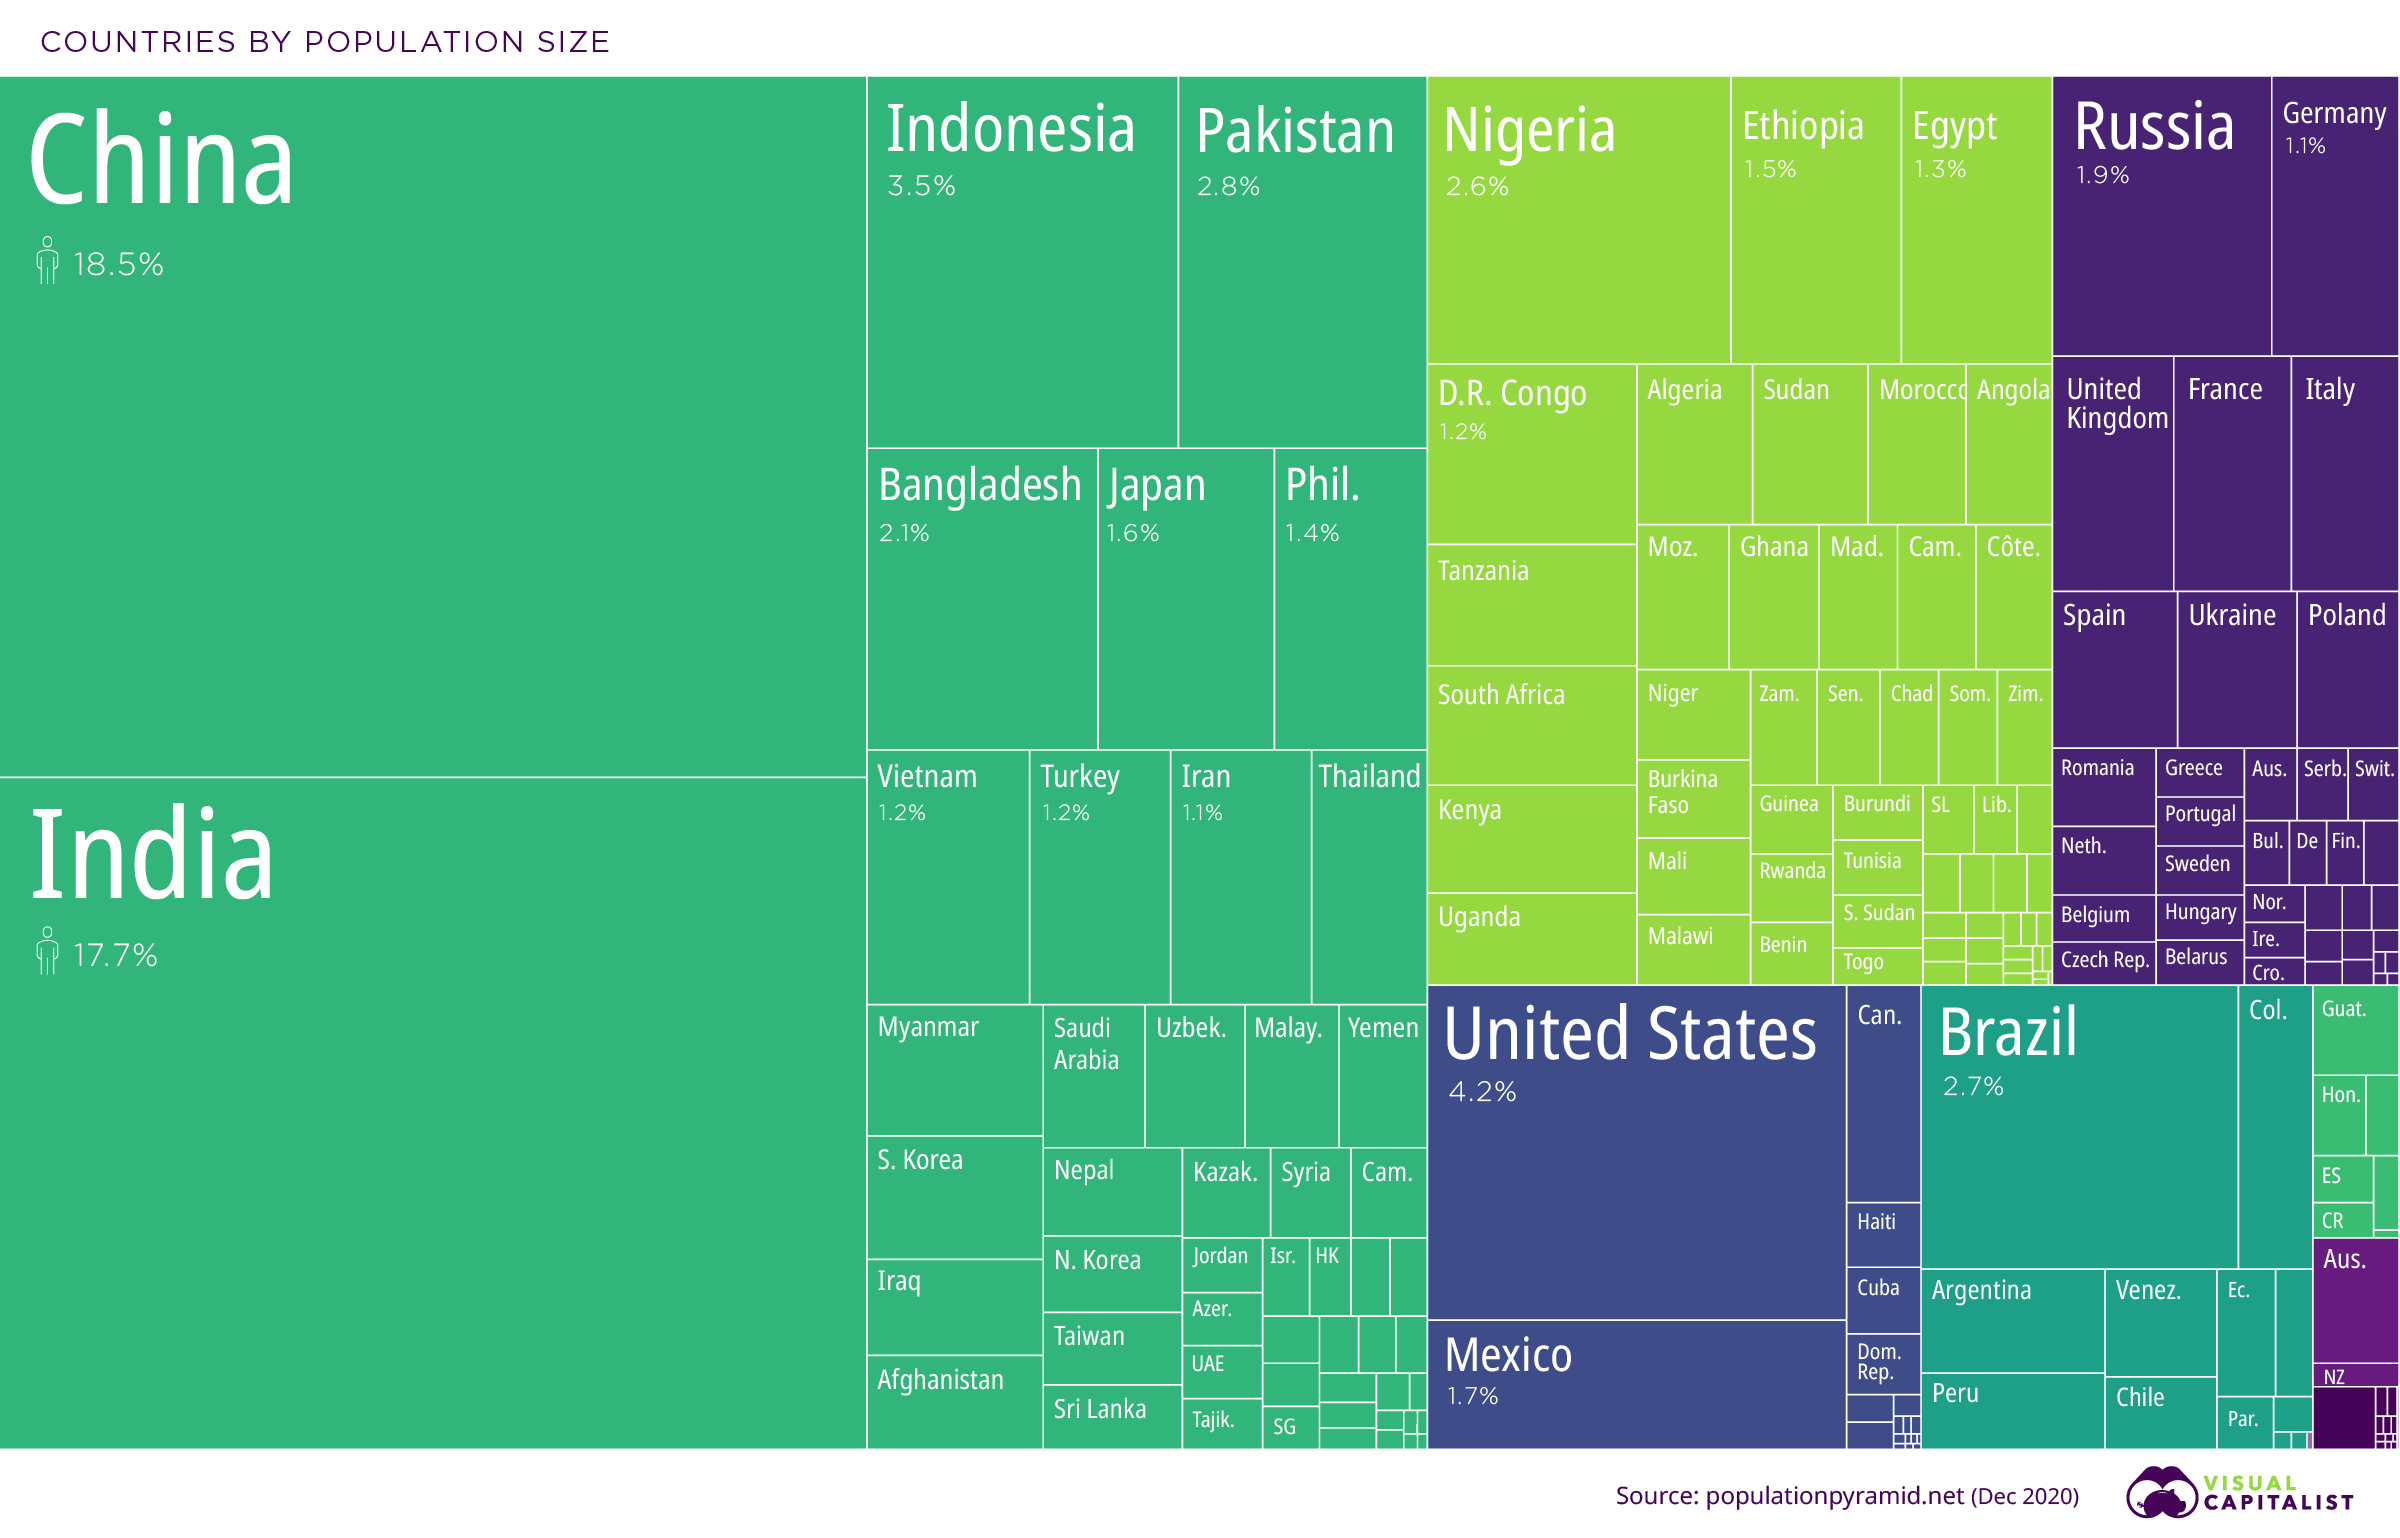
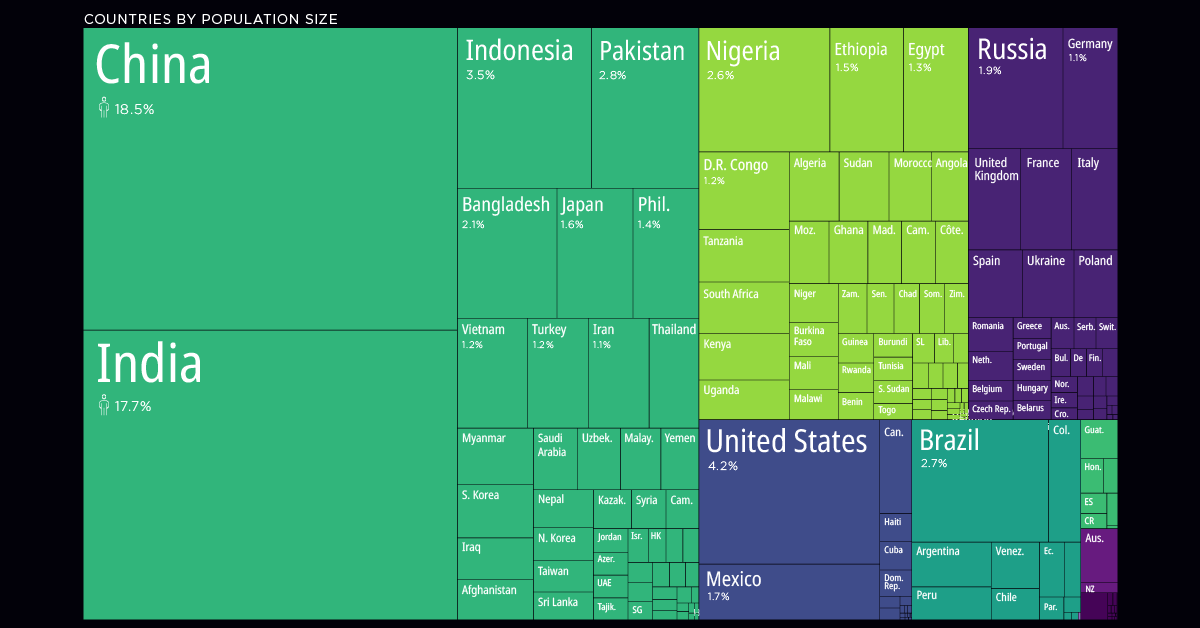
This treemap visualization, adapted from PopulationPyramid.net, is an overview of the global population in 2020, showing us the world’s most populous countries.
The 50 Most Populous Countries
China, with a population of 1.44 billion, is the most populous country worldwide.
In 2019, over 60% of its population resided in urban centers, a trend that has seen the portion of city dwellers double over the last 25 years. For context, 83% of the U.S. population lives in cities, while just 35% of India’s population dwells in urban areas.
Together, China and India’s populations make up over 36% of the global total.
| Country | Population (2020) | |
|---|---|---|
| 1 | 🇨🇳 China | 1,439,323,774 |
| 2 | 🇮🇳 India | 1,380,004,385 |
| 3 | 🇺🇸 U.S. | 331,002,647 |
| 4 | 🇮🇩 Indonesia | 273,523,621 |
| 5 | 🇵🇰 Pakistan | 220,892,331 |
| 6 | 🇧🇷 Brazil | 212,559,409 |
| 7 | 🇳🇬 Nigeria | 206,139,587 |
| 8 | 🇧🇩 Bangladesh | 164,689,383 |
| 9 | 🇷🇺 Russian Federation | 145,934,460 |
| 10 | 🇲🇽 Mexico | 128,932,753 |
| 11 | 🇯🇵 Japan | 126,476,458 |
| 12 | 🇪🇹 Ethiopia | 114,963,583 |
| 13 | 🇵🇭 Philippines | 109,581,085 |
| 14 | 🇪🇬 Egypt | 102,334,403 |
| 15 | 🇻🇳 Vietnam | 97,338,583 |
| 16 | 🇨🇩 D.R. Congo | 89,561,404 |
| 17 | 🇹🇷 Turkey | 84,339,067 |
| 18 | 🇮🇷 Iran | 83,992,953 |
| 19 | 🇩🇪 Germany | 83,783,945 |
| 20 | 🇹🇭 Thailand | 69,799,978 |
| 21 | 🇬🇧 United Kingdom | 67,886,004 |
| 22 | 🇫🇷 France | 65,273,512 |
| 23 | 🇮🇹 Italy | 60,461,828 |
| 24 | 🇹🇿 Tanzania | 59,734,213 |
| 25 | 🇿🇦 South Africa | 59,308,690 |
| 26 | 🇲🇲 Myanmar | 54,409,794 |
| 27 | 🇰🇪Kenya | 53,771,300 |
| 28 | 🇰🇷 Republic of Korea | 51,269,183 |
| 29 | 🇨🇴 Colombia | 50,882,884 |
| 30 | 🇪🇸 Spain | 46,754,783 |
| 31 | 🇺🇬 Uganda | 45,741,000 |
| 32 | 🇦🇷 Argentina | 45,195,777 |
| 33 | 🇩🇿 Algeria | 43,851,043 |
| 34 | 🇸🇩 Sudan | 43,849,269 |
| 35 | 🇺🇦 Ukraine | 43,733,759 |
| 36 | 🇮🇶 Iraq | 40,222,503 |
| 37 | 🇦🇫 Afghanistan | 38,928,341 |
| 38 | 🇵🇱 Poland | 37,846,605 |
| 39 | 🇨🇦 Canada | 37,742,157 |
| 40 | 🇲🇦 Morocco | 36,910,558 |
| 41 | 🇸🇦 Saudi Arabia | 34,813,867 |
| 42 | 🇺🇿 Uzbekistan | 33,469,199 |
| 43 | 🇵🇪 Peru | 32,971,846 |
| 44 | 🇦🇴 Angola | 32,866,268 |
| 45 | 🇲🇾 Malaysia | 32,365,998 |
| 46 | 🇲🇿 Mozambique | 31,255,435 |
| 47 | 🇬🇭 Ghana | 31,072,945 |
| 48 | 🇾🇪 Yemen | 29,825,968 |
| 49 | 🇳🇵 Nepal | 29,136,808 |
| 50 | 🇻🇪 Venezuela | 28,435,943 |
Extending over 17,000 islands, Indonesia comes fourth among the world’s most populous countries, standing at 273.5 million people.
Pakistan comes in fifth, with 220.8 million. Karachi, located on the southeastern coast of Pakistan, is home to over 16 million people alone. It is Pakistan’s most populous city, and the seventh-largest city in the world.
Nigeria also makes it onto the list. In just three decades, the country’s population is projected to climb from 206 million to 400 million—growing at a percentage clip that is more than double that of India.
The 50 Least Populous Countries
Combined, the 50 least-populous countries make up under 0.4% of the total world population. By contrast, the top 50 account for 87% of the total.
Unsurprisingly, the world’s low population nations are situated on small islands, often tropical and reliant on tourism.
| Country | Population* | |
|---|---|---|
| 1 | 🇻🇦 Vatican City | 799 |
| 2 | 🇹🇰 Tokelau | 1,340 |
| 3 | 🇳🇺 Niue | 1,615 |
| 4 | 🇫🇰 Falkland Islands | 3,377 |
| 5 | 🇲🇸 Montserrat | 4,989 |
| 6 | 🇵🇲 Saint Pierre and Miquelon | 5,822 |
| 7 | 🇸🇭 Saint Helena | 6,059 |
| 8 | 🇳🇷 Nauru | 10,756 |
| 9 | 🇼🇫 Wallis and Futuna | 11,432 |
| 10 | 🇹🇻 Tuvalu | 11,646 |
| 11 | 🇦🇮 Anguilla | 14,869 |
| 12 | 🇨🇰 Cook Islands | 17,548 |
| 13 | 🇵🇼 Palau | 18,008 |
| 14 | 🇧🇶 Caribbean Netherlands | 25,979 |
| 15 | 🇻🇬 British Virgin Islands | 30,030 |
| 16 | 🇬🇮 Gibraltar | 33,701 |
| 17 | 🇸🇲 San Marino | 33,860 |
| 18 | 🇱🇮 Liechtenstein | 38,019 |
| 19 | 🇹🇨 Turks and Caicos Islands | 38,191 |
| 20 | 🇲🇨 Monaco | 38,964 |
| 21 | 🇸🇽 Sint Maarten | 42,388 |
| 22 | 🇫🇴 Faroe Islands | 48,678 |
| 23 | 🇰🇳 Saint Kitts and Nevis | 52,823 |
| 24 | 🇦🇸 American Samoa | 55,312 |
| 25 | 🇲🇵 Northern Mariana Islands | 56,188 |
| 26 | 🇬🇱 Greenland | 56,672 |
| 27 | 🇲🇭 Marshall Islands | 58,791 |
| 28 | 🇧🇲 Bermuda | 62,506 |
| 29 | 🇰🇾 Cayman Islands | 64,948 |
| 30 | 🇩🇲 Dominica | 71,808 |
| 31 | 🇦🇩 Andorra | 77,142 |
| 32 | 🇮🇲 Isle of Man | 84,584 |
| 33 | 🇦🇬 Antigua and Barbuda | 97,118 |
| 34 | 🇸🇨 Seychelles | 97,739 |
| 35 | 🇻🇮 United States Virgin Islands | 104,578 |
| 36 | 🇦🇼 Aruba | 106,314 |
| 37 | 🇻🇨 Saint Vincent and the Grenadines | 110,589 |
| 38 | 🇹🇴 Tonga | 110,940 |
| 39 | 🇬🇩 Grenada | 112,003 |
| 40 | 🇫🇲 Micronesia (Fed. States of) | 113,815 |
| 41 | 🇰🇮 Kiribati | 117,606 |
| 42 | 🇨🇼 Curaçao | 163,424 |
| 43 | 🇬🇺 Guam | 167,294 |
| 44 | Channel Islands | 172,259 |
| 45 | 🇱🇨 Saint Lucia | 182,790 |
| 46 | 🇼🇸 Samoa | 197,097 |
| 47 | 🇸🇹 São Tomé and Príncipe | 215,056 |
| 48 | Mayotte | 266,150 |
| 49 | 🇵🇫 French Polynesia | 279,287 |
| 50 | 🇬🇫 French Guiana | 282,731 |
*Source: United Nations, as of July 1, 2019. Includes territories.
With a total of 799 residents in 2019, Vatican City is the least populated country. Following close behind is the territory of Tokelau, a cluster of islands situated between New Zealand and Hawaii.
The Caribbean island nation of Antigua and Barbuda is also among the smallest populations in the world, with just 97,118 inhabitants. While it may be small in terms of total inhabitants, its population density is another story—with over 222 people per square kilometer. That is roughly 50% higher than China, but about half the population density of India.
Meanwhile, the 33 pacific islands of Kiribati also make the top 50 list of the least populous countries worldwide. With a population of 117,606, Kiribati was a testing site for atomic bombs by the British and Americans during the 1960s. The island reached independence in 1979, after being under crown colonial rule since 1916.
Regional Median Ages
How about the median ages across these populations?
By far, the African region has the lowest median age at 19.8 years old, partially driven by a high birth rate of 4.7 children per woman. In contrast, the global average falls around 2.5 children.
By 2050, Africa’s population will effectively double from 1.3 billion to 2.5 billion.
| Region | Annual Rate of Natural Population Increase | Median Age (2020) |
|---|---|---|
| Africa | 2.5% | 19.8 years |
| Asia | 0.9% | 32.1 years |
| Central America | 1.2% | 28.3 years |
| Europe | -0.1% | 42.7 years |
| Latin America & Caribbean | 0.9% | 30.9 years |
| Northern America | 0.3% | 38.6 years |
| Oceania | 0.9% | 33.5 years |
| South America | 0.9% | 32.0 years |
| World | 1.0% | 30.9 years |
Source: Our World in Data
On the other hand, Europe is the oldest, at 42.7 years for this demographic metric.
With a median age of 47.9, Italy has the second-oldest population in the world, topped only by Japan. Meanwhile, Germany (46.6), Portugal (46.2), and Spain (45.5) fall next in line. If current trends continue, by 2050, half of Europe’s population will be non-working and over the age of 65.
That said, it should be noted that this trend is not exclusive to Europe. In 30 years, 1.5 billion people globally will be over the age of 65, amounting to 16% of the global population.


Economy
Economic Growth Forecasts for G7 and BRICS Countries in 2024
The IMF has released its economic growth forecasts for 2024. How do the G7 and BRICS countries compare?


G7 & BRICS Real GDP Growth Forecasts for 2024
The International Monetary Fund’s (IMF) has released its real gross domestic product (GDP) growth forecasts for 2024, and while global growth is projected to stay steady at 3.2%, various major nations are seeing declining forecasts.
This chart visualizes the 2024 real GDP growth forecasts using data from the IMF’s 2024 World Economic Outlook for G7 and BRICS member nations along with Saudi Arabia, which is still considering an invitation to join the bloc.
Get the Key Insights of the IMF’s World Economic Outlook
Want a visual breakdown of the insights from the IMF’s 2024 World Economic Outlook report?
This visual is part of a special dispatch of the key takeaways exclusively for VC+ members.
Get the full dispatch of charts by signing up to VC+.
Mixed Economic Growth Prospects for Major Nations in 2024
Economic growth projections by the IMF for major nations are mixed, with the majority of G7 and BRICS countries forecasted to have slower growth in 2024 compared to 2023.
Only three BRICS-invited or member countries, Saudi Arabia, the UAE, and South Africa, have higher projected real GDP growth rates in 2024 than last year.
| Group | Country | Real GDP Growth (2023) | Real GDP Growth (2024P) |
|---|---|---|---|
| G7 | 🇺🇸 U.S. | 2.5% | 2.7% |
| G7 | 🇨🇦 Canada | 1.1% | 1.2% |
| G7 | 🇯🇵 Japan | 1.9% | 0.9% |
| G7 | 🇫🇷 France | 0.9% | 0.7% |
| G7 | 🇮🇹 Italy | 0.9% | 0.7% |
| G7 | 🇬🇧 UK | 0.1% | 0.5% |
| G7 | 🇩🇪 Germany | -0.3% | 0.2% |
| BRICS | 🇮🇳 India | 7.8% | 6.8% |
| BRICS | 🇨🇳 China | 5.2% | 4.6% |
| BRICS | 🇦🇪 UAE | 3.4% | 3.5% |
| BRICS | 🇮🇷 Iran | 4.7% | 3.3% |
| BRICS | 🇷🇺 Russia | 3.6% | 3.2% |
| BRICS | 🇪🇬 Egypt | 3.8% | 3.0% |
| BRICS-invited | 🇸🇦 Saudi Arabia | -0.8% | 2.6% |
| BRICS | 🇧🇷 Brazil | 2.9% | 2.2% |
| BRICS | 🇿🇦 South Africa | 0.6% | 0.9% |
| BRICS | 🇪🇹 Ethiopia | 7.2% | 6.2% |
| 🌍 World | 3.2% | 3.2% |
China and India are forecasted to maintain relatively high growth rates in 2024 at 4.6% and 6.8% respectively, but compared to the previous year, China is growing 0.6 percentage points slower while India is an entire percentage point slower.
On the other hand, four G7 nations are set to grow faster than last year, which includes Germany making its comeback from its negative real GDP growth of -0.3% in 2023.
Faster Growth for BRICS than G7 Nations
Despite mostly lower growth forecasts in 2024 compared to 2023, BRICS nations still have a significantly higher average growth forecast at 3.6% compared to the G7 average of 1%.
While the G7 countries’ combined GDP is around $15 trillion greater than the BRICS nations, with continued higher growth rates and the potential to add more members, BRICS looks likely to overtake the G7 in economic size within two decades.
BRICS Expansion Stutters Before October 2024 Summit
BRICS’ recent expansion has stuttered slightly, as Argentina’s newly-elected president Javier Milei declined its invitation and Saudi Arabia clarified that the country is still considering its invitation and has not joined BRICS yet.
Even with these initial growing pains, South Africa’s Foreign Minister Naledi Pandor told reporters in February that 34 different countries have submitted applications to join the growing BRICS bloc.
Any changes to the group are likely to be announced leading up to or at the 2024 BRICS summit which takes place October 22-24 in Kazan, Russia.
Get the Full Analysis of the IMF’s Outlook on VC+
This visual is part of an exclusive special dispatch for VC+ members which breaks down the key takeaways from the IMF’s 2024 World Economic Outlook.
For the full set of charts and analysis, sign up for VC+.

-

 Markets1 week ago
U.S. Debt Interest Payments Reach $1 Trillion
-

 Markets2 weeks ago
Ranked: The Most Valuable Housing Markets in America
-

 Money2 weeks ago
Which States Have the Highest Minimum Wage in America?
-

 AI2 weeks ago
Ranked: Semiconductor Companies by Industry Revenue Share
-

 Markets2 weeks ago
Ranked: The World’s Top Flight Routes, by Revenue
-

 Demographics2 weeks ago
Population Projections: The World’s 6 Largest Countries in 2075
-

 Markets2 weeks ago
The Top 10 States by Real GDP Growth in 2023
-

 Money2 weeks ago
The Smallest Gender Wage Gaps in OECD Countries