The Domino Effects of Tropical Deforestation

The Domino Effects of Tropical Deforestation
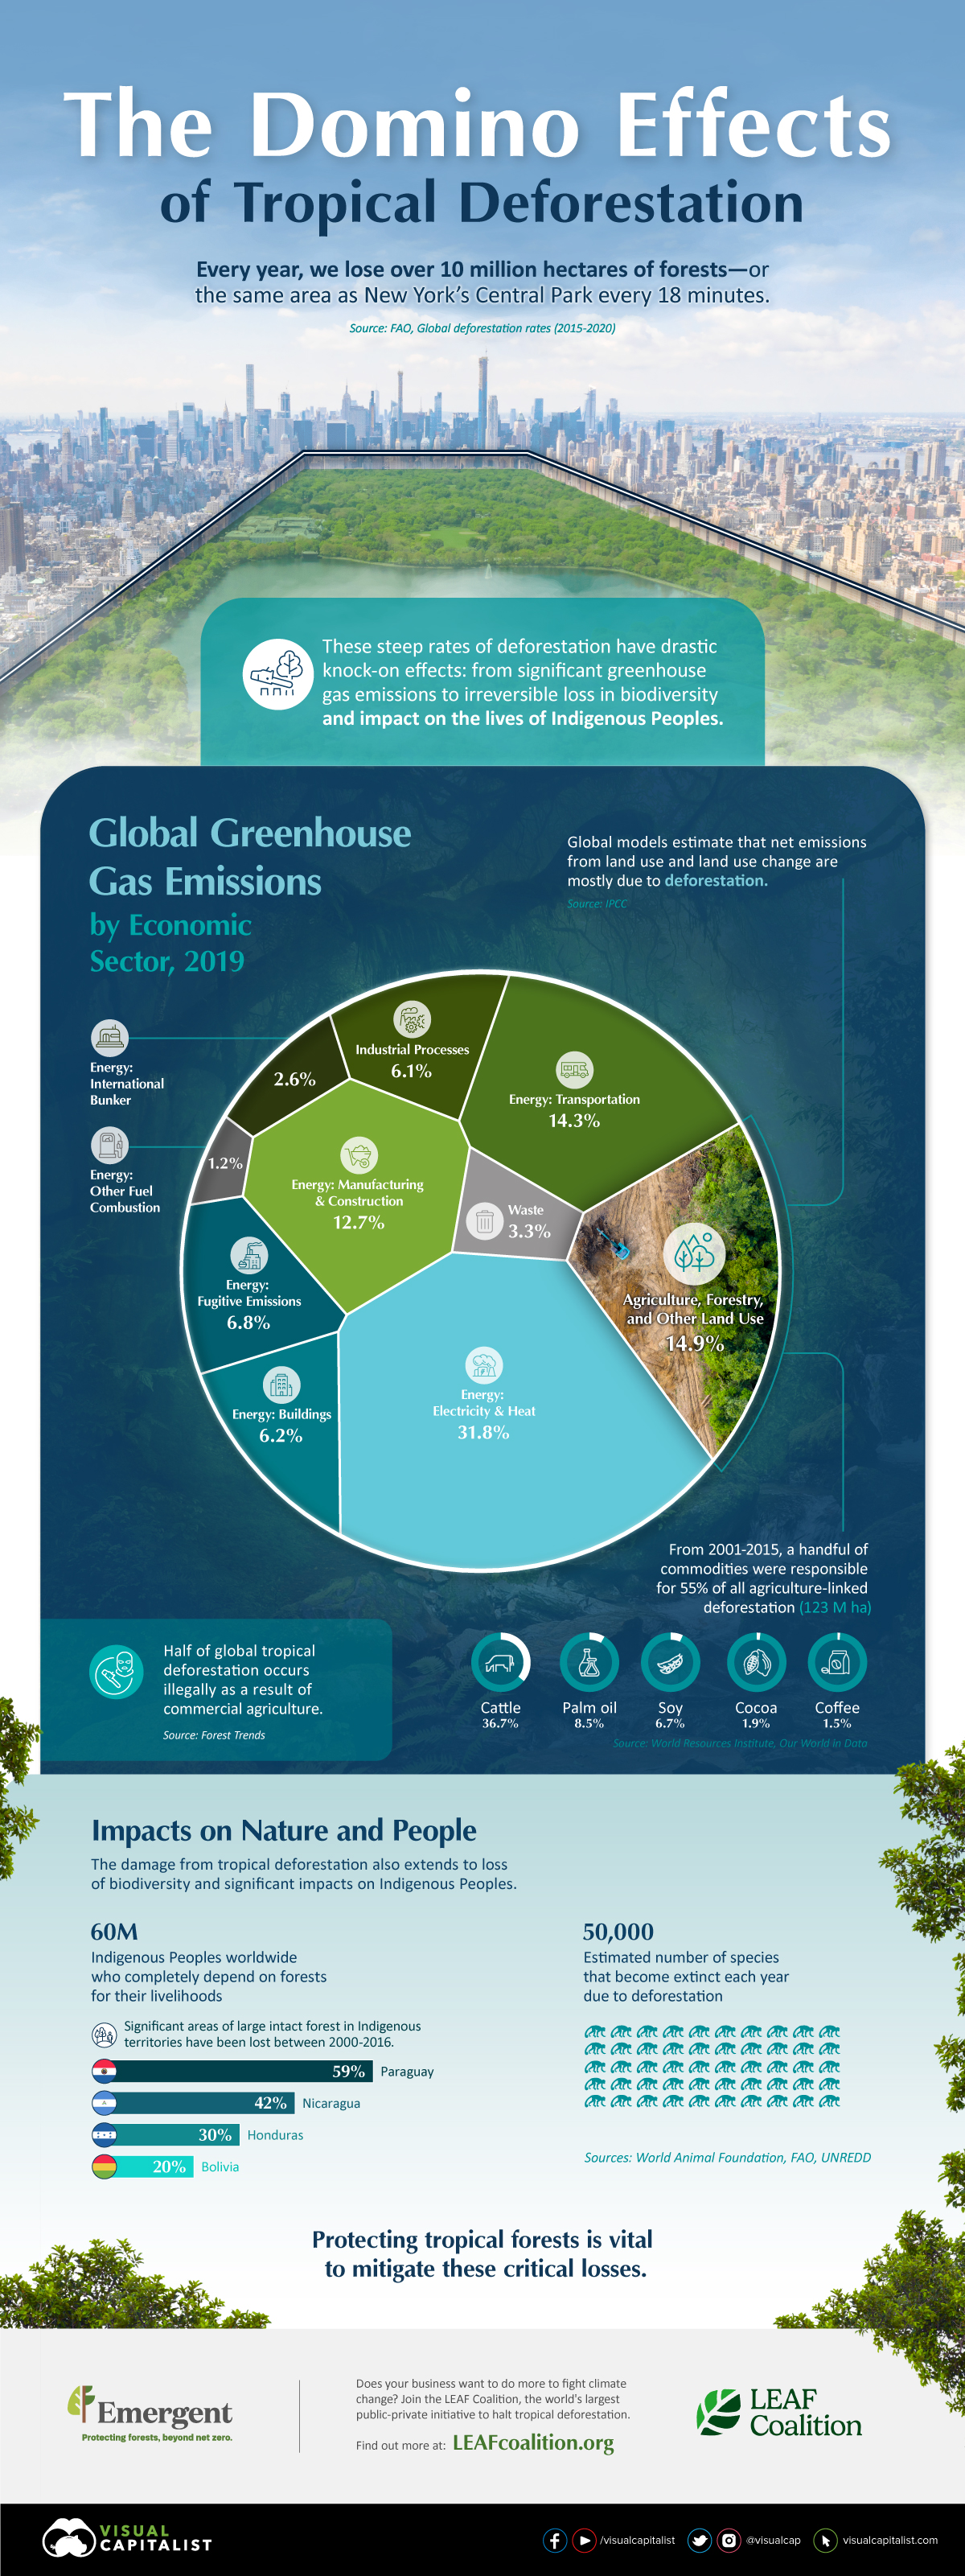
According to the Food and Agriculture Organization of the United Nations (FAO), we lose over 10 million hectares of forests every single year. That’s the same as losing an area the size of New York’s Central Park every 18 minutes.
In this graphic from our sponsor LEAF Coalition, we take a look at the drastic knock-on effects of tropical deforestation: from significant greenhouse gas emissions and irreversible loss in biodiversity to the impact on the lives of Indigenous Peoples.
Global Greenhouse Gas Emissions by Economic Sector
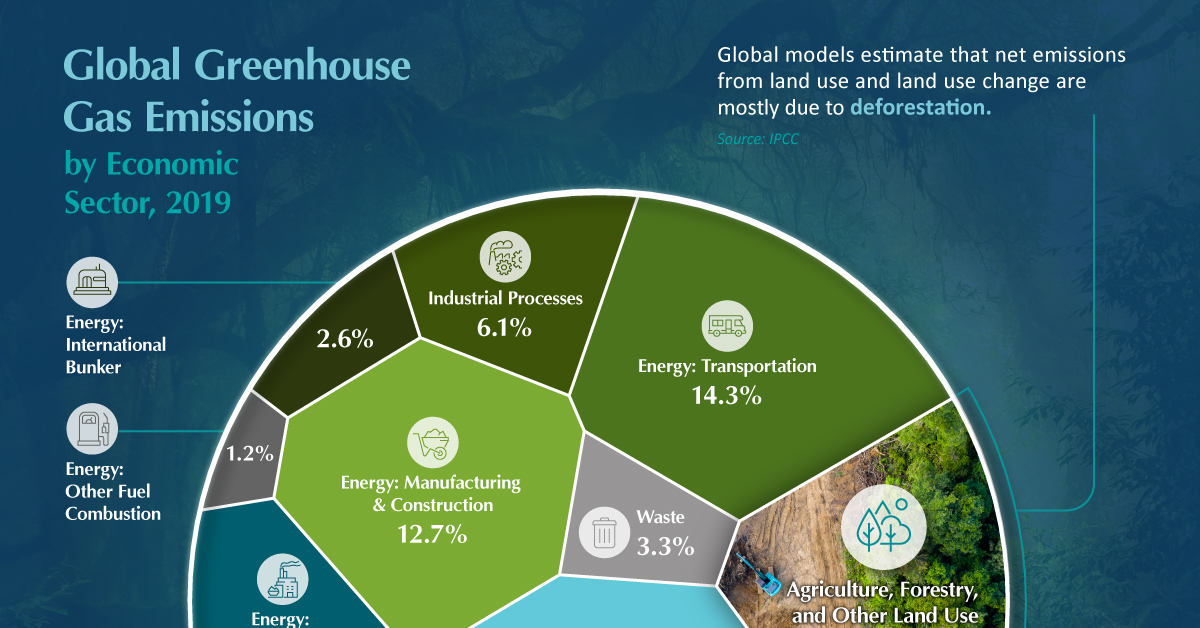
When looking at how greenhouse gas emissions break down by sector, the agriculture, forestry, and other land use (AFOLU) sector is responsible for nearly 15% of global emissions.
Moreover, global models estimate that net emissions from land use and land use change are mostly as a result of deforestation.
| Sector | % of Global Greenhouse Gas Emissions, 2019 |
|---|---|
| Energy: Electricity & Heat | 31.8% |
| Agriculture, Forestry, & Other Land Use | 14.9% |
| Energy: Transport | 14.3% |
| Energy: Manufacturing & Construction | 12.7% |
| Energy: Fugitive Emissions | 6.8% |
| Energy: Buildings | 6.2% |
| Industrial Processes | 6.1% |
| Energy: International Bunker | 2.6% |
| Energy: Other Fuel Combustion | 1.2% |
From 2002-2015, a handful of commodities were responsible for 55% of all agriculture-linked deforestation. These include:
- Cattle: 36.7%
- Palm oil: 8.5%
- Soy: 6.7%
- Cocoa: 1.9%
- Coffee: 1.5%
And according to Forest Trends, half of global tropical deforestation occurs illegally as a result of this demand.
Impacts on Nature and People
The damage from tropical deforestation also extends to loss of biodiversity which has significant impacts on Indigenous Peoples and the animal population.
- 50,000: Estimated number of species that become extinct each year due to deforestation.
- 60M: Indigenous Peoples worldwide who completely depend on forests for their livelihoods.
Protecting tropical forests is vital to mitigate these critical losses. Does your business want to do more to fight climate change?
Join the LEAF Coalition, the world’s largest public-private initiative to halt tropical deforestation.

-

 Green1 week ago
Ranking the Top 15 Countries by Carbon Tax Revenue
This graphic highlights France and Canada as the global leaders when it comes to generating carbon tax revenue.
-

 Green2 weeks ago
Ranked: The Countries With the Most Air Pollution in 2023
South Asian nations are the global hotspot for pollution. In this graphic, we rank the world’s most polluted countries according to IQAir.
-

 Environment2 weeks ago
Top Countries By Forest Growth Since 2001
One country is taking reforestation very seriously, registering more than 400,000 square km of forest growth in two decades.
-

 Green3 weeks ago
Ranked: Top Countries by Total Forest Loss Since 2001
The country with the most forest loss since 2001 lost as much forest cover as the next four countries combined.
-

 Markets2 months ago
The World’s Top Cocoa Producing Countries
Here are the largest cocoa producing countries globally—from Côte d’Ivoire to Brazil—as cocoa prices hit record highs.
-

 Environment2 months ago
Charted: Share of World Forests by Country
We visualize which countries have the biggest share of world forests by area—and while country size plays a factor, so too, does the environment.

