Chart of the Week
30 Cities Best Positioned for Long-Term Success
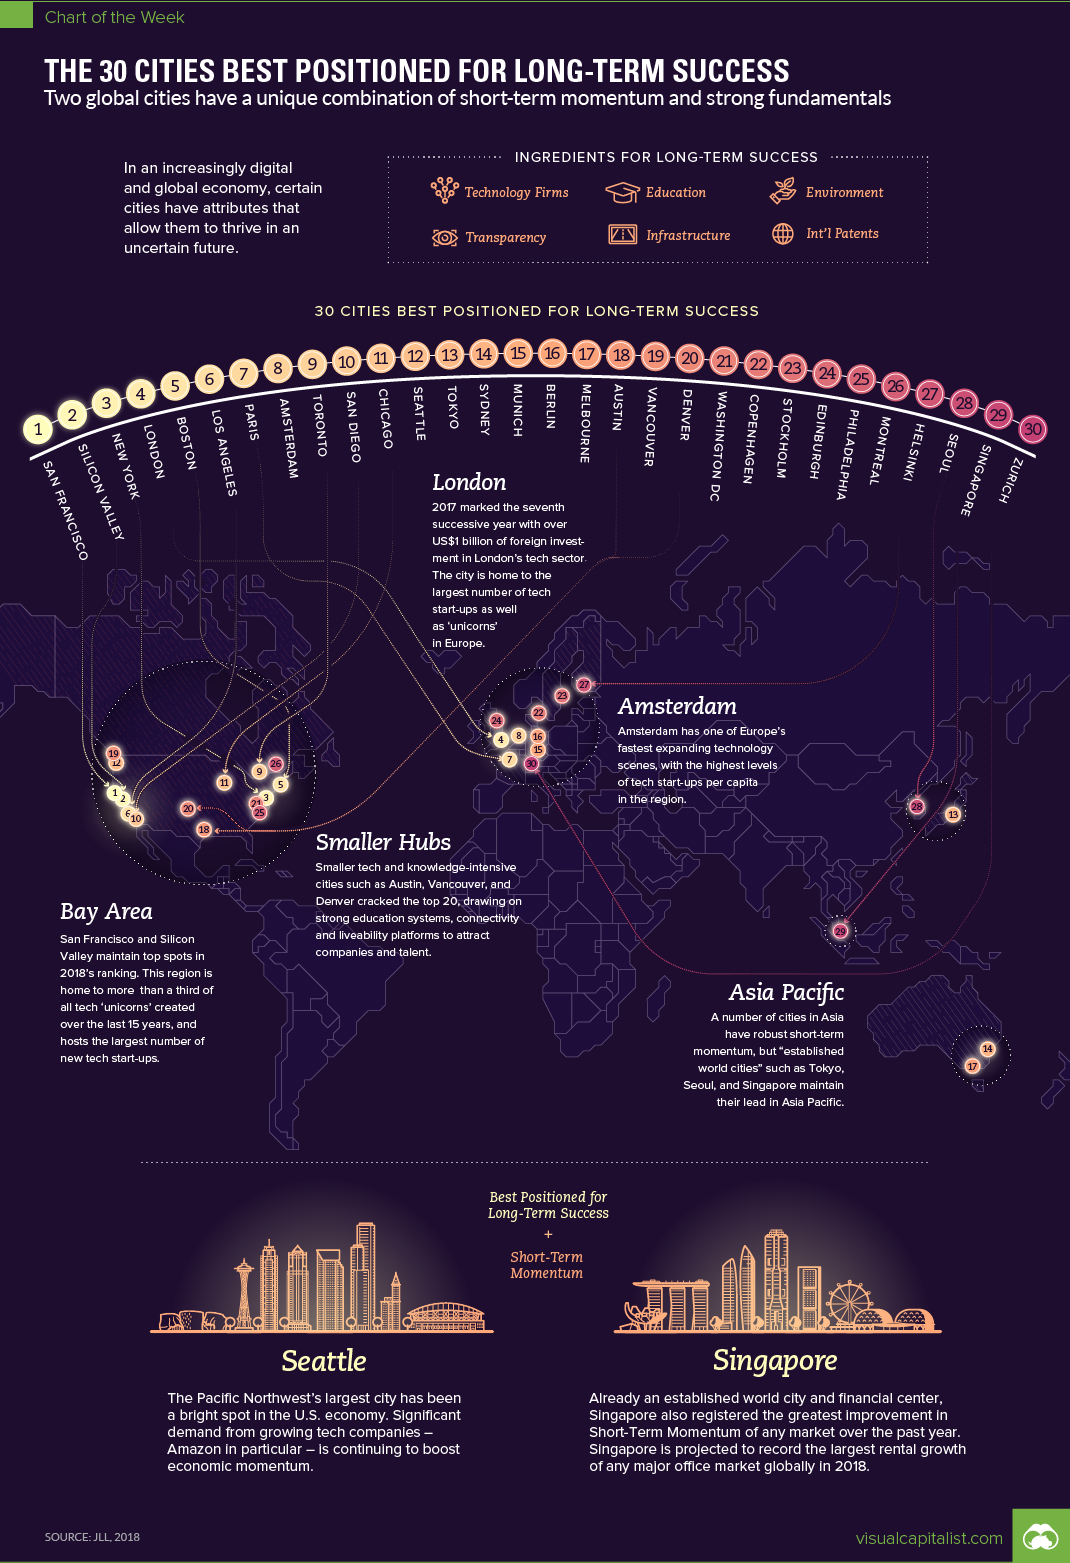
The 30 Cities Best Positioned for Long-Term Success
The Chart of the Week is a weekly Visual Capitalist feature on Fridays.
Combine the rapid rate of technological change with a globalized economy, and it’s evident that our cities are transforming at an unprecedented pace.
But while these fast-moving currents are found in pretty much every urbanized setting, not every city is doing well to navigate them. In an increasingly digital and global economy, cities must be able to attract high-end talent, foster innovation, and maintain competitiveness – and failing to do so can have dire consequences.
Which cities are prepared to adapt, and which will get left behind in the dust?
The City Momentum Index
Today’s chart uses data from the City Momentum Index 2018 in a report produced by JLL.
The index tries to identify the cities that are at the forefront of the innovation economy, by looking at key factors such as the number of tech firms, education, environment, transparency, infrastructure, and international patents.
By investing in and leveraging their strengths in technology, physical and digital connectivity, quality of life and sustainability, [these cities] are positioned to maintain their performance into the future in this new competitive landscape.
The report identified the top 30 cities according to this criteria for long-term success – as well as 30 other cities that are destined to hold their momentum in the short term.
30 Cities Positioned for Success
Here are the cities that top the list in the 2018 edition of the report:
| Rank | City | Country |
|---|---|---|
| #1 | San Francisco | United States |
| #2 | Silicon Valley | United States |
| #3 | New York | United States |
| #4 | London | United Kingdom |
| #5 | Boston | United States |
| #6 | Los Angeles | United States |
| #7 | Paris | France |
| #8 | Amsterdam | Netherlands |
| #9 | Toronto | Canada |
| #10 | San Diego | United States |
| #11 | Chicago | United States |
| #12 | Seattle | United States |
| #13 | Tokyo | Japan |
| #14 | Sydney | Australia |
| #15 | Munich | Germany |
| #16 | Berlin | Germany |
| #17 | Melbourne | Australia |
| #18 | Austin | United States |
| #19 | Vancouver | Canada |
| #20 | Denver | United States |
| #21 | Washington D.C. | United States |
| #22 | Copenhagen | Denmark |
| #23 | Stockholm | Sweden |
| #24 | Edinburgh | United Kingdom |
| #25 | Philadelphia | United States |
| #26 | Montreal | Canada |
| #27 | Helsinki | Finland |
| #28 | Seoul | South Korea |
| #29 | Singapore | Singapore |
| #30 | Zurich | Switzerland |
The United States is represented by 12 cities, while the European continent holds 10. Meanwhile, Canada and Australia are home to five cities between them.
Interestingly, no cities from China, Latin America, Africa, or the Middle East make this first list.
30 Cities With Short-Term Momentum
The report also touches on short-term momentum, which JLL defines as the cities with urban economies and real estate markets currently undergoing the most rapid growth.
This resulting list is almost mutually exclusive with the one above, mainly because of the explosive growth happening right now in Chinese cities as well as in India and the Asia-Pacific.
| Rank | City | Country |
|---|---|---|
| #1 | Hyderabad | India |
| #2 | Bangalore | India |
| #3 | Ho Chi Minh City | Vietnam |
| #4 | Pune | India |
| #5 | Kolkata | India |
| #6 | Hanoi | Vietnam |
| #7 | Nanjing | China |
| #8 | Delhi | India |
| #9 | Hangzhou | China |
| #10 | Xian | China |
| #11 | Nairobi | Kenya |
| #12 | Chongqing | China |
| #13 | Wuhan | China |
| #14 | Chennai | India |
| #15 | Shanghai | China |
| #16 | Guangzhou | China |
| #17 | Tianjin | China |
| #18 | Manila | Philippines |
| #19 | Shenzhen | China |
| #20 | Mumbai | India |
| #21 | Chengdu | China |
| #22 | Beijing | China |
| #23 | Jakarta | Indonesia |
| #24 | Kuala Lumpur | Malaysia |
| #25 | Lagos | Nigeria |
| #26 | Singapore | Singapore |
| #27 | Dubai | U.A.E. |
| #28 | Bangkok | Thailand |
| #29 | Seattle | United States |
| #30 | Bucharest | Romania |
On the short-term momentum side of the equation, we have 11 Chinese cities, seven from India, and only one located in the Western hemisphere (Seattle).
It’s worth noting that only two cities made both lists for short-term and long-term momentum: Seattle and Singapore.
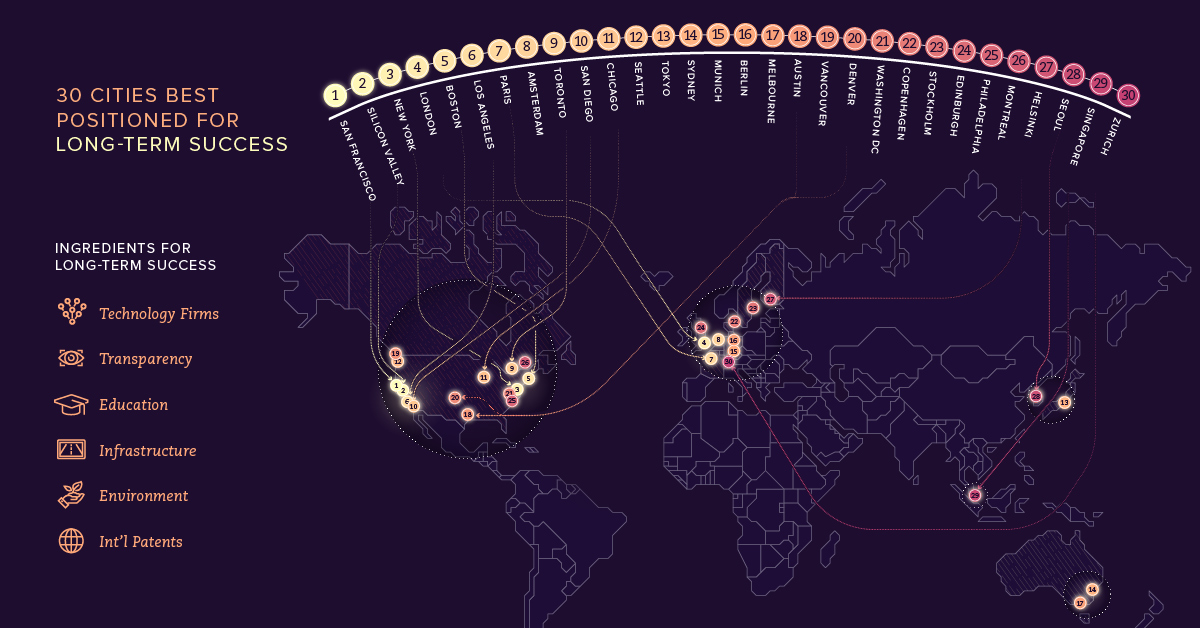


Chart of the Week
The Road to Recovery: Which Economies are Reopening?
We look at mobility rates as well as COVID-19 recovery rates for 41 economies, to see which countries are reopening for business.

The Road to Recovery: Which Economies are Reopening?
COVID-19 has brought the world to a halt—but after months of uncertainty, it seems that the situation is slowly taking a turn for the better.
Today’s chart measures the extent to which 41 major economies are reopening, by plotting two metrics for each country: the mobility rate and the COVID-19 recovery rate:
- Mobility Index
This refers to the change in activity around workplaces, subtracting activity around residences, measured as a percentage deviation from the baseline. - COVID-19 Recovery Rate
The number of recovered cases in a country is measured as the percentage of total cases.
Data for the first measure comes from Google’s COVID-19 Community Mobility Reports, which relies on aggregated, anonymous location history data from individuals. Note that China does not show up in the graphic as the government bans Google services.
COVID-19 recovery rates rely on values from CoronaTracker, using aggregated information from multiple global and governmental databases such as WHO and CDC.
Reopening Economies, One Step at a Time
In general, the higher the mobility rate, the more economic activity this signifies. In most cases, mobility rate also correlates with a higher rate of recovered people in the population.
Here’s how these countries fare based on the above metrics.
| Country | Mobility Rate | Recovery Rate | Total Cases | Total Recovered |
|---|---|---|---|---|
| Argentina | -56% | 31.40% | 14,702 | 4,617 |
| Australia | -41% | 92.03% | 7,150 | 6,580 |
| Austria | -100% | 91.93% | 16,628 | 15,286 |
| Belgium | -105% | 26.92% | 57,849 | 15,572 |
| Brazil | -48% | 44.02% | 438,812 | 193,181 |
| Canada | -67% | 52.91% | 88,512 | 46,831 |
| Chile | -110% | 41.58% | 86,943 | 36,150 |
| Colombia | -73% | 26.28% | 25,366 | 6,665 |
| Czechia | -29% | 70.68% | 9,140 | 6,460 |
| Denmark | -93% | 88.43% | 11,512 | 10,180 |
| Finland | -93% | 81.57% | 6,743 | 5,500 |
| France | -100% | 36.08% | 186,238 | 67,191 |
| Germany | -99% | 89.45% | 182,452 | 163,200 |
| Greece | -32% | 47.28% | 2,906 | 1,374 |
| Hong Kong | -10% | 97.00% | 1,067 | 1,035 |
| Hungary | -49% | 52.31% | 3,816 | 1,996 |
| India | -65% | 42.88% | 165,386 | 70,920 |
| Indonesia | -77% | 25.43% | 24,538 | 6,240 |
| Ireland | -79% | 88.92% | 24,841 | 22,089 |
| Israel | -31% | 87.00% | 16,872 | 14,679 |
| Italy | -52% | 64.99% | 231,732 | 150,604 |
| Japan | -33% | 84.80% | 16,683 | 14,147 |
| Malaysia | -53% | 80.86% | 7,629 | 6,169 |
| Mexico | -69% | 69.70% | 78,023 | 54,383 |
| Netherlands | -97% | 0.01% | 45,950 | 3 |
| New Zealand | -21% | 98.01% | 1,504 | 1,474 |
| Norway | -100% | 91.87% | 8,411 | 7,727 |
| Philippines | -87% | 23.08% | 15,588 | 3,598 |
| Poland | -36% | 46.27% | 22,825 | 10,560 |
| Portugal | -65% | 58.99% | 31,596 | 18,637 |
| Singapore | -105% | 55.02% | 33,249 | 18,294 |
| South Africa | -74% | 52.44% | 27,403 | 14,370 |
| South Korea | -4% | 91.15% | 11,344 | 10,340 |
| Spain | -67% | 69.11% | 284,986 | 196,958 |
| Sweden | -93% | 13.91% | 35,727 | 4,971 |
| Switzerland | -101% | 91.90% | 30,796 | 28,300 |
| Taiwan | 4% | 95.24% | 441 | 420 |
| Thailand | -36% | 96.08% | 3,065 | 2,945 |
| U.S. | -56% | 28.20% | 1,768,346 | 498,720 |
| United Kingdom | -82% | 0.05% | 269,127 | 135 |
| Vietnam | 15% | 85.02% | 327 | 278 |
Mobility data as of May 21, 2020 (Latest available). COVID-19 case data as of May 29, 2020.
In the main scatterplot visualization, we’ve taken things a step further, assigning these countries into four distinct quadrants:
1. High Mobility, High Recovery
High recovery rates are resulting in lifted restrictions for countries in this quadrant, and people are steadily returning to work.
New Zealand has earned praise for its early and effective pandemic response, allowing it to curtail the total number of cases. This has resulted in a 98% recovery rate, the highest of all countries. After almost 50 days of lockdown, the government is recommending a flexible four-day work week to boost the economy back up.
2. High Mobility, Low Recovery
Despite low COVID-19 related recoveries, mobility rates of countries in this quadrant remain higher than average. Some countries have loosened lockdown measures, while others did not have strict measures in place to begin with.
Brazil is an interesting case study to consider here. After deferring lockdown decisions to state and local levels, the country is now averaging the highest number of daily cases out of any country. On May 28th, for example, the country had 24,151 new cases and 1,067 new deaths.
3. Low Mobility, High Recovery
Countries in this quadrant are playing it safe, and holding off on reopening their economies until the population has fully recovered.
Italy, the once-epicenter for the crisis in Europe is understandably wary of cases rising back up to critical levels. As a result, it has opted to keep its activity to a minimum to try and boost the 65% recovery rate, even as it slowly emerges from over 10 weeks of lockdown.
4. Low Mobility, Low Recovery
Last but not least, people in these countries are cautiously remaining indoors as their governments continue to work on crisis response.
With a low 0.05% recovery rate, the United Kingdom has no immediate plans to reopen. A two-week lag time in reporting discharged patients from NHS services may also be contributing to this low number. Although new cases are leveling off, the country has the highest coronavirus-caused death toll across Europe.
The U.S. also sits in this quadrant with over 1.7 million cases and counting. Recently, some states have opted to ease restrictions on social and business activity, which could potentially result in case numbers climbing back up.
Over in Sweden, a controversial herd immunity strategy meant that the country continued business as usual amid the rest of Europe’s heightened regulations. Sweden’s COVID-19 recovery rate sits at only 13.9%, and the country’s -93% mobility rate implies that people have been taking their own precautions.
COVID-19’s Impact on the Future
It’s important to note that a “second wave” of new cases could upend plans to reopen economies. As countries reckon with these competing risks of health and economic activity, there is no clear answer around the right path to take.
COVID-19 is a catalyst for an entirely different future, but interestingly, it’s one that has been in the works for a while.
Without being melodramatic, COVID-19 is like the last nail in the coffin of globalization…The 2008-2009 crisis gave globalization a big hit, as did Brexit, as did the U.S.-China trade war, but COVID is taking it to a new level.
—Carmen Reinhart, incoming Chief Economist for the World Bank
Will there be any chance of returning to “normal” as we know it?

-

 Mining2 weeks ago
Charted: The Value Gap Between the Gold Price and Gold Miners
-

 Real Estate1 week ago
Ranked: The Most Valuable Housing Markets in America
-

 Business1 week ago
Charted: Big Four Market Share by S&P 500 Audits
-

 AI1 week ago
The Stock Performance of U.S. Chipmakers So Far in 2024
-

 Misc1 week ago
Almost Every EV Stock is Down After Q1 2024
-

 Money2 weeks ago
Where Does One U.S. Tax Dollar Go?
-

 Green2 weeks ago
Ranked: Top Countries by Total Forest Loss Since 2001
-

 Real Estate2 weeks ago
Visualizing America’s Shortage of Affordable Homes