Agriculture
Ranked: Number of Agricultural Workers by Country
Article/Editing:
Ranked: Number of Agricultural Workers by Country
Agriculture has long been the backbone of human civilization, providing sustenance and livelihood to billions of people across the globe.
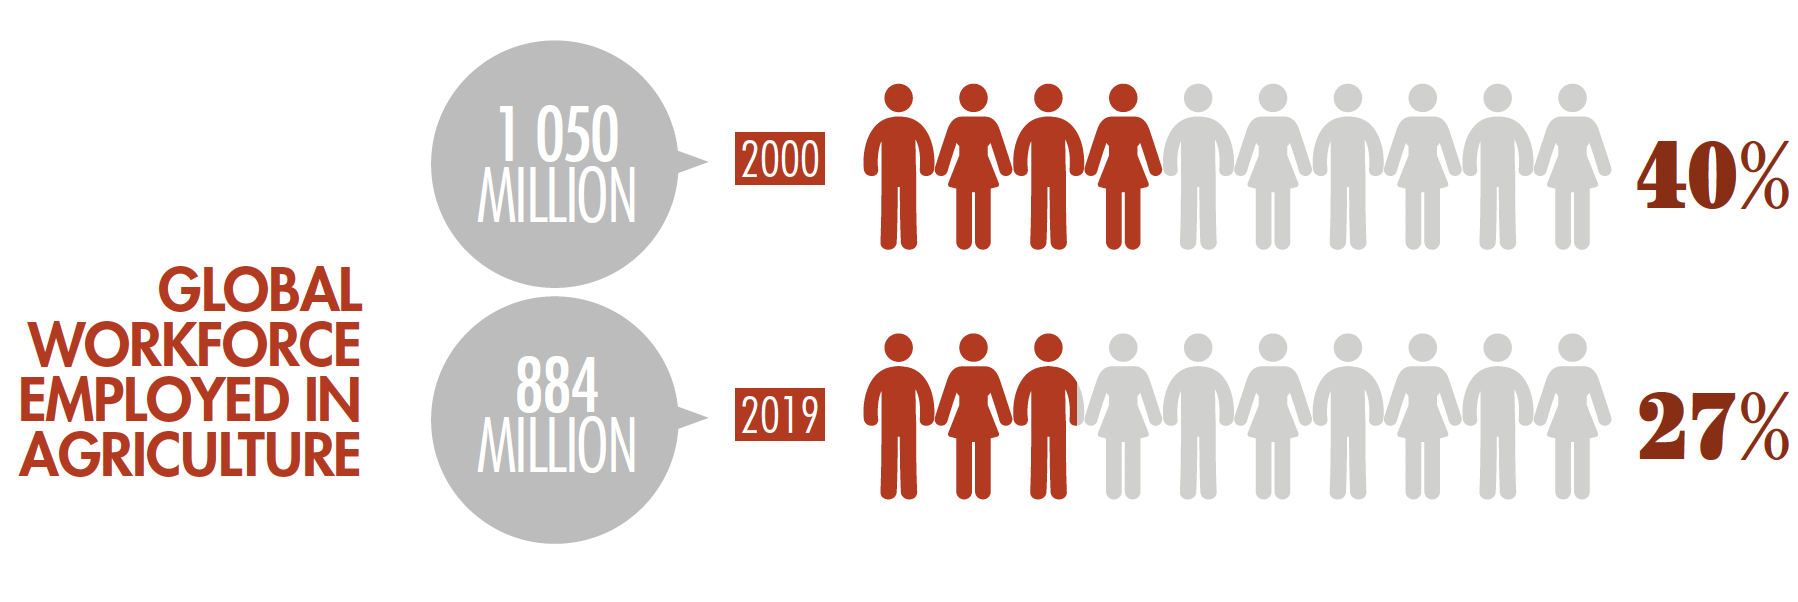
As of 2021, an estimated 27% of the global workforce was employed in agriculture, though the sector represents only 4% of global GDP.
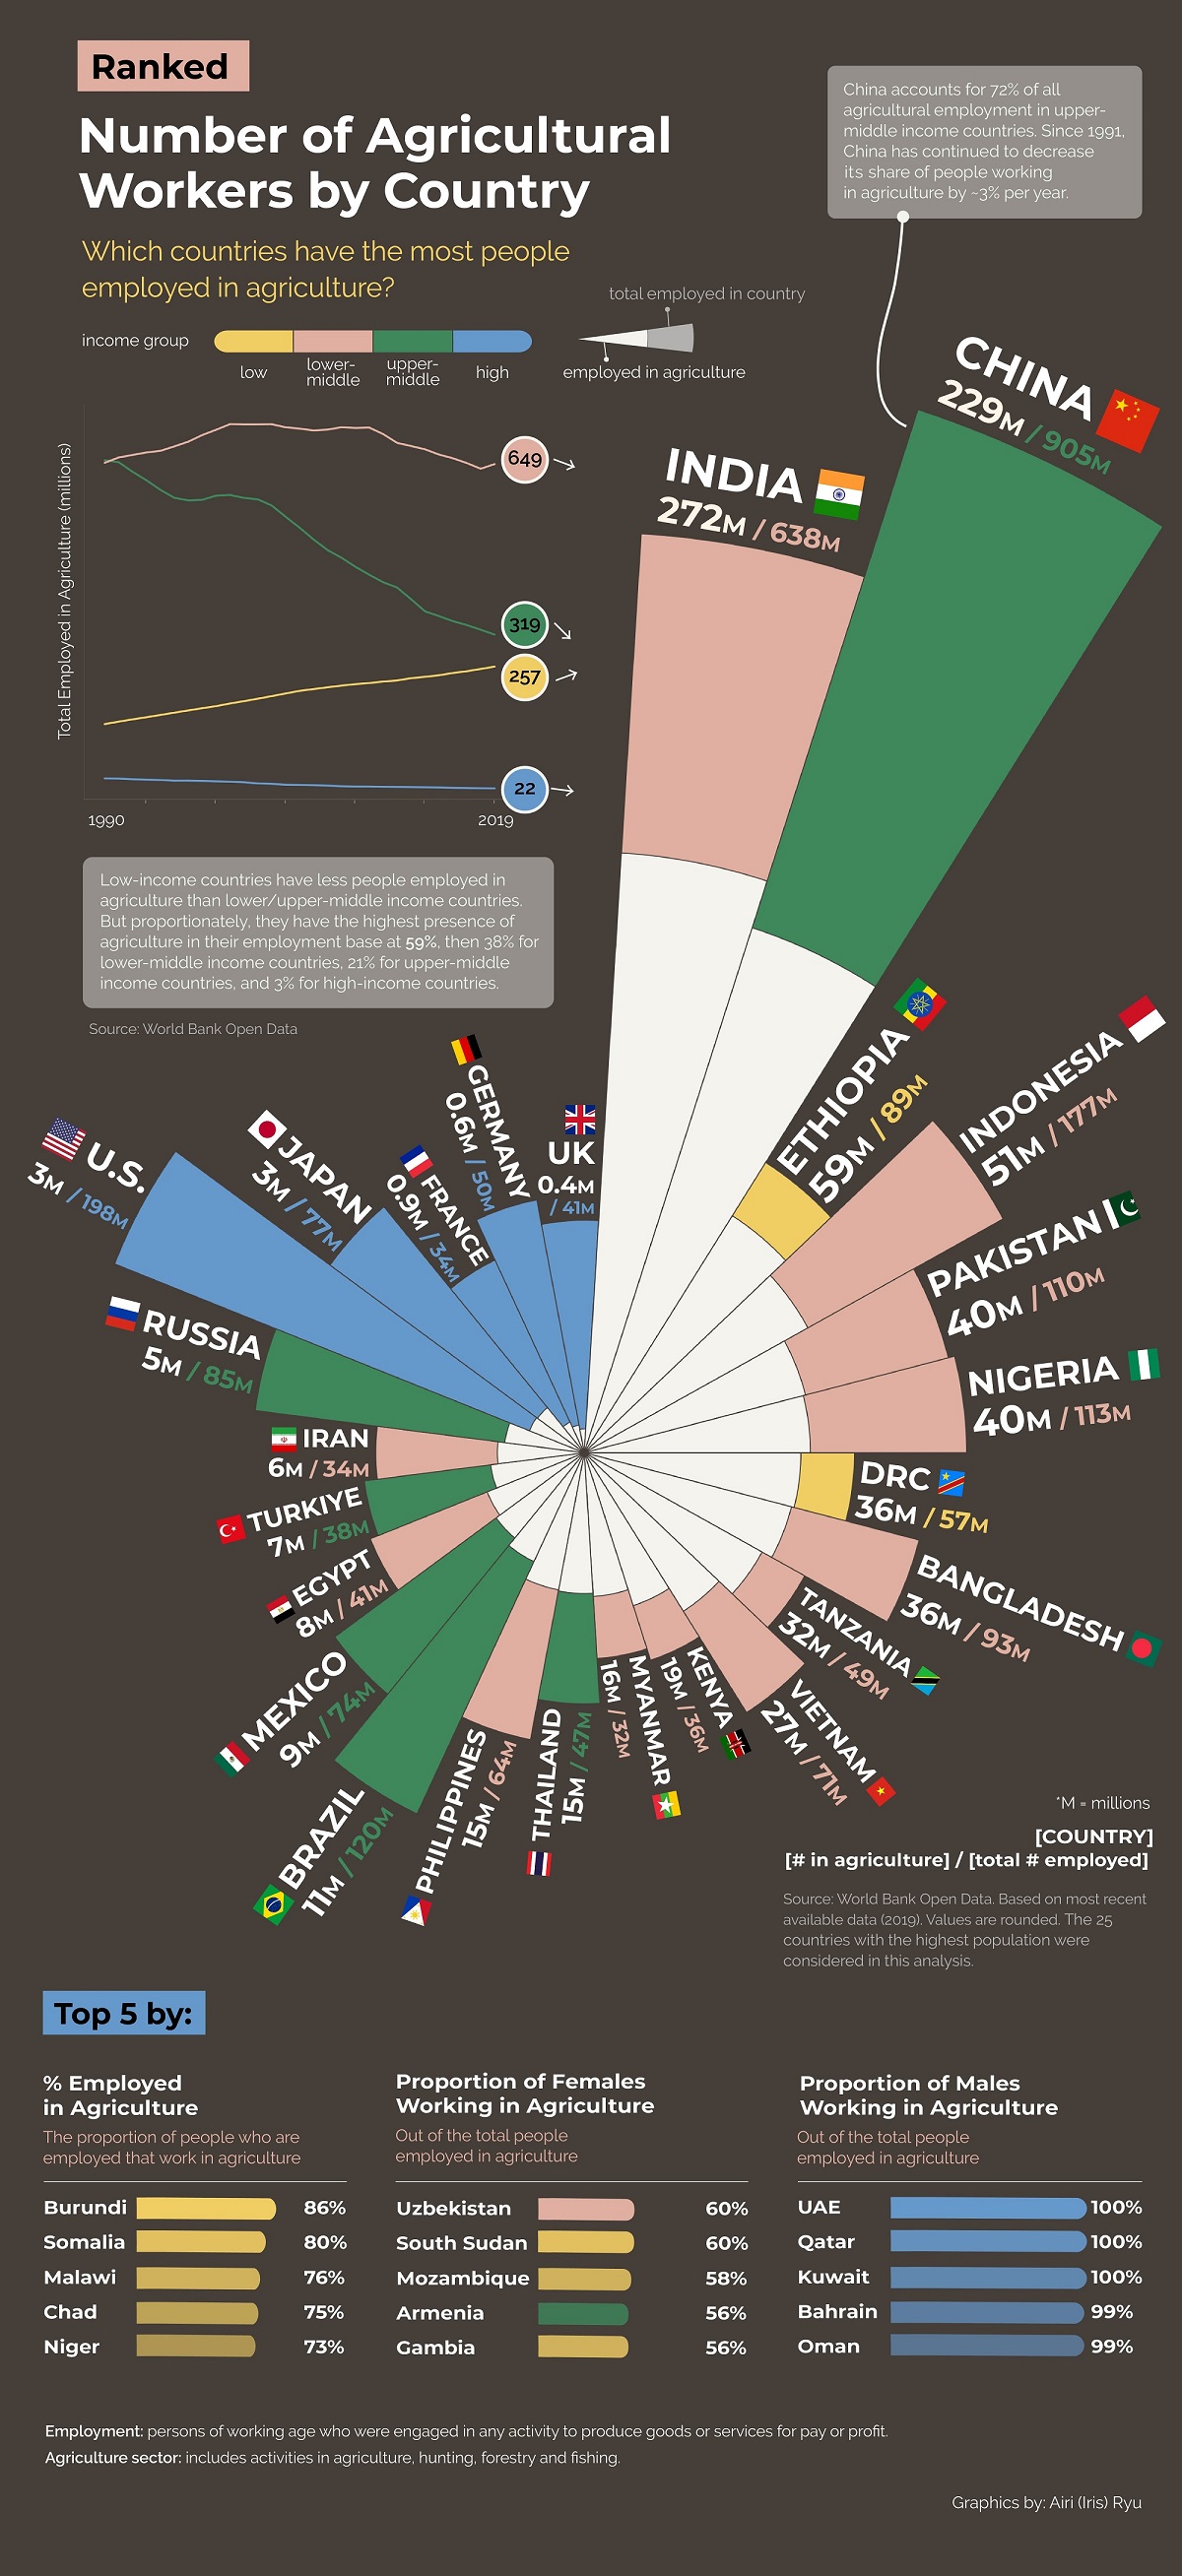
The graphic above uses 2019 employment and population data from the World Bank to rank the distribution of agricultural workers in the world’s most populated countries.
Asia and Africa Have the Most Agricultural Workers
Being the most populous countries, India and China lead the ranking with 272 million and 229 million people employed in agriculture, respectively:
| Rank | Country | Agricultural Workers (2019) | % of Total Workers |
|---|---|---|---|
| 1 | 🇮🇳 India | 272M | 43% |
| 2 | 🇨🇳 China | 229M | 25% |
| 3 | 🇪🇹 Ethiopia | 59M | 66% |
| 4 | 🇮🇩 Indonesia | 51M | 29% |
| 5 | 🇵🇰 Pakistan | 40M | 36% |
| 6 | 🇳🇬 Nigeria | 40M | 35% |
| 7 | 🇨🇩 DRC | 36M | 63% |
| 8 | 🇧🇩 Bangladesh | 36M | 39% |
| 9 | 🇹🇿 Tanzania | 32M | 65% |
| 10 | 🇻🇳 Vietnam | 27M | 38% |
| 11 | 🇰🇪 Kenya | 19M | 53% |
| 12 | 🇲🇲 Myanmar | 16M | 50% |
| 13 | 🇹🇭 Thailand | 15M | 32% |
| 14 | 🇵🇭 Philippines | 15M | 23% |
| 15 | 🇧🇷 Brazil | 11M | 9% |
| 16 | 🇲🇽 Mexico | 9M | 12% |
| 17 | 🇪🇬 Egypt | 8M | 20% |
| 18 | 🇹🇷 Türkiye | 7M | 18% |
| 19 | 🇮🇷 Iran | 6M | 18% |
| 20 | 🇷🇺 Russia | 5M | 6% |
| 21 | 🇺🇸 U.S. | 3M | 2% |
| 22 | 🇯🇵 Japan | 3M | 4% |
| 23 | 🇫🇷 France | 0.9M | 3% |
| 24 | 🇩🇪 Germany | 0.6M | 1% |
| 25 | 🇬🇧 UK | 0.4M | 1% |
Though countries in Africa have fewer agricultural workers, they have a far greater share of agriculture in employment. Ethiopia (66%) and Tanzania (65%) had the highest share of agricultural workers amongst the most populated countries, with other low income and lower-middle income African countries close behind.
In fact, McKinsey estimates that more than 60% of sub-Saharan Africa’s entire population consists of smallholder farmers, with about 23% of sub-Saharan Africa’s GDP coming directly from agriculture.
In contrast, agriculture represents significantly less employment in high-income countries. The U.S. and Japan both have an estimated 3 million agricultural workers, accounting for only 3% and 4% of the total employed population, respectively.
In terms of gender balance, women on average represent 37% of all agricultural workers, with a majority share in just 20 countries within Africa and Asia.
Evolution of Agricultural Jobs Over Time
Over the past century, agricultural workers have declined in number due to technological advances, urban migration, land use changes, and economic diversification.
Source: FAO
However, they still represent a quarter of the global workforce and even with the modernization of agriculture, workers are still necessary to meet a growing demand.
For instance, a study in Bioscience has suggested that agricultural production will need to increase by at least 25% to meet the food demands of the world’s population by 2050.

This article was published as a part of Visual Capitalist's Creator Program, which features data-driven visuals from some of our favorite Creators around the world.


Agriculture
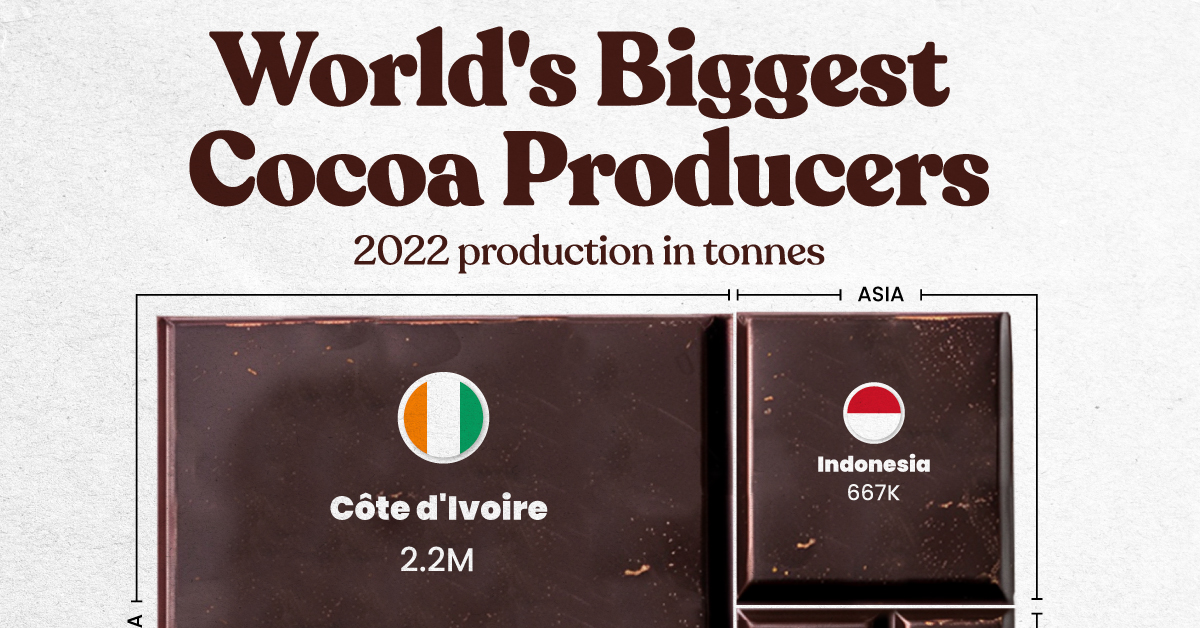
The World’s Top Cocoa Producing Countries
Here are the largest cocoa producing countries globally—from Côte d’Ivoire to Brazil—as cocoa prices hit record highs.
The World’s Top Cocoa Producing Countries
This was originally posted on our Voronoi app. Download the app for free on iOS or Android and discover incredible data-driven charts from a variety of trusted sources.
West Africa is home to the largest cocoa producing countries worldwide, with 3.9 million tonnes of production in 2022.
In fact, there are about one million farmers in Côte d’Ivoire supplying cocoa to key customers such as Nestlé, Mars, and Hershey. But the massive influence of this industry has led to significant forest loss to plant cocoa trees.
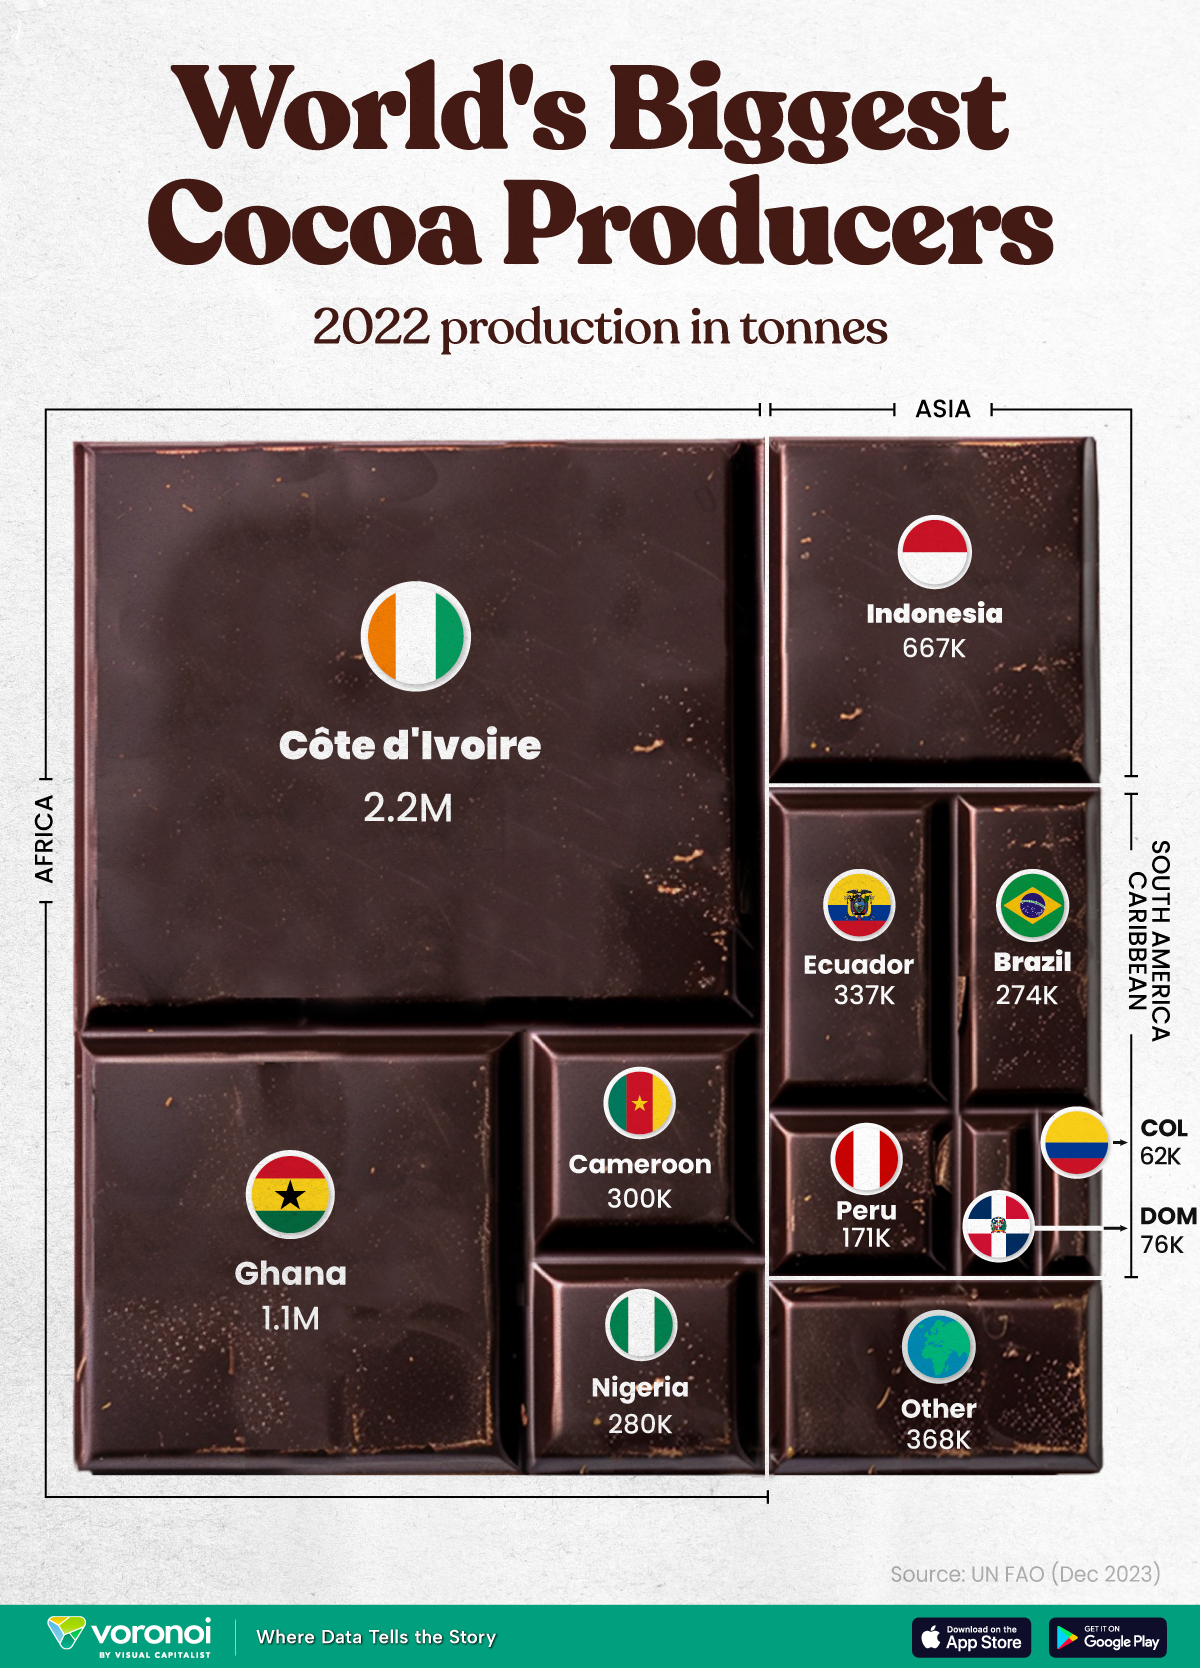
This graphic shows the leading producers of cocoa, based on data from the UN FAO.
Global Hotspots for Cocoa Production
Below, we break down the top cocoa producing countries as of 2022:
| Country | 2022 Production, Tonnes |
|---|---|
| 🇨🇮 Côte d'Ivoire | 2.2M |
| 🇬🇭 Ghana | 1.1M |
| 🇮🇩 Indonesia | 667K |
| 🇪🇨 Ecuador | 337K |
| 🇨🇲 Cameroon | 300K |
| 🇳🇬 Nigeria | 280K |
| 🇧🇷 Brazil | 274K |
| 🇵🇪 Peru | 171K |
| 🇩🇴 Dominican Republic | 76K |
| 🌍 Other | 386K |
With 2.2 million tonnes of cocoa in 2022, Côte d’Ivoire is the world’s largest producer, accounting for a third of the global total.
For many reasons, the cocoa trade in Côte d’Ivoire and Western Africa has been controversial. Often, farmers make about 5% of the retail price of a chocolate bar, and earn $1.20 each day. Adding to this, roughly a third of cocoa farms operate on forests that are meant to be protected.
As the third largest producer, Indonesia produced 667,000 tonnes of cocoa with the U.S., Malaysia, and Singapore as major importers. Overall, small-scale farmers produce 95% of cocoa in the country, but face several challenges such as low pay and unwanted impacts from climate change. Alongside aging trees in the country, these setbacks have led productivity to decline.
In South America, major producers include Ecuador and Brazil. In the early 1900s, Ecuador was the world’s largest cocoa producing country, however shifts in the global marketplace and crop disease led its position to fall. Today, the country is most known for its high-grade single-origin chocolate, with farms seen across the Amazon rainforest.
Altogether, global cocoa production reached 6.5 million tonnes, supported by strong demand. On average, the market has grown 3% annually over the last several decades.

-

 Mining6 days ago
Visualizing Global Gold Production in 2023
-

 AI2 weeks ago
Visualizing AI Patents by Country
-

 Markets2 weeks ago
Economic Growth Forecasts for G7 and BRICS Countries in 2024
-

 Wealth2 weeks ago
Charted: Which City Has the Most Billionaires in 2024?
-

 Technology2 weeks ago
All of the Grants Given by the U.S. CHIPS Act
-

 Green1 week ago
The Carbon Footprint of Major Travel Methods
-

 United States1 week ago
Visualizing the Most Common Pets in the U.S.
-

 Culture1 week ago
The World’s Top Media Franchises by All-Time Revenue