Energy
Ranked: The Top 10 Countries by Energy Transition Investment
![]() Subscribe to the Elements free mailing list for more like this
Subscribe to the Elements free mailing list for more like this
Ranked: The Top 10 Countries by Energy Transition Investment
This was originally posted on Elements. Sign up to the free mailing list to get beautiful visualizations on natural resource megatrends in your email every week.
More than 130 countries have set or are considering a goal of net-zero emissions by 2050.
Achieving net-zero on a global scale, however, requires $125 trillion in climate investment by 2050, according to research commissioned by the United Nations Framework Convention on Climate Change (UNFCCC).
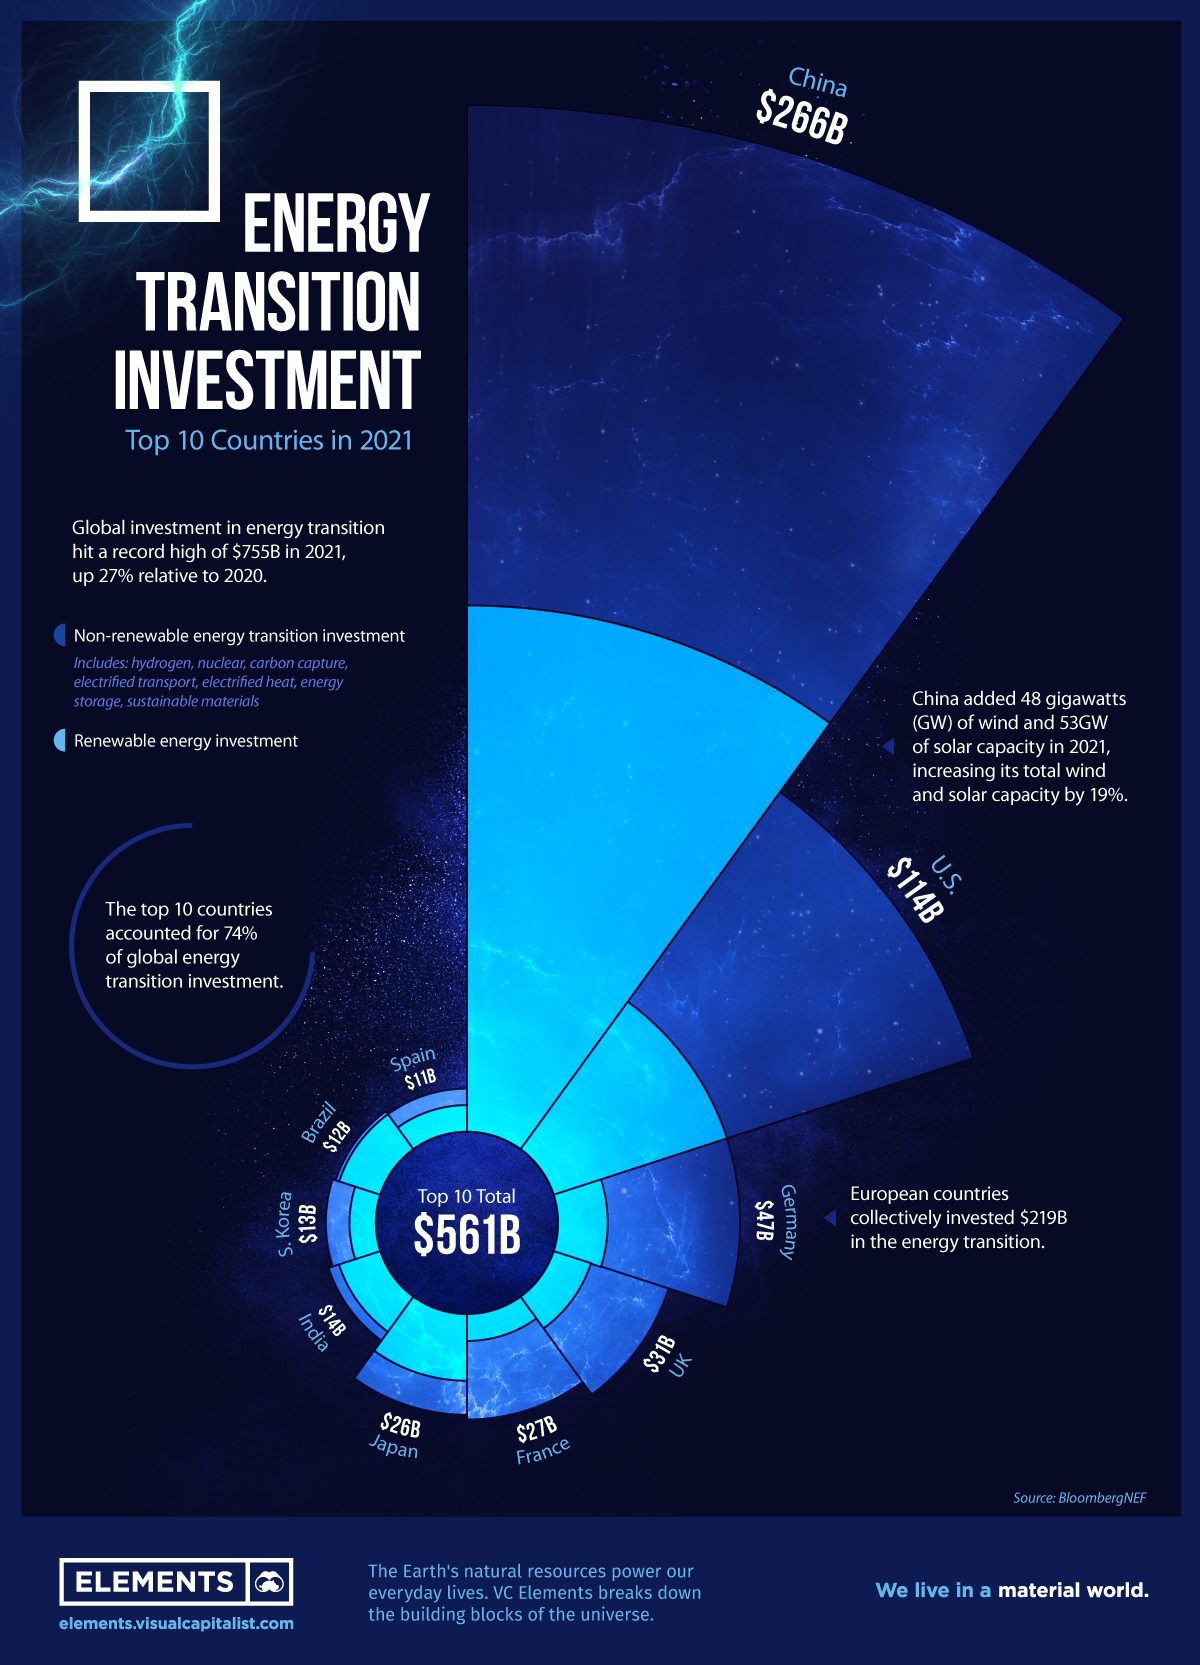
While that level of investment hasn’t been achieved yet, it’s ramping up. In 2021, the world spent $755 billion on deploying low-carbon energy technologies, up 27% from the year prior.
This graphic highlights the top 10 countries by low-carbon energy investment in 2021 using data from BloombergNEF.
Energy Transition Investment by Country
The top 10 countries together invested $561 billion in the energy transition, nearly three-fourths of the world total.
| Country | 2021 Energy Transition Investment (US$) | % of World Total |
|---|---|---|
| China 🇨🇳 | $266B | 35.2% |
| U.S. 🇺🇸 | $114B | 15.1% |
| Germany 🇩🇪 | $47B | 6.2% |
| U.K. 🇬🇧 | $31B | 4.1% |
| France 🇫🇷 | $27B | 3.6% |
| Japan 🇯🇵 | $26B | 3.4% |
| India 🇮🇳 | $14B | 1.9% |
| South Korea 🇰🇷 | $13B | 1.7% |
| Brazil 🇧🇷 | $12B | 1.6% |
| Spain 🇪🇸 | $11B | 1.5% |
| Total | $561B | 74.3% |
China increased its overall energy transition investment by 60% from 2020 levels, further cementing its position as a global leader. The country’s wind and solar capacity increased by 19% in 2021, with electrified transport also accounting for a large portion of the investment.
Next, the U.S. invested $114 billion in clean energy last year, up 17% from 2020. Several European countries also made the top 10 list, with Germany, U.K., and France rounding out the top five. In total, European countries invested $219 billion in the energy transition.
Which Low-Carbon Technologies are Attracting Investment?
While the top 10 countries provide an overview of where investments are being made, it’s also interesting to see which sectors are seeing the biggest influxes of capital.
Here’s a breakdown of energy transition investment by sector in 2021:
| Technology/Sector | Total Investment in 2021 (US$) | % change from 2020 |
|---|---|---|
| Renewable energy | $365.9B | 6.8% |
| Electrified transport | $273.2B | 76.7% |
| Electrified heat | $52.7B | 10.7% |
| Nuclear | $31.5B | 6.1% |
| Sustainable Materials | $19.3B | 141.3% |
| Energy Storage | $7.9B | -6.0% |
| Carbon capture & storage | $2.3B | -23.3% |
| Hydrogen | $2.0B | 33.3% |
| Total | $754.8B | 26.8% |
Renewables accounted for nearly 50% of total investment in 2021. However, electrified transport drove much of the growth as several countries charged ahead in the shift to electric vehicles.
Nuclear power also racked up roughly $32 billion in investments, as conviction grows that it can deliver reliable, carbon-free electricity. But the biggest overall percentage gain was seen in sustainable materials including recycling and bioplastics, which saw investment activity more than double in 2021.
Given that the dawn of clean energy is still in its early hours, technologies in the sector are constantly evolving. As the race to net-zero continues, which energy technologies will draw even more investment in the future?


Energy
Charted: 4 Reasons Why Lithium Could Be the Next Gold Rush
Visual Capitalist has partnered with EnergyX to show why drops in prices and growing demand may make now the right time to invest in lithium.


4 Reasons Why You Should Invest in Lithium
Lithium’s importance in powering EVs makes it a linchpin of the clean energy transition and one of the world’s most precious minerals.
In this graphic, Visual Capitalist partnered with EnergyX to explore why now may be the time to invest in lithium.
1. Lithium Prices Have Dropped
One of the most critical aspects of evaluating an investment is ensuring that the asset’s value is higher than its price would indicate. Lithium is integral to powering EVs, and, prices have fallen fast over the last year:
| Date | LiOH·H₂O* | Li₂CO₃** |
|---|---|---|
| Feb 2023 | $76 | $71 |
| March 2023 | $71 | $61 |
| Apr 2023 | $43 | $33 |
| May 2023 | $43 | $33 |
| June 2023 | $47 | $45 |
| July 2023 | $44 | $40 |
| Aug 2023 | $35 | $35 |
| Sept 2023 | $28 | $27 |
| Oct 2023 | $24 | $23 |
| Nov 2023 | $21 | $21 |
| Dec 2023 | $17 | $16 |
| Jan 2024 | $14 | $15 |
| Feb 2024 | $13 | $14 |
Note: Monthly spot prices were taken as close to the 14th of each month as possible.
*Lithium hydroxide monohydrate MB-LI-0033
**Lithium carbonate MB-LI-0029
2. Lithium-Ion Battery Prices Are Also Falling
The drop in lithium prices is just one reason to invest in the metal. Increasing economies of scale, coupled with low commodity prices, have caused the cost of lithium-ion batteries to drop significantly as well.
In fact, BNEF reports that between 2013 and 2023, the price of a Li-ion battery dropped by 82%.
| Year | Price per KWh |
|---|---|
| 2023 | $139 |
| 2022 | $161 |
| 2021 | $150 |
| 2020 | $160 |
| 2019 | $183 |
| 2018 | $211 |
| 2017 | $258 |
| 2016 | $345 |
| 2015 | $448 |
| 2014 | $692 |
| 2013 | $780 |

3. EV Adoption is Sustainable
One of the best reasons to invest in lithium is that EVs, one of the main drivers behind the demand for lithium, have reached a price point similar to that of traditional vehicle.
According to the Kelly Blue Book, Tesla’s average transaction price dropped by 25% between 2022 and 2023, bringing it in line with many other major manufacturers and showing that EVs are a realistic transport option from a consumer price perspective.
| Manufacturer | September 2022 | September 2023 |
|---|---|---|
| BMW | $69,000 | $72,000 |
| Ford | $54,000 | $56,000 |
| Volkswagon | $54,000 | $56,000 |
| General Motors | $52,000 | $53,000 |
| Tesla | $68,000 | $51,000 |
4. Electricity Demand in Transport is Growing
As EVs become an accessible transport option, there’s an investment opportunity in lithium. But possibly the best reason to invest in lithium is that the IEA reports global demand for the electricity in transport could grow dramatically by 2030:
| Transport Type | 2022 | 2025 | 2030 |
|---|---|---|---|
| Buses 🚌 | 23,000 GWh | 50,000 GWh | 130,000 GWh |
| Cars 🚙 | 65,000 GWh | 200,000 GWh | 570,000 GWh |
| Trucks 🛻 | 4,000 GWh | 15,000 GWh | 94,000 GWh |
| Vans 🚐 | 6,000 GWh | 16,000 GWh | 72,000 GWh |
The Lithium Investment Opportunity
Lithium presents a potentially classic investment opportunity. Lithium and battery prices have dropped significantly, and recently, EVs have reached a price point similar to other vehicles. By 2030, the demand for clean energy, especially in transport, will grow dramatically.
With prices dropping and demand skyrocketing, now is the time to invest in lithium.
EnergyX is poised to exploit lithium demand with cutting-edge lithium extraction technology capable of extracting 300% more lithium than current processes.

-

 Lithium3 days ago
Ranked: The Top 10 EV Battery Manufacturers in 2023
Asia dominates this ranking of the world’s largest EV battery manufacturers in 2023.
-

 Energy1 week ago
The World’s Biggest Nuclear Energy Producers
China has grown its nuclear capacity over the last decade, now ranking second on the list of top nuclear energy producers.
-

 Energy4 weeks ago
The World’s Biggest Oil Producers in 2023
Just three countries accounted for 40% of global oil production last year.
-

 Energy1 month ago
How Much Does the U.S. Depend on Russian Uranium?
Currently, Russia is the largest foreign supplier of nuclear power fuel to the U.S.
-

 Uranium2 months ago
Charted: Global Uranium Reserves, by Country
We visualize the distribution of the world’s uranium reserves by country, with 3 countries accounting for more than half of total reserves.
-

 Energy3 months ago
Visualizing the Rise of the U.S. as Top Crude Oil Producer
Over the last decade, the United States has established itself as the world’s top producer of crude oil, surpassing Saudi Arabia and Russia.

-

 Mining1 week ago
Gold vs. S&P 500: Which Has Grown More Over Five Years?
-

 Markets2 weeks ago
Ranked: The Most Valuable Housing Markets in America
-

 Money2 weeks ago
Which States Have the Highest Minimum Wage in America?
-

 AI2 weeks ago
Ranked: Semiconductor Companies by Industry Revenue Share
-

 Markets2 weeks ago
Ranked: The World’s Top Flight Routes, by Revenue
-

 Countries2 weeks ago
Population Projections: The World’s 6 Largest Countries in 2075
-

 Markets2 weeks ago
The Top 10 States by Real GDP Growth in 2023
-

 Demographics2 weeks ago
The Smallest Gender Wage Gaps in OECD Countries