Energy
Charted: $5 Trillion in Fossil Fuel Subsidies
![]() Subscribe to the Elements free mailing list for more like this
Subscribe to the Elements free mailing list for more like this
Charted: $5 Trillion in Fossil Fuel Subsidies (2010-2021)
This was originally posted on Elements. Sign up to the free mailing list to get beautiful visualizations on natural resource megatrends in your email every week.
With energy consumption vital for life and business, governments often look to fossil fuel subsidies to make energy as affordable as possible.
These subsidies artificially reduce the price of fossil fuels and generally take two forms:
- Production subsidies occur when governments provide tax cuts or direct payments that reduce the cost of producing coal, oil, or gas.
- Consumption subsidies cut fuel prices for the end-user through price controls and other such measures.
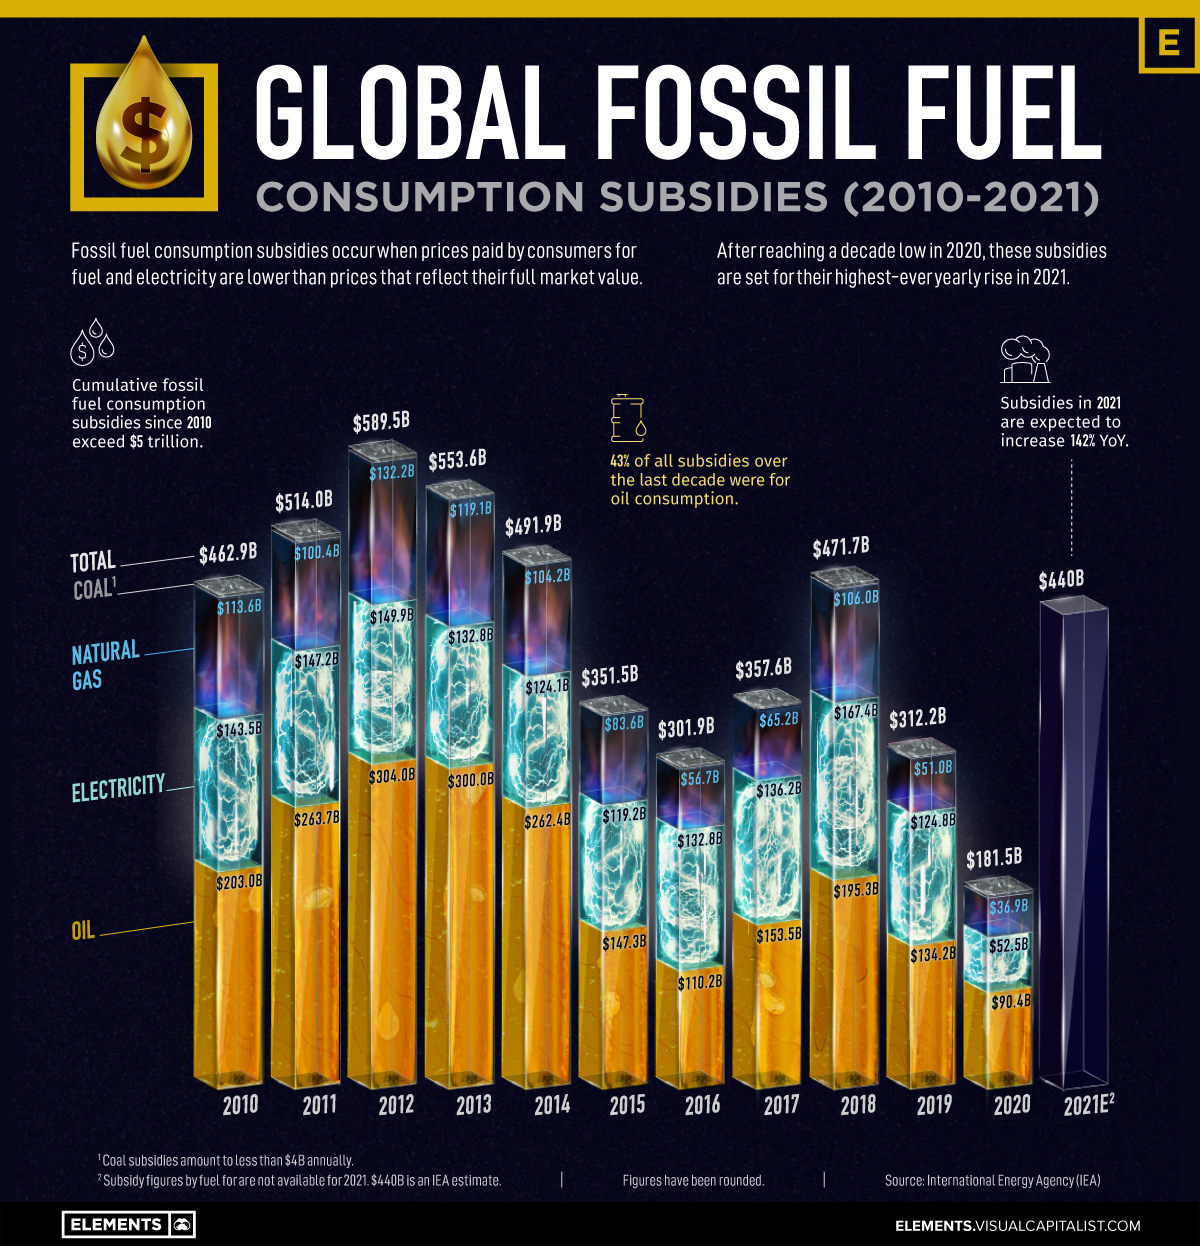
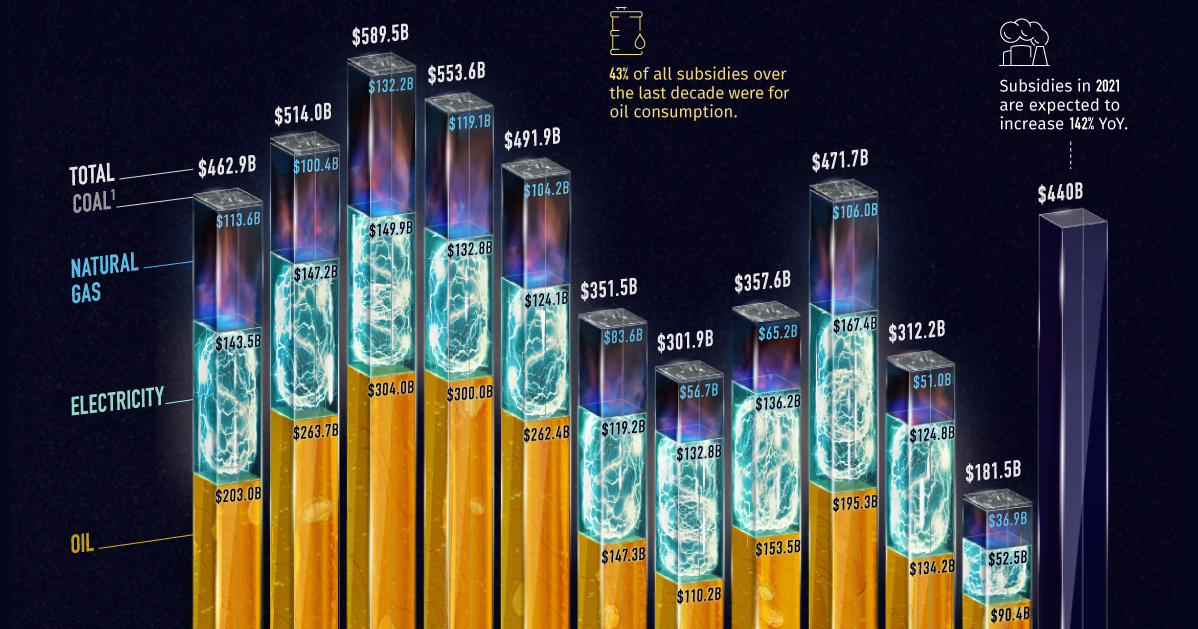
Each year, governments around the world pour nearly half a trillion dollars into fossil fuel subsidies. This chart breaks down a decade of fossil fuel consumption subsidies by energy source using data from the International Energy Agency (IEA).
Breaking Down Fossil Fuel Consumption Subsidies
Since 2010, governments have spent over $5 trillion in fossil fuel consumption subsidies. The majority of this sum went towards making oil more affordable, as seen below:
| Subsidies by Year (US$) | Oil | Electricity | Natural Gas | Coal | Total |
|---|---|---|---|---|---|
| 2010 | $203.0B | $143.5B | $113.6B | $2.7B | $462.9B |
| 2011 | $263.7B | $147.2B | $100.4B | $3.6B | $514.0B |
| 2012 | $304.0B | $149.9B | $132.2B | $3.3B | $589.5B |
| 2013 | $300.0B | $132.8B | $119.1B | $1.7B | $553.6B |
| 2014 | $262.4B | $124.1B | $104.2B | $1.1B | $491.9B |
| 2015 | $147.3B | $119.2B | $83.6B | $1.5B | $351.5B |
| 2016 | $110.2B | $132.8B | $56.7B | $2.2B | $301.9B |
| 2017 | $153.5B | $136.2B | $65.2B | $2.7B | $357.6B |
| 2018 | $195.3B | $167.4B | $106.0B | $3.0B | $471.7B |
| 2019 | $134.2B | $124.8B | $51.0B | $2.2B | $312.2B |
| 2020 | $90.4B | $52.5B | $36.9B | $1.7B | $181.5B |
| Total | $2,164.0B | $1,430.4B | $968.9B | $25.7B | $4,588.3B |
Fossil fuel subsidies fell to a decade low in 2020 as the pandemic hampered fuel consumption and triggered a nosedive in oil prices. However, after two years of straight declines, the IEA estimates that governments around the world spent $440 billion on subsidizing fossil fuel consumption over 2021, representing a 142% rise year-over-year.
Breaking down the subsidies by fuel, oil accounts for 43% or over $2 trillion of all subsidies between 2010 and 2020. Together, oil and electricity generated by fossil fuels received nearly 75% of all subsidies.
Despite growing support for the clean energy transition, the fossil fuel industry reaps the benefits of billions in subsidies annually—but why?
Why Do Governments Subsidize Fossil Fuels?
High energy prices can have rippling effects throughout an economy.
For consumers, heating and transportation become more expensive. And for producers who use energy and oil as inputs, the cost of goods and services goes up.
Often, governments turn to energy subsidies to keep prices down and encourage economic activity. Therefore, there’s a high cost to removing these subsidies, especially in developing countries where large parts of the population might lack access to affordable energy.
But fossil fuel subsidies can also have detrimental effects. By artificially lowering prices, they can encourage overconsumption of carbon-intense fuels, creating negative externalities through adverse environmental and health impacts. According to the International Renewable Energy Agency, these add up to an amount anywhere between $2.6 to $8.1 trillion globally.
Despite these disadvantages, fossil fuels remain an important part of the global energy mix, with continued support from governments. And with energy prices soaring, 2022 could be another year of billions in fossil fuel subsidies.


Energy
Mapped: The Age of Energy Projects in Interconnection Queues, by State
This map shows how many energy projects are in interconnection queues by state and how long these projects have been queued up, on average.


Age of Energy Projects in Interconnection Queues, by State
This was originally posted on our Voronoi app. Download the app for free on iOS or Android and discover incredible data-driven charts from a variety of trusted sources.
By the end of 2023, more than 11,000 energy projects were in interconnection queues in the United States, waiting for a green-light from regional grid operators to proceed with construction.
This map, created in partnership with the National Public Utilities Council, maps out the average age of active energy projects in interconnection queues by state, using data from Berkeley Lab.
Interconnection Queues, Explained
Interconnection queues are lists of energy projects that have made interconnection requests to their regional grid operators. Once submitted, these requests formally initiate the impact study process that each project goes through before grid connection, forming waiting lists for approval known as interconnection queues.
In recent years, both the number and generation capacity of queued projects have surged in the United States, along with the length of time spent in queue.
According to Berkeley Lab, the amount of generation capacity entering queues each year has risen by more than 550% from 2015 to 2023, with average queue duration rising from 3 years to 5 years the same period.
As a result of the growing backlog, a large proportion of projects ultimately withdraw from queues, leading to only 19% of applications reaching commercial operations.
The Backlog: Number of Projects and Average Wait Times
Of the 11,000 active projects in U.S. queues at the end of 2023, Texas, California, and Virginia had the most in queue; 1,208, 947, and 743, respectively.
When looking at the average ages of these projects, all three states hovered around the national average of 34 months (2.83 years), with Texas sporting 28 months, California 33, and Virginia 34.
Vermont, Minnesota, Wisconsin, and Florida, on the other hand, had the highest average queue durations; 54, 49, 47, and 46 months, respectively.
Average Queue Duration by Project Type
At the end of 2023, more than 95% of the generation capacity in active interconnection queues was for emission-free resources. The table below provides a breakdown.
| Project Type | Average Queue Duration (As of 12/31/2023) | Number of Projects in Queue |
|---|---|---|
| Wind | 40 months | 841 |
| Solar | 34 months | 4,506 |
| Wind+Battery | 34 months | 76 |
| Solar+Battery | 27 months | 2,377 |
| Battery | 24 months | 2,818 |
Wind projects had the highest wait times at the end of 2023 with an average age of 40 months (3.33 years). Solar projects, on the other hand, made up more than 40% of projects in queue.
Overall, reducing the time that these renewable energy projects spend in queues can accelerate the transition to a low-carbon energy future.
According to the U.S. Department of Energy, enhancing data transparency, streamlining approval processes, promoting economic efficiency, and maintaining a reliable grid are some of the ways this growing backlog can be mitigated.

-

 Culture6 days ago
The World’s Top Media Franchises by All-Time Revenue
-

 Science2 weeks ago
Visualizing the Average Lifespans of Mammals
-

 Brands2 weeks ago
How Tech Logos Have Evolved Over Time
-

 Energy2 weeks ago
Ranked: The Top 10 EV Battery Manufacturers in 2023
-

 Demographics2 weeks ago
Countries With the Largest Happiness Gains Since 2010
-

 VC+2 weeks ago
VC+: Get Our Key Takeaways From the IMF’s World Economic Outlook
-

 Demographics2 weeks ago
The Countries That Have Become Sadder Since 2010
-

 Money1 week ago
Charted: Who Has Savings in This Economy?