Batteries
Visualizing China’s Dominance in Clean Energy Metals
![]() Subscribe to the Elements free mailing list for more like this
Subscribe to the Elements free mailing list for more like this
Visualizing China’s Dominance in Clean Energy Metals
This was originally posted on Elements. Sign up to the free mailing list to get beautiful visualizations on natural resource megatrends in your email every week.
Renewable sources of energy are expected to replace fossil fuels over the coming decades, and this large-scale transition will have a downstream effect on the demand of raw materials. More green energy means more wind turbines, solar panels, and batteries needed, and more clean energy metals necessary to build these technologies.
This visualization, based on data from the International Energy Agency (IEA), illustrates where the extraction and processing of key metals for the green revolution take place.
It shows that despite being the world’s biggest carbon polluter, China is also the largest producer of most of the world’s critical minerals for the green revolution.
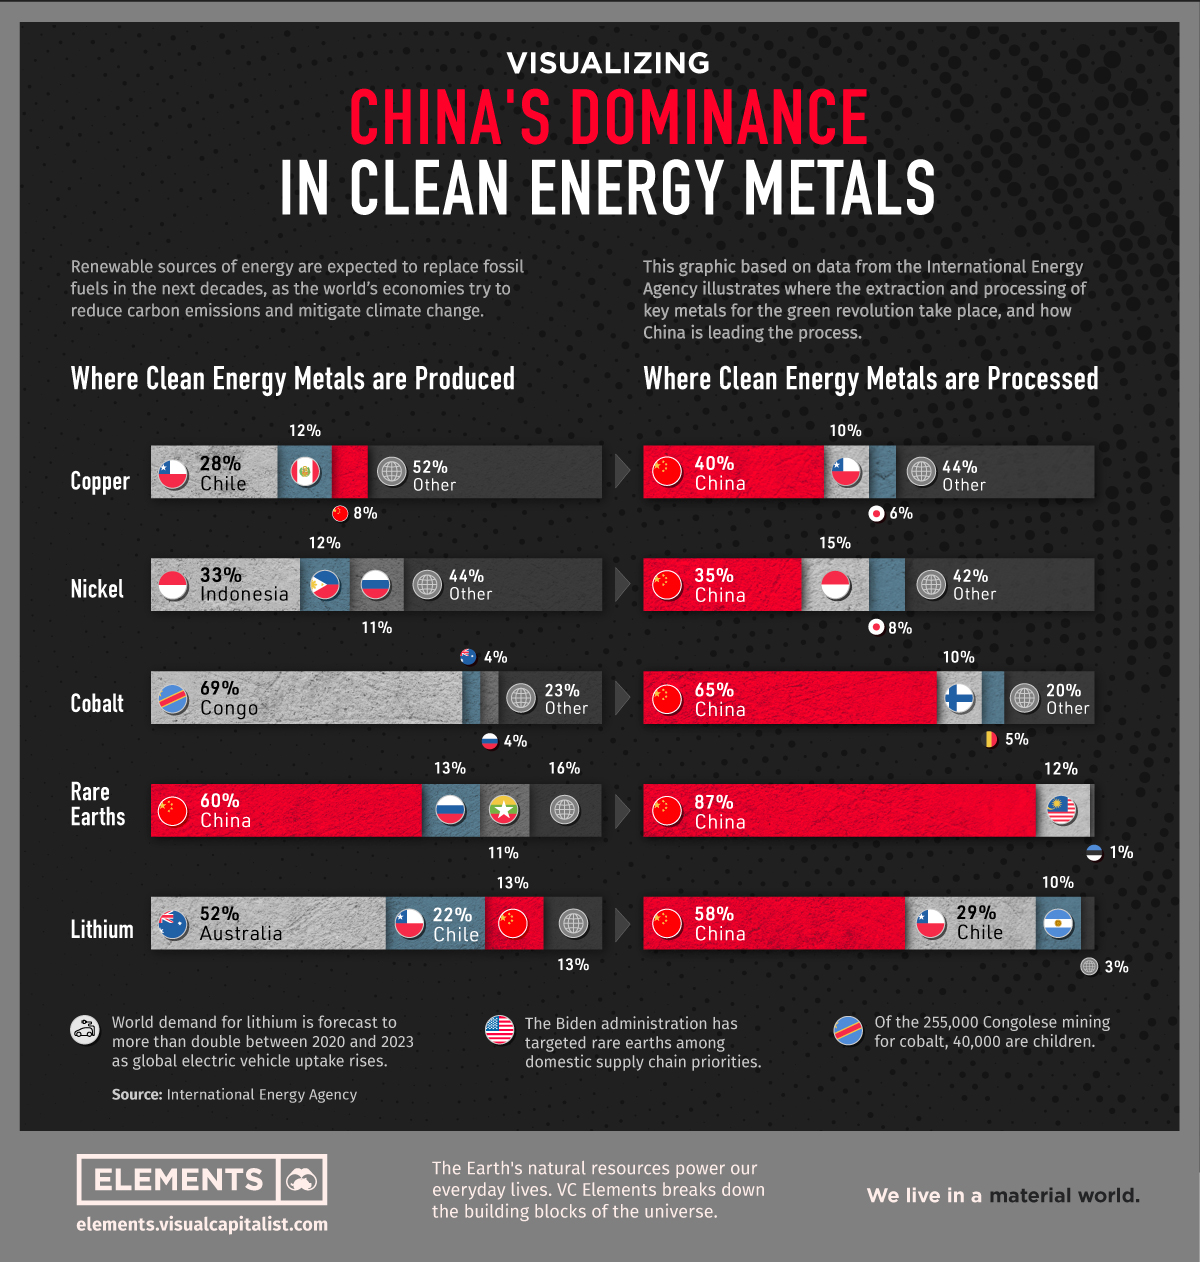
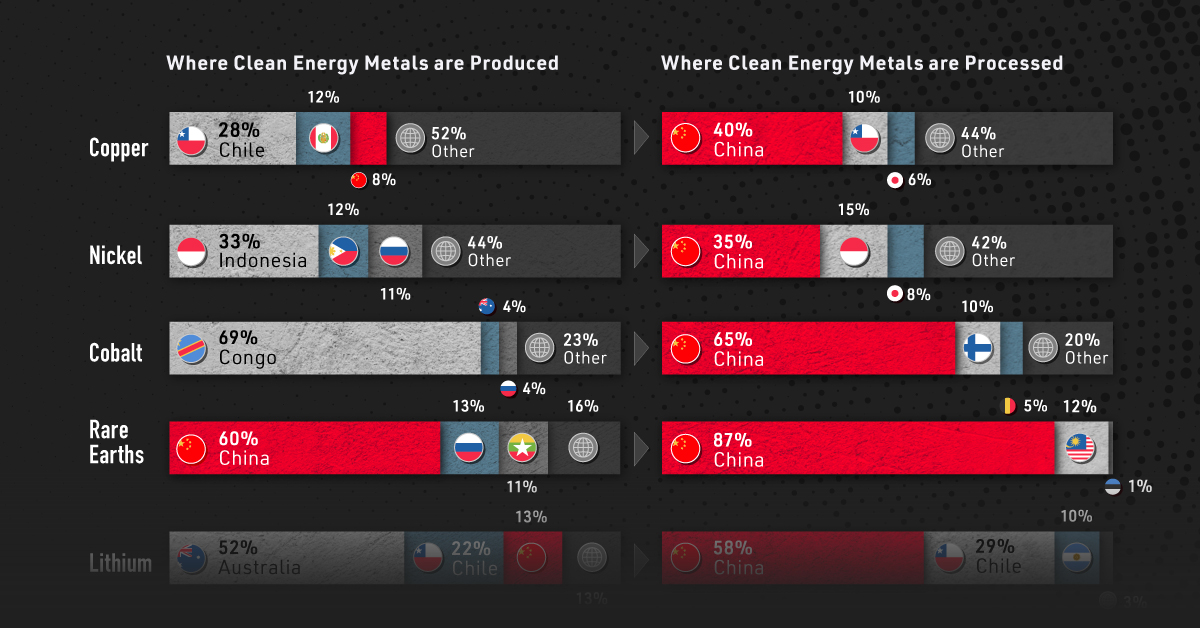
Where Clean Energy Metals are Produced
China produces 60% of all rare earth elements used as components in high technology devices, including smartphones and computers.
The country also has a 13% share of the lithium production market, which is still dominated by Australia (52%) and Chile (22%). The highly reactive element is key to producing rechargeable batteries for mobile phones, laptops, and electric vehicles.
| China's Share | Extraction | Processing |
|---|---|---|
| Copper | 8% | 40% |
| Nickel | 5% | 35% |
| Cobalt | 1.5% | 65% |
| Rare Earths | 60% | 87% |
| Lithium | 13% | 58% |
But even more than extraction, China is the dominant economy when it comes to processing operations. The country’s share of refining is around 35% for nickel, 58% for lithium, 65% for cobalt, and 87% for rare earth elements.
Despite being the largest economy in the world, the U.S. does not appear among the largest producers of any of the metals listed. To shorten the gap, the Biden administration recently launched an executive order to review the American strategy for critical and strategic materials.
It’s also worth noting that Russia also does not appear among the top producers when it comes to clean energy metals, despite being one of the world’s leading producers of minerals like copper, iron, and palladium.
Low Regulation in the Clean Metal Supply Chain
While China leads all countries in terms of cobalt processing, the metal itself is primarily extracted in the Democratic Republic of Congo (DRC). Still, Chinese interests own 15 of the 17 industrial cobalt operations in the DRC, according to a data analysis by The New York Times and Benchmark Mineral Intelligence.
Unfortunately, the DRC’s cobalt production has been criticized due to reports of corruption and lack of regulation.
Part of the Congolese cobalt comes from artisanal mines with low regulation. Of the 255,000 Congolese artisanal miners, an estimated 40,000 are children, some as young as six years old.
The Rise of Clean Energy Metals
The necessary shift from fossil fuels to renewable energy opens up interesting questions about how geopolitics, and these supply chains, will be affected.
In the race to secure raw materials needed for the green revolution, new world powers could emerge as demand for clean energy metals grows.
For now, China has the lead.


Energy
Visualized: Inside a Lithium-Ion Battery
Lithium-ion batteries are critical for many modern technologies, from smartphones to smart cities. Here’s how this critical technology works.
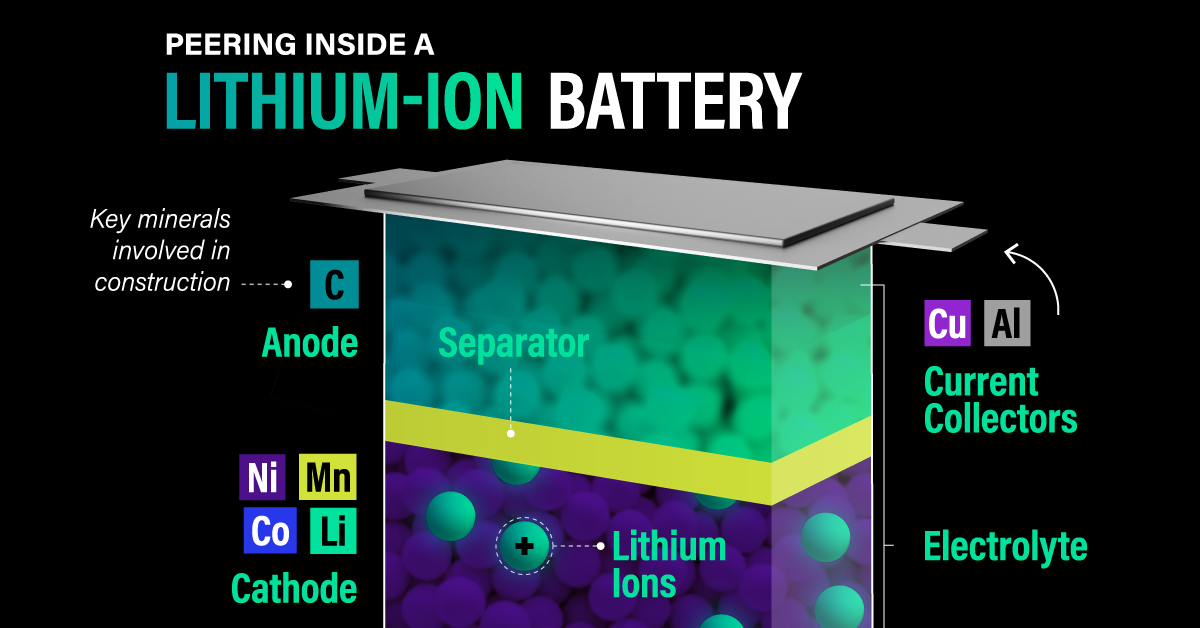
What’s Inside a Lithium-Ion Battery?
Winning the Nobel Prize for Chemistry in 2019, the lithium-ion battery has become ubiquitous and today powers nearly everything, from smartphones to electric vehicles.
In this graphic, we partnered with EnergyX to find out how these important pieces of technology work.
Looking Inside
Lithium-ion batteries have different standards in various regions, namely NMC/NMCA in Europe and North America and LFP in China. The former has a higher energy density, while the latter has a lower cost.
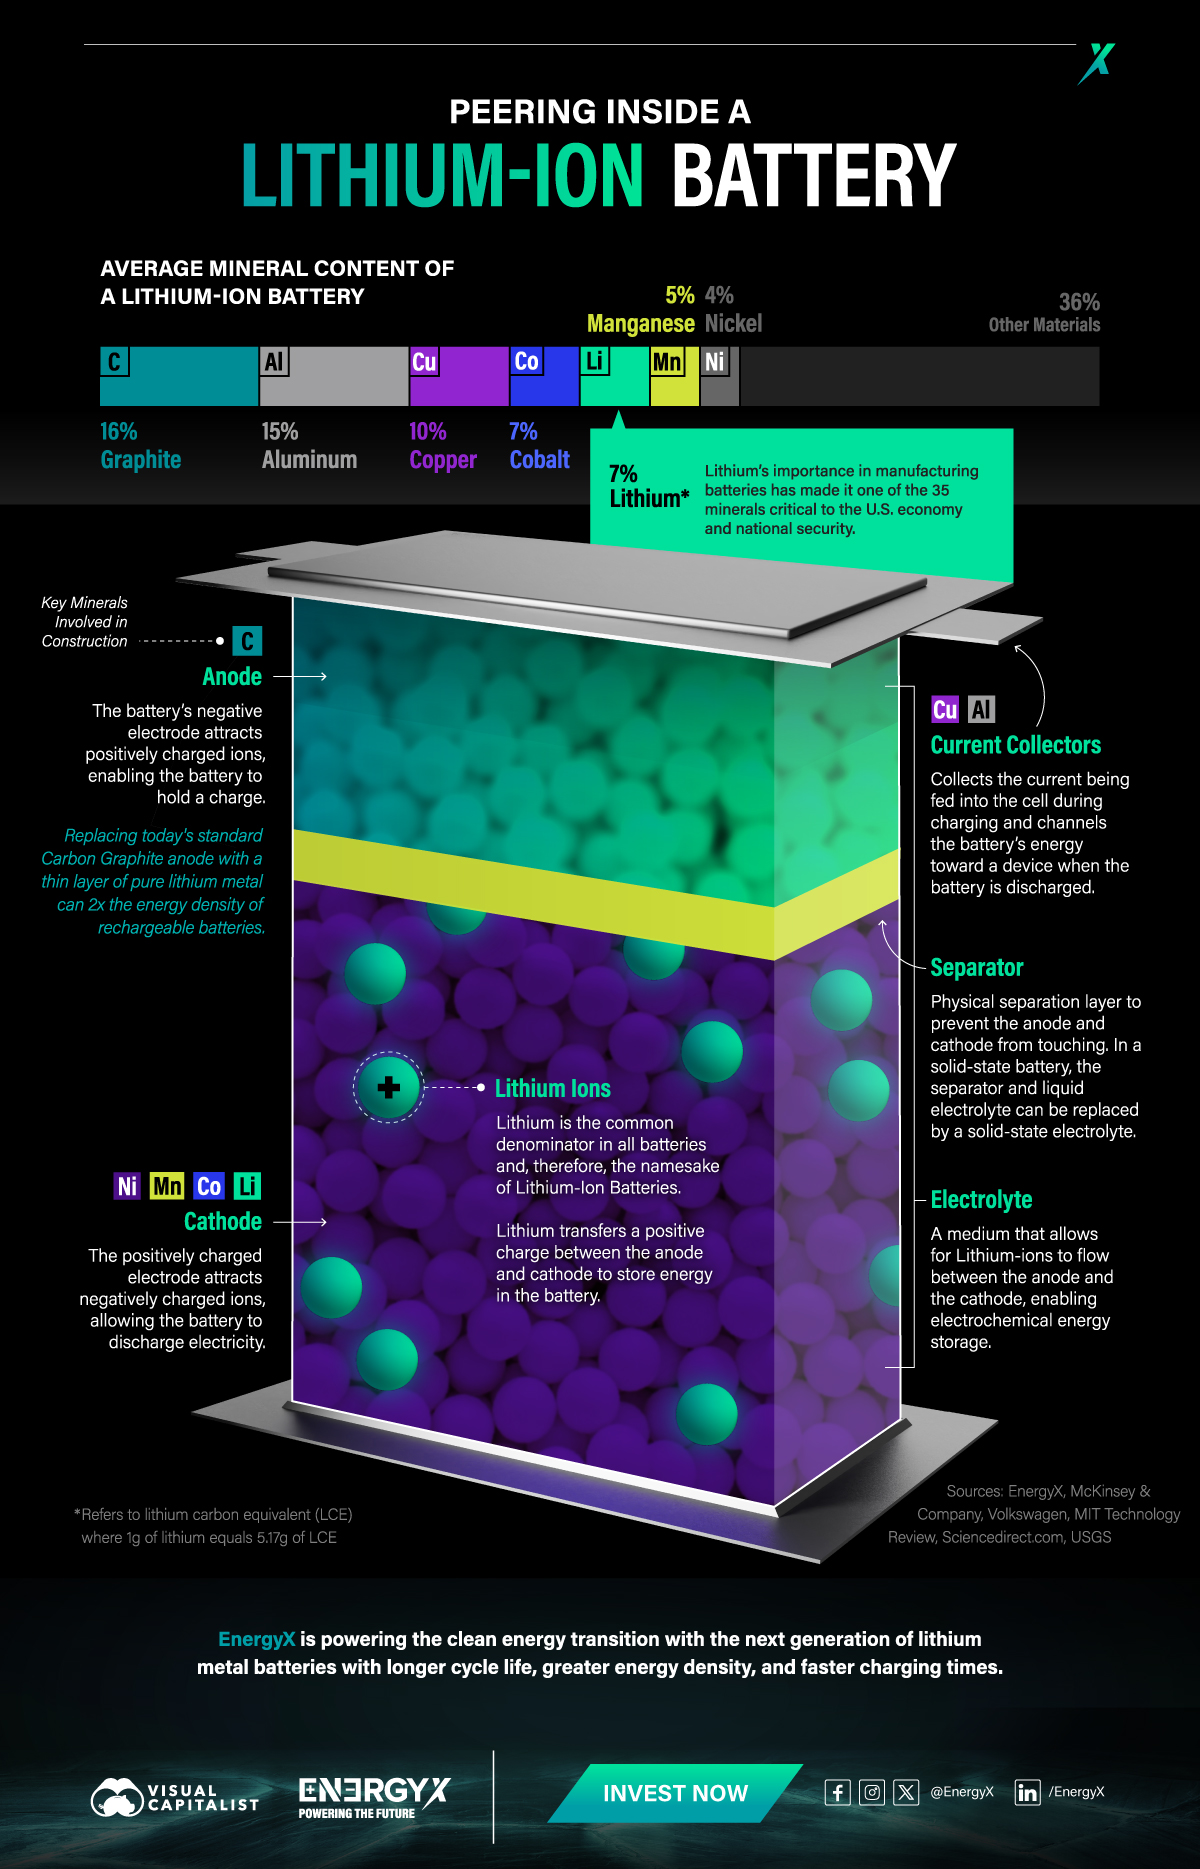
Here is the average mineral composition of a lithium-ion battery, after taking account those two main cathode types:
| Material | % of Construction | ||||||
|---|---|---|---|---|---|---|---|
| Nickel (Ni) | 4% | ||||||
| Manganese (Mn) | 5% | ||||||
| Lithium (Li) | 7% | ||||||
| Cobalt (Co) | 7% | ||||||
| Copper (Cu) | 10% | ||||||
| Aluminum (Al) | 15% | ||||||
| Graphite (C) | 16% | ||||||
| Other Materials | 36% |

The percentage of lithium found in a battery is expressed as the percentage of lithium carbonate equivalent (LCE) the battery contains. On average, that is equal to 1g of lithium metal for every 5.17g of LCE.
How Do They Work?
Lithium-ion batteries work by collecting current and feeding it into the battery during charging. Normally, a graphite anode attracts lithium ions and holds them as a charge. But interestingly, recent research shows that battery energy density can nearly double when replacing graphite with a thin layer of pure lithium.
When discharging, the cathode attracts the stored lithium ions and funnels them to another current collector. The circuit can react as both the anode and cathode are prevented from touching and are suspended in a medium that allows the ions to flow easily.
Powering Tomorrow
Despite making up only 7% of a battery’s weight on average, lithium is so critical for manufacturing lithium-ion batteries that the U.S. Geological Survey has classified it as one of 35 minerals vital to the U.S. economy.
This means refining lithium more effectively is critical to meeting the demand for next-generation lithium-ion batteries.
EnergyX is powering the clean energy transition with the next generation of lithium metal batteries with longer cycle life, greater energy density, and faster charging times.


-

 Lithium4 days ago
Ranked: The Top 10 EV Battery Manufacturers in 2023
Asia dominates this ranking of the world’s largest EV battery manufacturers in 2023.
-

 Energy1 week ago
The World’s Biggest Nuclear Energy Producers
China has grown its nuclear capacity over the last decade, now ranking second on the list of top nuclear energy producers.
-

 Energy1 month ago
The World’s Biggest Oil Producers in 2023
Just three countries accounted for 40% of global oil production last year.
-

 Energy1 month ago
How Much Does the U.S. Depend on Russian Uranium?
Currently, Russia is the largest foreign supplier of nuclear power fuel to the U.S.
-

 Uranium2 months ago
Charted: Global Uranium Reserves, by Country
We visualize the distribution of the world’s uranium reserves by country, with 3 countries accounting for more than half of total reserves.
-

 Energy3 months ago
Visualizing the Rise of the U.S. as Top Crude Oil Producer
Over the last decade, the United States has established itself as the world’s top producer of crude oil, surpassing Saudi Arabia and Russia.


-

 Debt1 week ago
How Debt-to-GDP Ratios Have Changed Since 2000
-

 Markets2 weeks ago
Ranked: The World’s Top Flight Routes, by Revenue
-

 Countries2 weeks ago
Population Projections: The World’s 6 Largest Countries in 2075
-

 Markets2 weeks ago
The Top 10 States by Real GDP Growth in 2023
-

 Demographics2 weeks ago
The Smallest Gender Wage Gaps in OECD Countries
-

 United States2 weeks ago
Where U.S. Inflation Hit the Hardest in March 2024
-

 Green2 weeks ago
Top Countries By Forest Growth Since 2001
-

 United States2 weeks ago
Ranked: The Largest U.S. Corporations by Number of Employees