Energy
Ranked: Nuclear Power Production, by Country
![]() Subscribe to the Elements free mailing list for more like this
Subscribe to the Elements free mailing list for more like this
Nuclear Power Production by Country
This was originally posted on Elements. Sign up to the free mailing list to get beautiful visualizations on natural resource megatrends in your email every week.
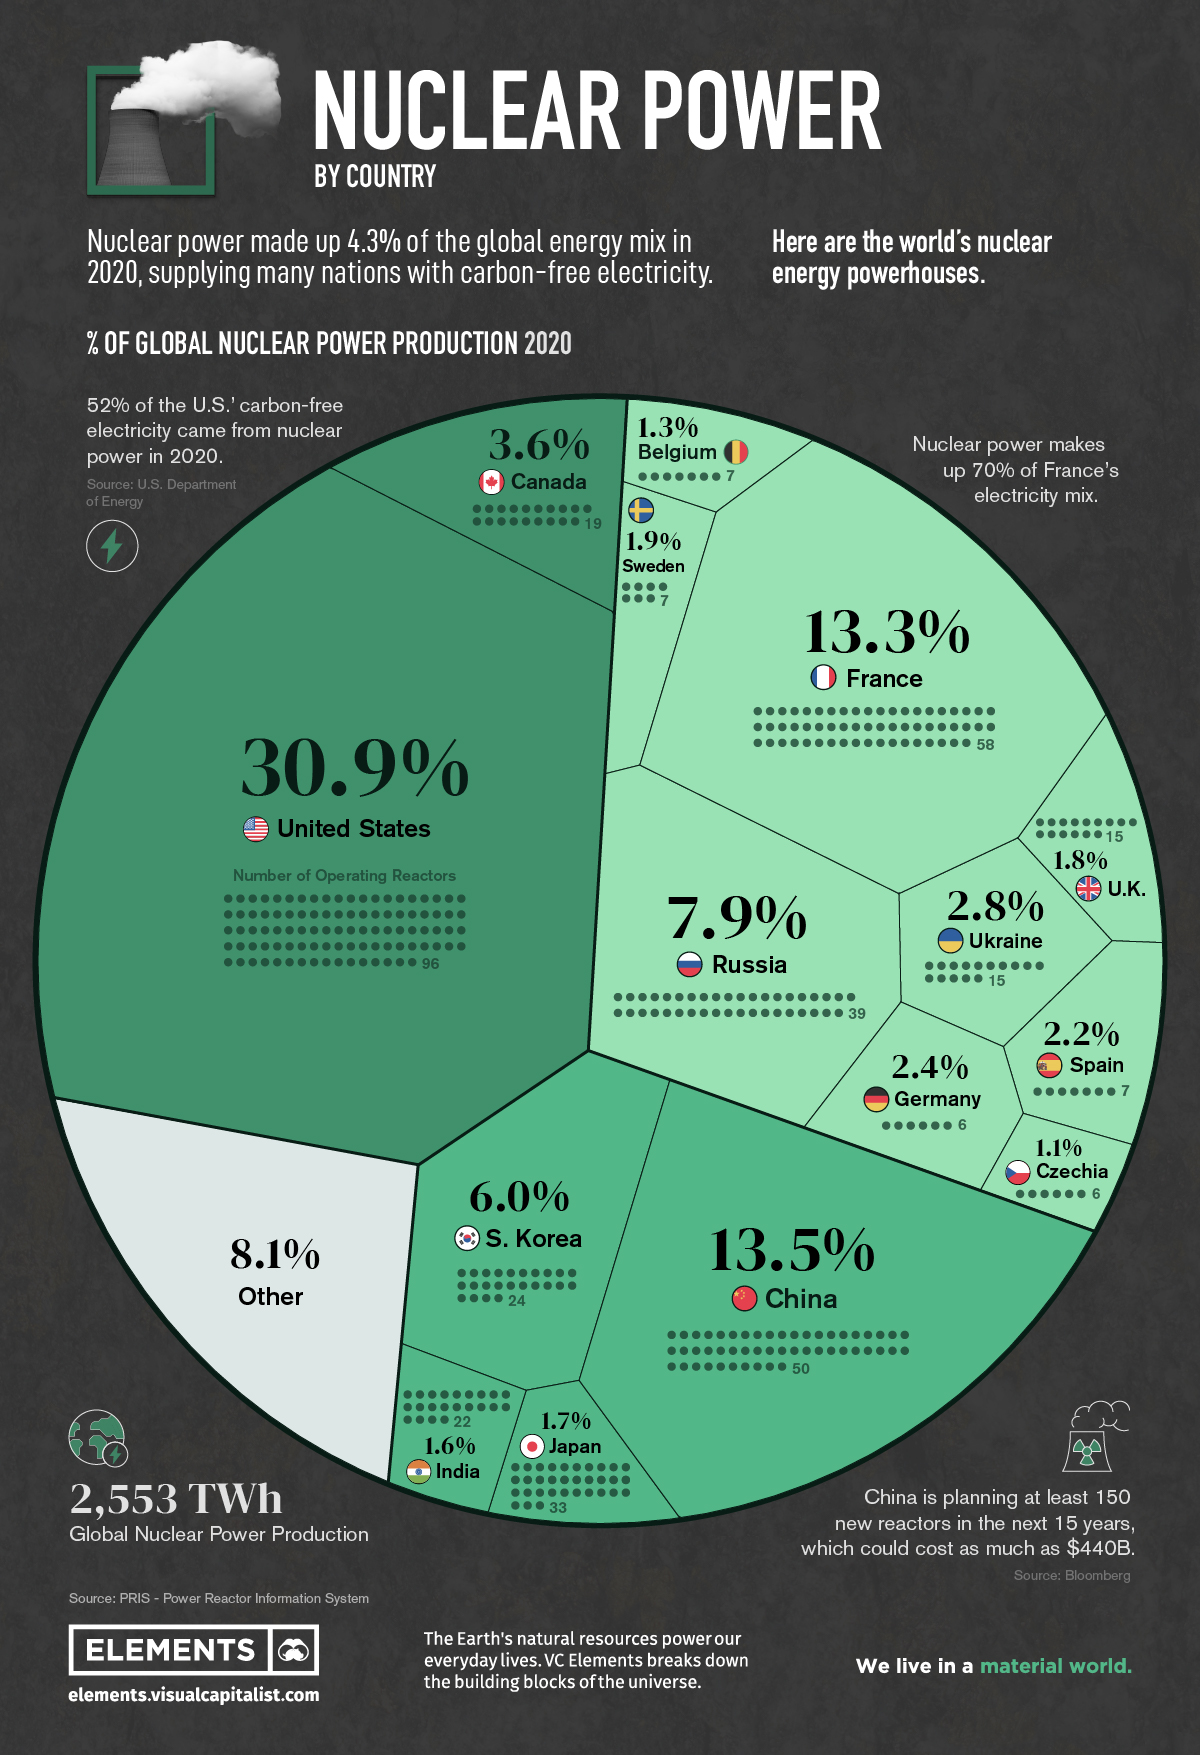
Nearly 450 reactors around the world supply various nations with nuclear power, combining for about 10% of the world’s electricity, or about 4% of the global energy mix.
But while some countries are turning to nuclear as a clean energy source, nuclear energy generation overall has seen a slowdown since its peak in the 1990s.
The above infographic breaks down nuclear electricity generation by country in 2020 using data from the Power Reactor Information System (PRIS).
Ranked: The Top 15 Countries for Nuclear Power
Just 15 countries account for more than 91% of global nuclear power production. Here’s how much energy these countries produced in 2020:
| Rank | Country | Number of Operating Reactors | Nuclear Electricity Supplied [GWh] | % share |
|---|---|---|---|---|
| #1 | U.S. 🇺🇸 | 96 | 789,919 | 30.9% |
| #2 | China 🇨🇳 | 50 | 344,748 | 13.5% |
| #3 | France 🇫🇷 | 58 | 338,671 | 13.3% |
| #4 | Russia 🇷🇺 | 39 | 201,821 | 7.9% |
| #5 | South Korea 🇰🇷 | 24 | 152,583 | 6.0% |
| #6 | Canada 🇨🇦 | 19 | 92,166 | 3.6% |
| #7 | Ukraine 🇺🇦 | 15 | 71,550 | 2.8% |
| #8 | Germany 🇩🇪 | 6 | 60,918 | 2.4% |
| #9 | Spain 🇪🇸 | 7 | 55,825 | 2.2% |
| #10 | Sweden 🇸🇪 | 7 | 47,362 | 1.9% |
| #11 | U.K. 🇬🇧 | 15 | 45,668 | 1.8% |
| #12 | Japan 🇯🇵 | 33 | 43,099 | 1.7% |
| #13 | India 🇮🇳 | 22 | 40,374 | 1.6% |
| #14 | Belgium 🇧🇪 | 7 | 32,793 | 1.3% |
| #15 | Czechia 🇨🇿 | 6 | 28,372 | 1.1% |
| Rest of the World 🌎 | 44 | 207,340 | 8.1% | |
| Total | 448 | 2,553,208 | 100.0% |
In the U.S., nuclear power produces over 50% of the country’s clean electricity. Additionally, 88 of the country’s 96 operating reactors in 2020 received approvals for a 20-year life extension.
China, the world’s second-largest nuclear power producer, is investing further in nuclear energy in a bid to achieve its climate goals. The plan, which includes building 150 new reactors by 2035, could cost as much as $440 billion.
On the other hand, European opinions on nuclear energy are mixed. Germany is the eighth-largest on the list but plans to shutter its last operating reactor in 2022 as part of its nuclear phase-out. France, meanwhile, plans to expand its nuclear capacity.
Which Countries Rely Most on Nuclear Energy?
Although total electricity generation is useful for a high-level global comparison, it’s important to remember that there are some smaller countries not featured above where nuclear is still an important part of the electricity mix.
Here’s a breakdown based on the share of nuclear energy in a country’s electricity mix:
| Rank | Country | Nuclear Share of Electricity Mix |
|---|---|---|
| #1 | France 🇫🇷 | 70.6% |
| #2 | Slovakia 🇸🇰 | 53.1% |
| #3 | Ukraine 🇺🇦 | 51.2% |
| #4 | Hungary 🇭🇺 | 48.0% |
| #5 | Bulgaria 🇧🇬 | 40.8% |
| #6 | Belgium 🇧🇪 | 39.1% |
| #7 | Slovenia 🇸🇮 | 37.8% |
| #8 | Czechia 🇨🇿 | 37.3% |
| #9 | Armenia 🇦🇲 | 34.5% |
| #10 | Finland 🇫🇮 | 33.9% |
| #11 | Switzerland 🇨🇭 | 32.9% |
| #12 | Sweden 🇸🇪 | 29.8% |
| #13 | South Korea 🇰🇷 | 29.6% |
| #14 | Spain 🇪🇸 | 22.2% |
| #15 | Russia 🇷🇺 | 20.6% |
| #16 | Romania 🇷🇴 | 19.9% |
| #17 | United States 🇺🇸 | 19.7% |
| #18 | Canada 🇨🇦 | 14.6% |
| #19 | United Kingdom 🇬🇧 | 14.5% |
| #20 | Germany 🇩🇪 | 11.3% |
European countries dominate the leaderboard with 14 of the top 15 spots, including France, where nuclear power is the country’s largest source of electricity.
It’s interesting to note that only a few of these countries are top producers of nuclear in absolute terms. For example, in Slovakia, nuclear makes up 53.6% of the electricity mix—however, the country’s four reactors make up less than 1% of total global operating capacity.
On the flipside, the U.S. ranks 17th by share of nuclear power in its mix, despite producing 31% of global nuclear electricity in 2020. This discrepancy is largely due to size and population. European countries are much smaller and produce less electricity overall than larger countries like the U.S. and China.
The Future of Nuclear Power
The nuclear power landscape is constantly changing.
There were over 50 additional nuclear reactors under construction in 2020, and hundreds more are planned primarily in Asia.
As countries turn away from fossil fuels and embrace carbon-free energy sources, nuclear energy might see a resurgence in the global energy mix despite the phase-outs planned in several countries around the globe.


Energy
Charted: 4 Reasons Why Lithium Could Be the Next Gold Rush
Visual Capitalist has partnered with EnergyX to show why drops in prices and growing demand may make now the right time to invest in lithium.


4 Reasons Why You Should Invest in Lithium
Lithium’s importance in powering EVs makes it a linchpin of the clean energy transition and one of the world’s most precious minerals.
In this graphic, Visual Capitalist partnered with EnergyX to explore why now may be the time to invest in lithium.
1. Lithium Prices Have Dropped
One of the most critical aspects of evaluating an investment is ensuring that the asset’s value is higher than its price would indicate. Lithium is integral to powering EVs, and, prices have fallen fast over the last year:
| Date | LiOH·H₂O* | Li₂CO₃** |
|---|---|---|
| Feb 2023 | $76 | $71 |
| March 2023 | $71 | $61 |
| Apr 2023 | $43 | $33 |
| May 2023 | $43 | $33 |
| June 2023 | $47 | $45 |
| July 2023 | $44 | $40 |
| Aug 2023 | $35 | $35 |
| Sept 2023 | $28 | $27 |
| Oct 2023 | $24 | $23 |
| Nov 2023 | $21 | $21 |
| Dec 2023 | $17 | $16 |
| Jan 2024 | $14 | $15 |
| Feb 2024 | $13 | $14 |
Note: Monthly spot prices were taken as close to the 14th of each month as possible.
*Lithium hydroxide monohydrate MB-LI-0033
**Lithium carbonate MB-LI-0029
2. Lithium-Ion Battery Prices Are Also Falling
The drop in lithium prices is just one reason to invest in the metal. Increasing economies of scale, coupled with low commodity prices, have caused the cost of lithium-ion batteries to drop significantly as well.
In fact, BNEF reports that between 2013 and 2023, the price of a Li-ion battery dropped by 82%.
| Year | Price per KWh |
|---|---|
| 2023 | $139 |
| 2022 | $161 |
| 2021 | $150 |
| 2020 | $160 |
| 2019 | $183 |
| 2018 | $211 |
| 2017 | $258 |
| 2016 | $345 |
| 2015 | $448 |
| 2014 | $692 |
| 2013 | $780 |

3. EV Adoption is Sustainable
One of the best reasons to invest in lithium is that EVs, one of the main drivers behind the demand for lithium, have reached a price point similar to that of traditional vehicle.
According to the Kelly Blue Book, Tesla’s average transaction price dropped by 25% between 2022 and 2023, bringing it in line with many other major manufacturers and showing that EVs are a realistic transport option from a consumer price perspective.
| Manufacturer | September 2022 | September 2023 |
|---|---|---|
| BMW | $69,000 | $72,000 |
| Ford | $54,000 | $56,000 |
| Volkswagon | $54,000 | $56,000 |
| General Motors | $52,000 | $53,000 |
| Tesla | $68,000 | $51,000 |
4. Electricity Demand in Transport is Growing
As EVs become an accessible transport option, there’s an investment opportunity in lithium. But possibly the best reason to invest in lithium is that the IEA reports global demand for the electricity in transport could grow dramatically by 2030:
| Transport Type | 2022 | 2025 | 2030 |
|---|---|---|---|
| Buses 🚌 | 23,000 GWh | 50,000 GWh | 130,000 GWh |
| Cars 🚙 | 65,000 GWh | 200,000 GWh | 570,000 GWh |
| Trucks 🛻 | 4,000 GWh | 15,000 GWh | 94,000 GWh |
| Vans 🚐 | 6,000 GWh | 16,000 GWh | 72,000 GWh |
The Lithium Investment Opportunity
Lithium presents a potentially classic investment opportunity. Lithium and battery prices have dropped significantly, and recently, EVs have reached a price point similar to other vehicles. By 2030, the demand for clean energy, especially in transport, will grow dramatically.
With prices dropping and demand skyrocketing, now is the time to invest in lithium.
EnergyX is poised to exploit lithium demand with cutting-edge lithium extraction technology capable of extracting 300% more lithium than current processes.

-

 Lithium4 days ago
Ranked: The Top 10 EV Battery Manufacturers in 2023
Asia dominates this ranking of the world’s largest EV battery manufacturers in 2023.
-

 Energy1 week ago
The World’s Biggest Nuclear Energy Producers
China has grown its nuclear capacity over the last decade, now ranking second on the list of top nuclear energy producers.
-

 Energy1 month ago
The World’s Biggest Oil Producers in 2023
Just three countries accounted for 40% of global oil production last year.
-

 Energy1 month ago
How Much Does the U.S. Depend on Russian Uranium?
Currently, Russia is the largest foreign supplier of nuclear power fuel to the U.S.
-

 Uranium2 months ago
Charted: Global Uranium Reserves, by Country
We visualize the distribution of the world’s uranium reserves by country, with 3 countries accounting for more than half of total reserves.
-

 Energy3 months ago
Visualizing the Rise of the U.S. as Top Crude Oil Producer
Over the last decade, the United States has established itself as the world’s top producer of crude oil, surpassing Saudi Arabia and Russia.


-
Energy1 week ago
The World’s Biggest Nuclear Energy Producers
-

 Money2 weeks ago
Which States Have the Highest Minimum Wage in America?
-

 Technology2 weeks ago
Ranked: Semiconductor Companies by Industry Revenue Share
-

 Markets2 weeks ago
Ranked: The World’s Top Flight Routes, by Revenue
-

 Countries2 weeks ago
Population Projections: The World’s 6 Largest Countries in 2075
-

 Markets2 weeks ago
The Top 10 States by Real GDP Growth in 2023
-

 Demographics2 weeks ago
The Smallest Gender Wage Gaps in OECD Countries
-

 United States2 weeks ago
Where U.S. Inflation Hit the Hardest in March 2024