Markets
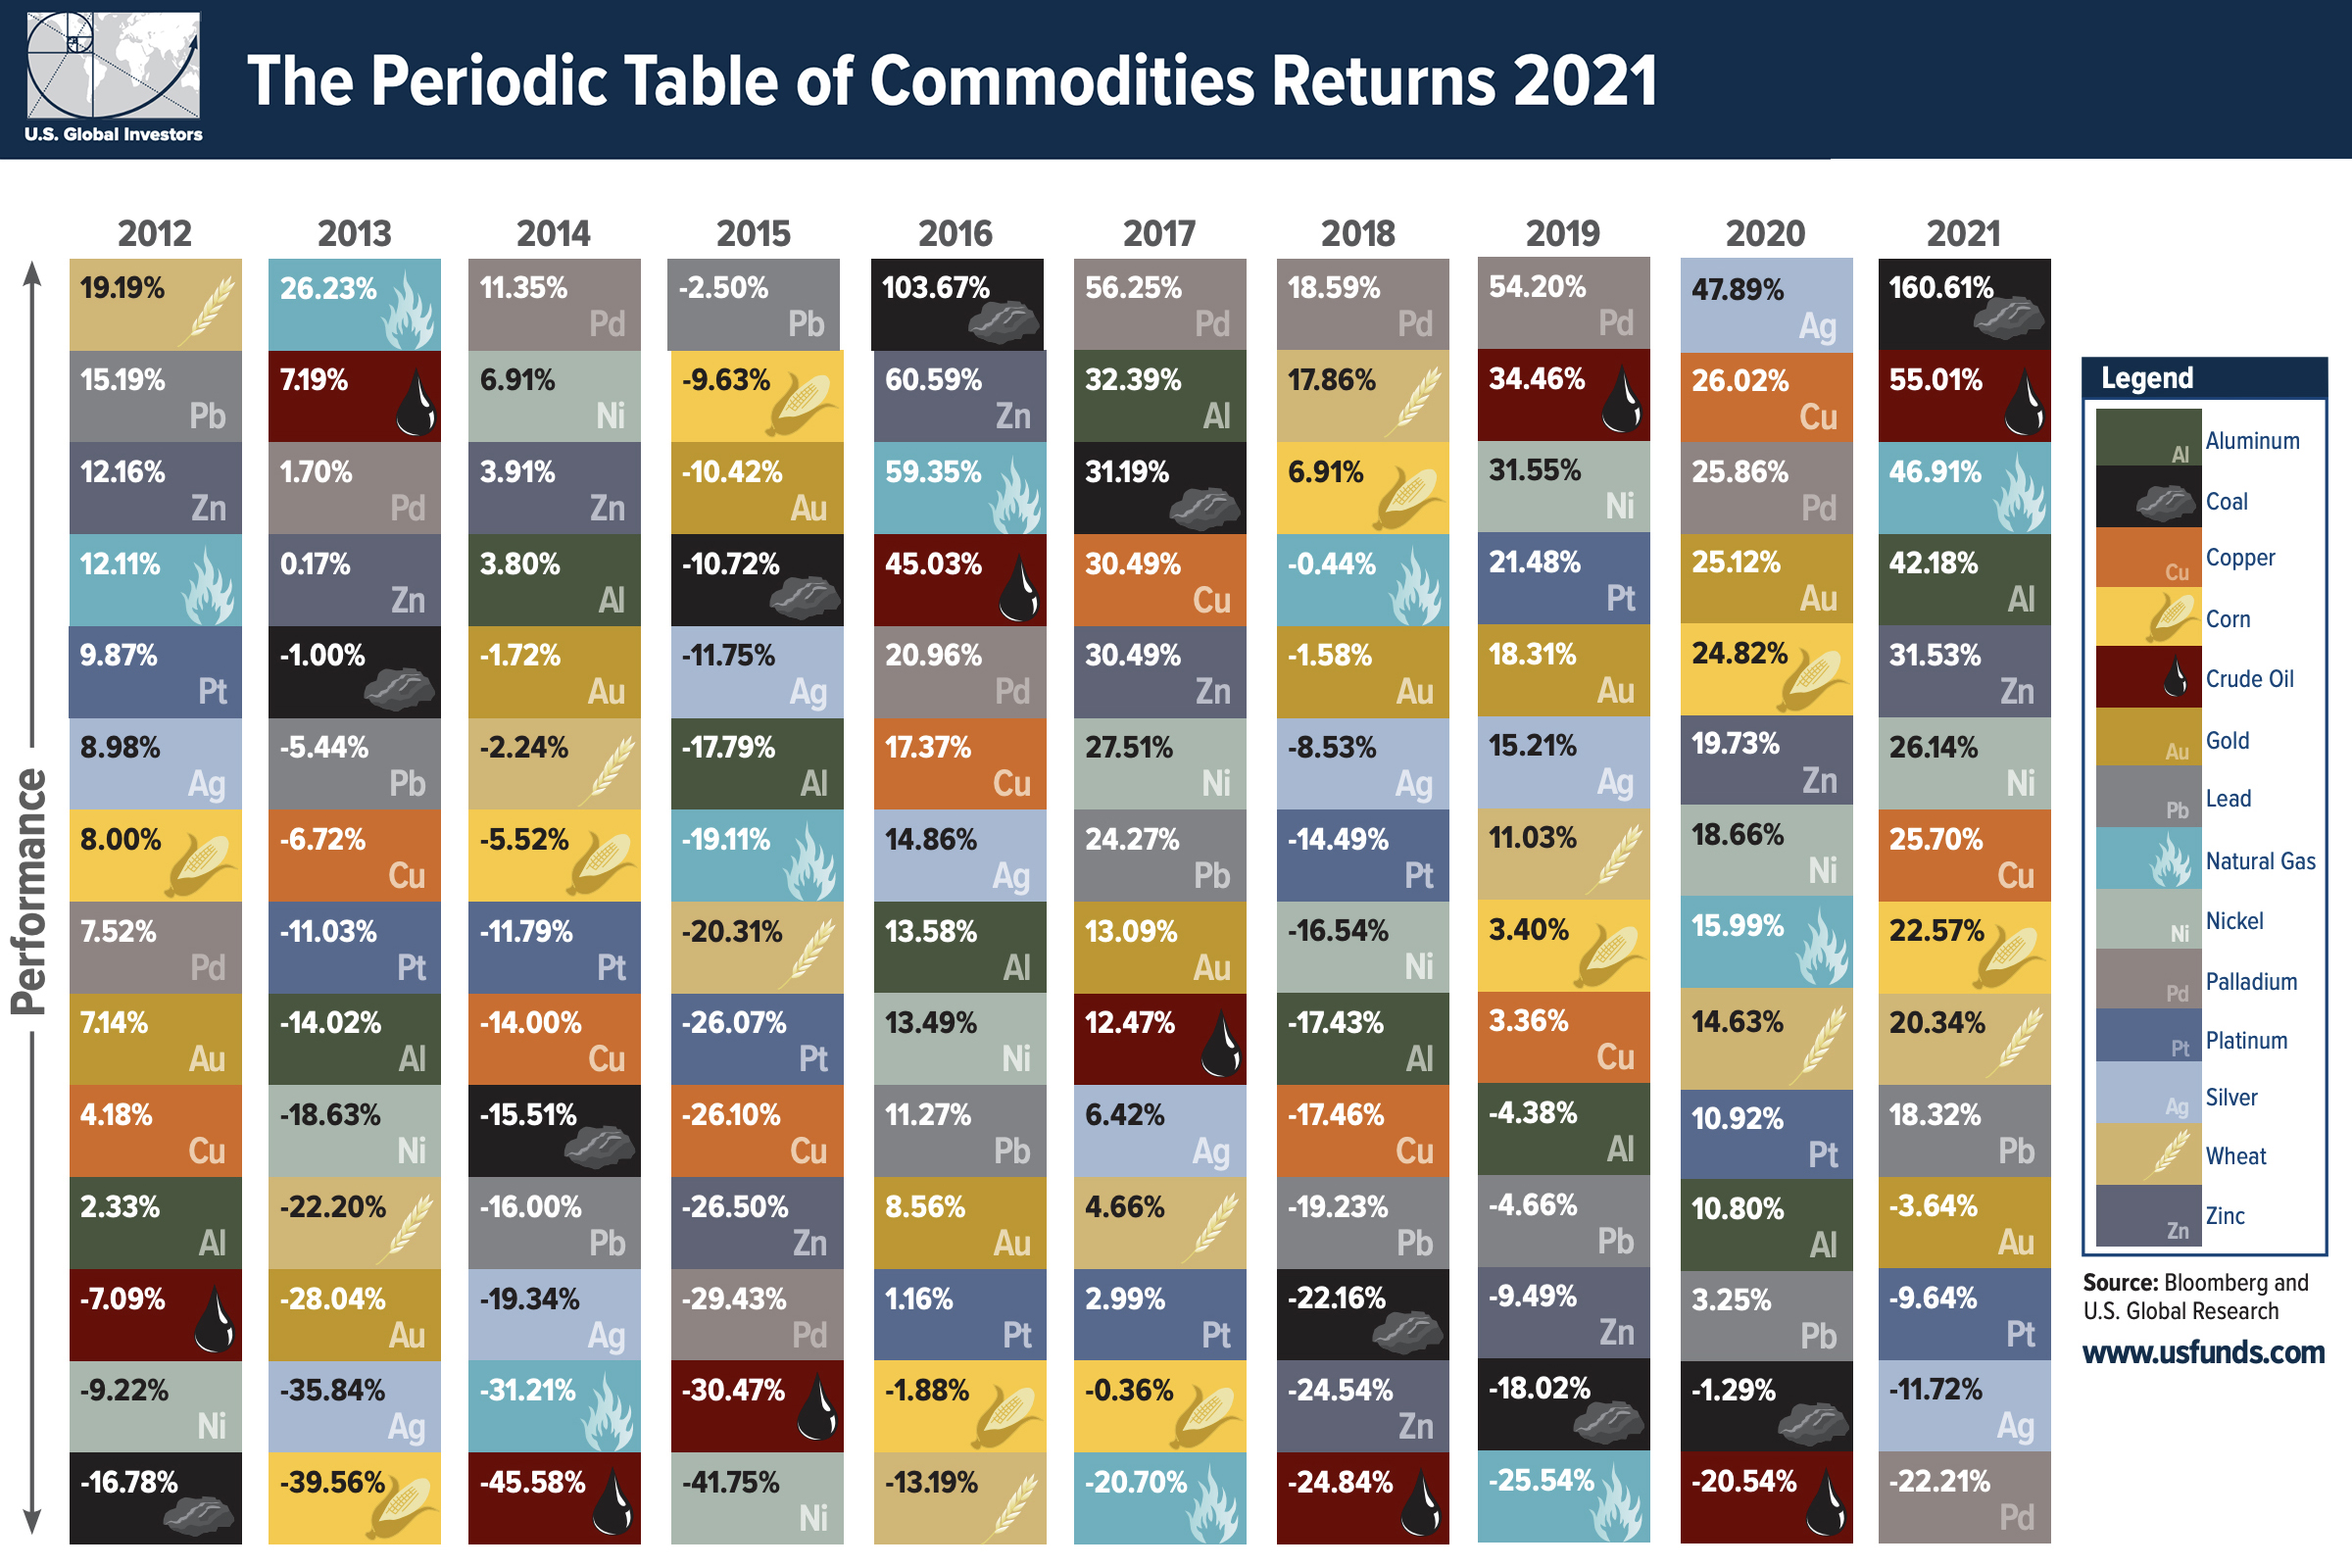
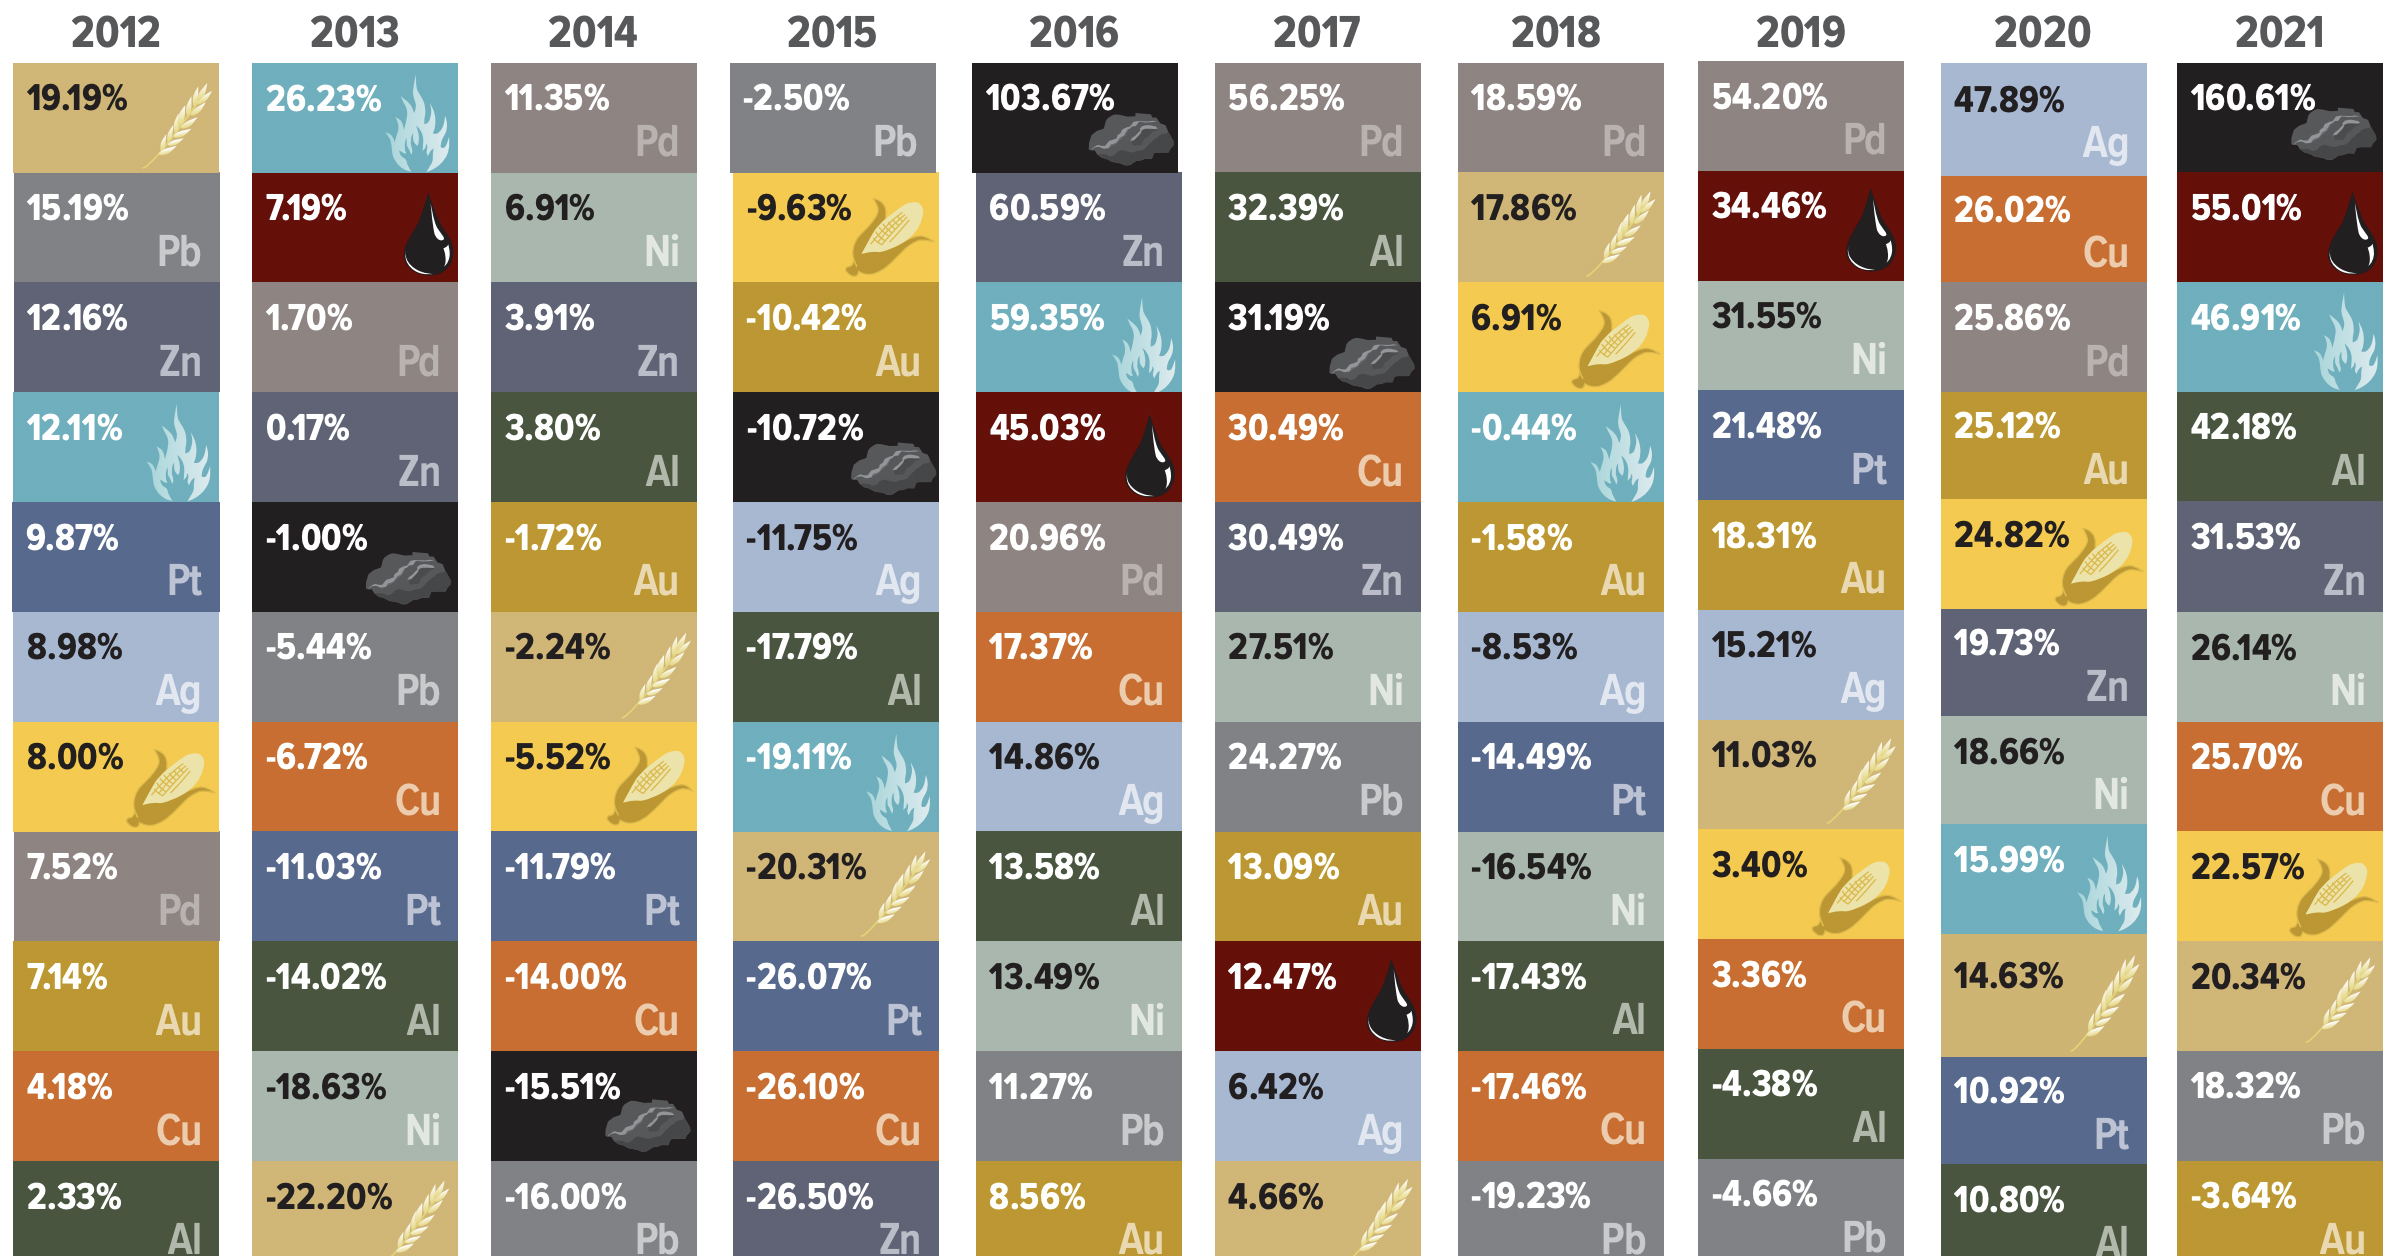
The Periodic Table of Commodity Returns (2012-2021)
The Periodic Table of Commodity Returns (2022 Edition)
For investors, 2021 was a year in which nearly every asset class finished in the green, with commodities providing some of the best returns.
The S&P Goldman Sachs Commodity Index (GSCI) was the third best-performing asset class in 2021, returning 37.1% and beating out real estate and all major equity indices.
This graphic from U.S. Global Investors tracks individual commodity returns over the past decade, ranking them based on their individual performance each year.
Commodity Prices Surge in 2021
After a strong performance from commodities (metals especially) in the year prior, 2021 was all about energy commodities.
The top three performers for 2021 were energy fuels, with coal providing the single best annual return of any commodity over the past 10 years at 160.6%. According to U.S. Global Investors, coal was also the least volatile commodity of 2021, meaning investors had a smooth ride as the fossil fuel surged in price.
| Commodity | 2021 Returns |
|---|---|
| Coal | 160.61% |
| Crude Oil | 55.01% |
| Gas | 46.91% |
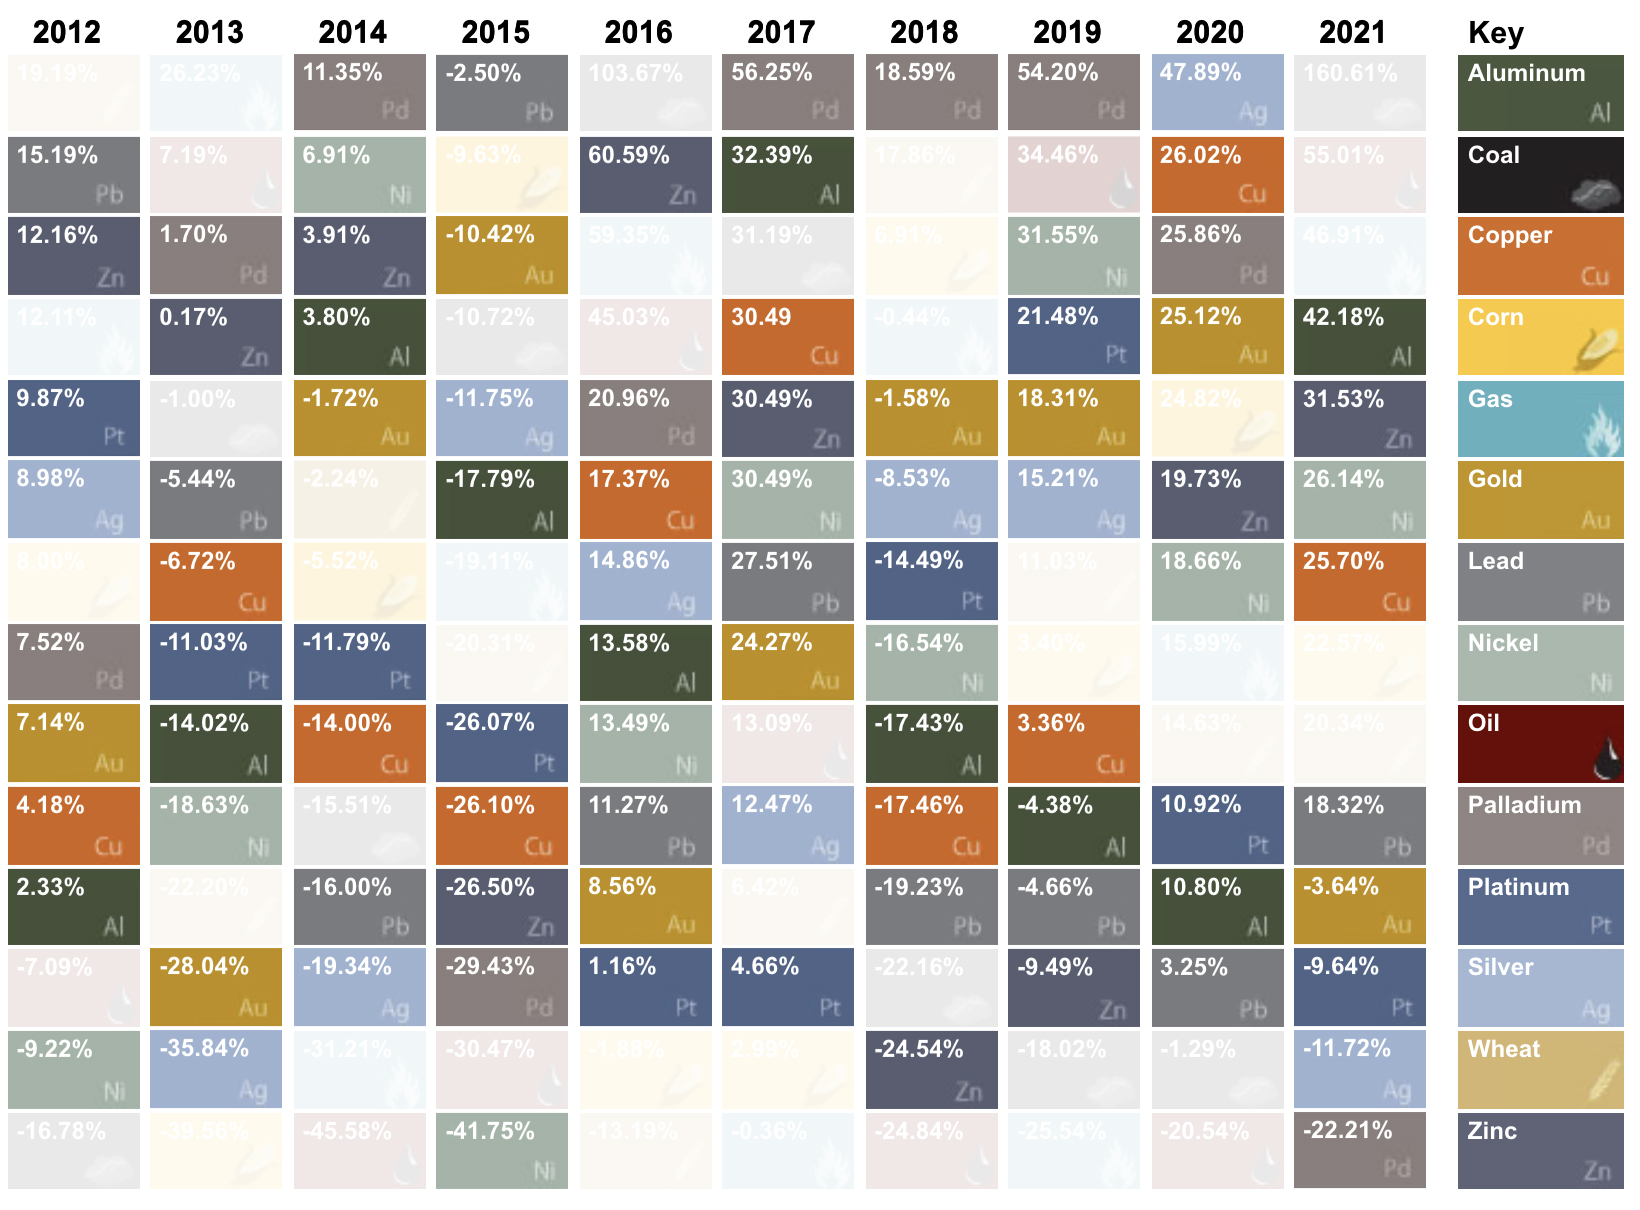
| Aluminum | 42.18% |
| Zinc | 31.53% |
| Nickel | 26.14% |
| Copper | 25.70% |
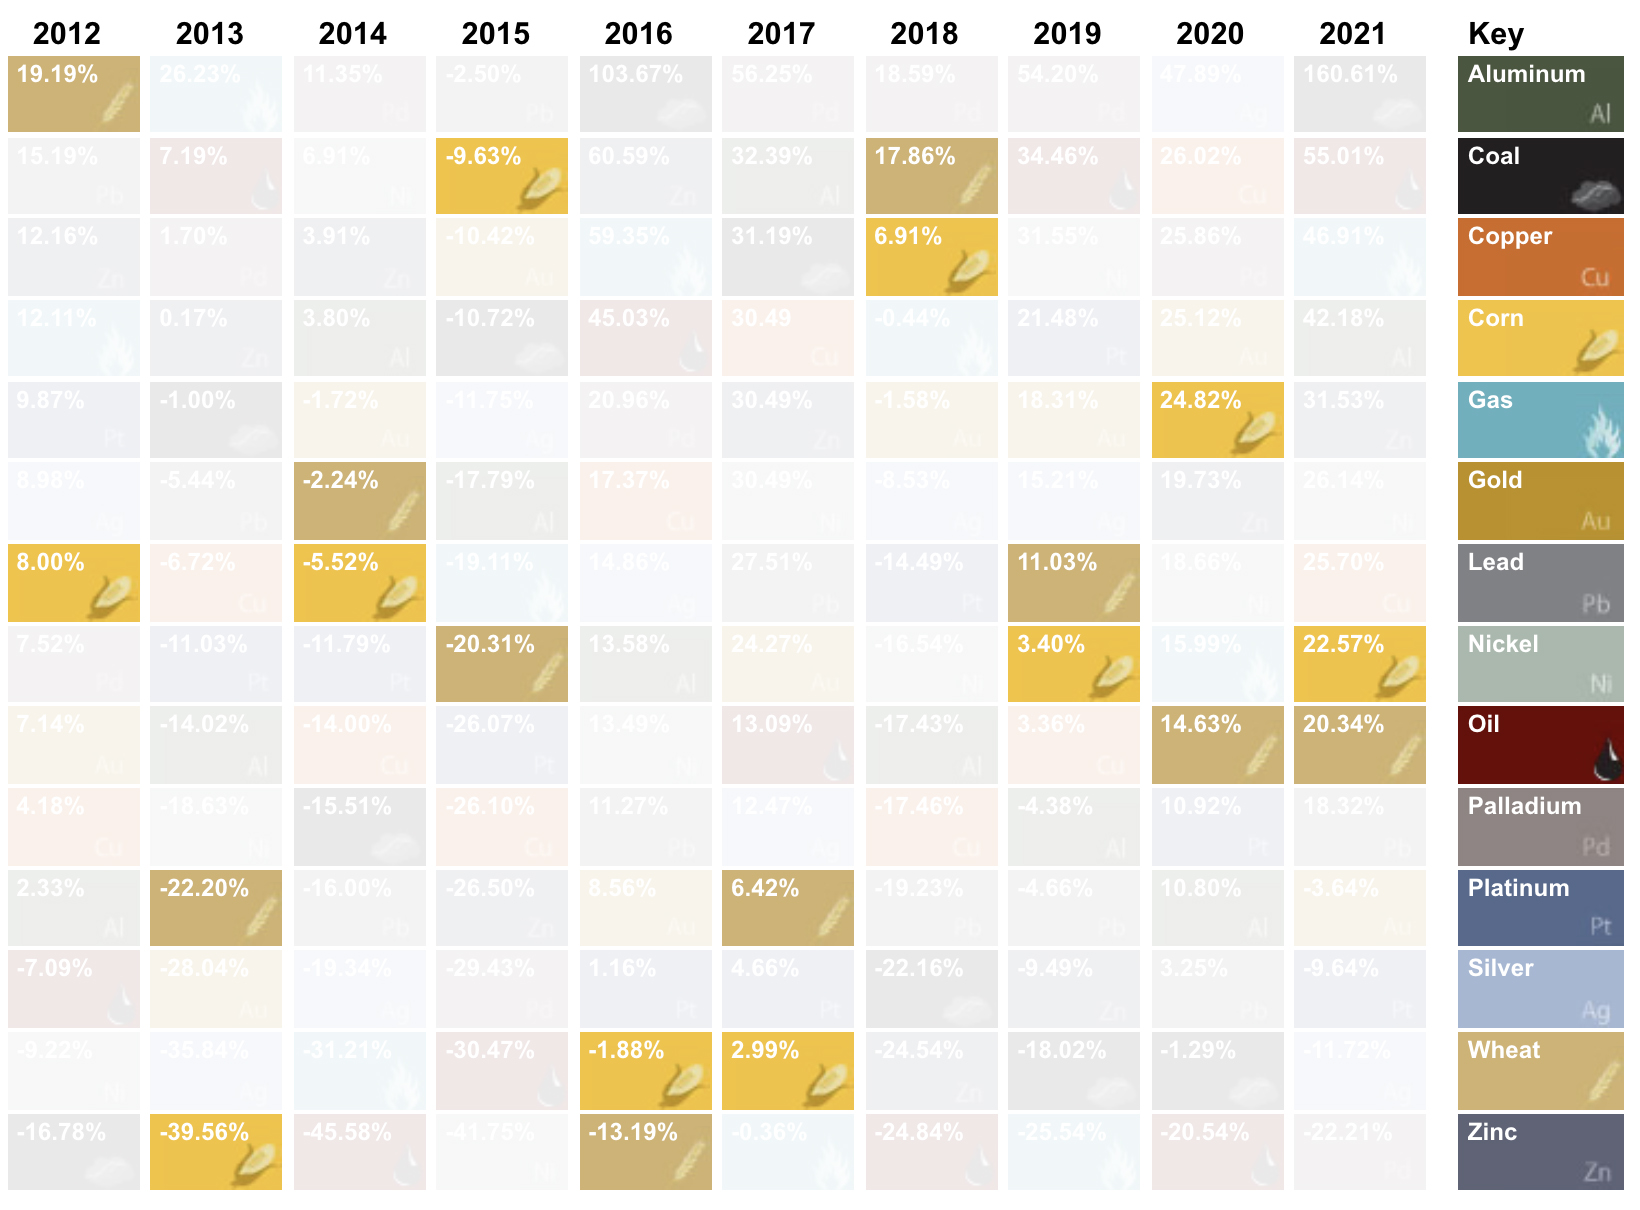
| Corn | 22.57% |
| Wheat | 20.34% |
| Lead | 18.32% |
| Gold | -3.64% |
| Platinum | -9.64% |
| Silver | -11.72% |
| Palladium | -22.21% |
Source: U.S. Global Investors
The only commodities in the red this year were precious metals, which failed to stay positive despite rising inflation across goods and asset prices. Gold and silver had returns of -3.6% and -11.7% respectively, with platinum returning -9.6% and palladium, the worst performing commodity of 2021, at -22.2%.
Aside from the precious metals, every other commodity managed double-digit positive returns, with four commodities (crude oil, coal, aluminum, and wheat) having their best single-year performances of the past decade.
Energy Commodities Outperform as the World Reopens
The partial resumption of travel and the reopening of businesses in 2021 were both powerful catalysts that fueled the price rise of energy commodities.
After crude oil’s dip into negative prices in April 2020, black gold had a strong comeback in 2021 as it returned 55.01% while being the most volatile commodity of the year.
Natural gas prices also rose significantly (46.91%), with the UK and Europe’s natural gas prices rising even more as supply constraints came up against the winter demand surge.
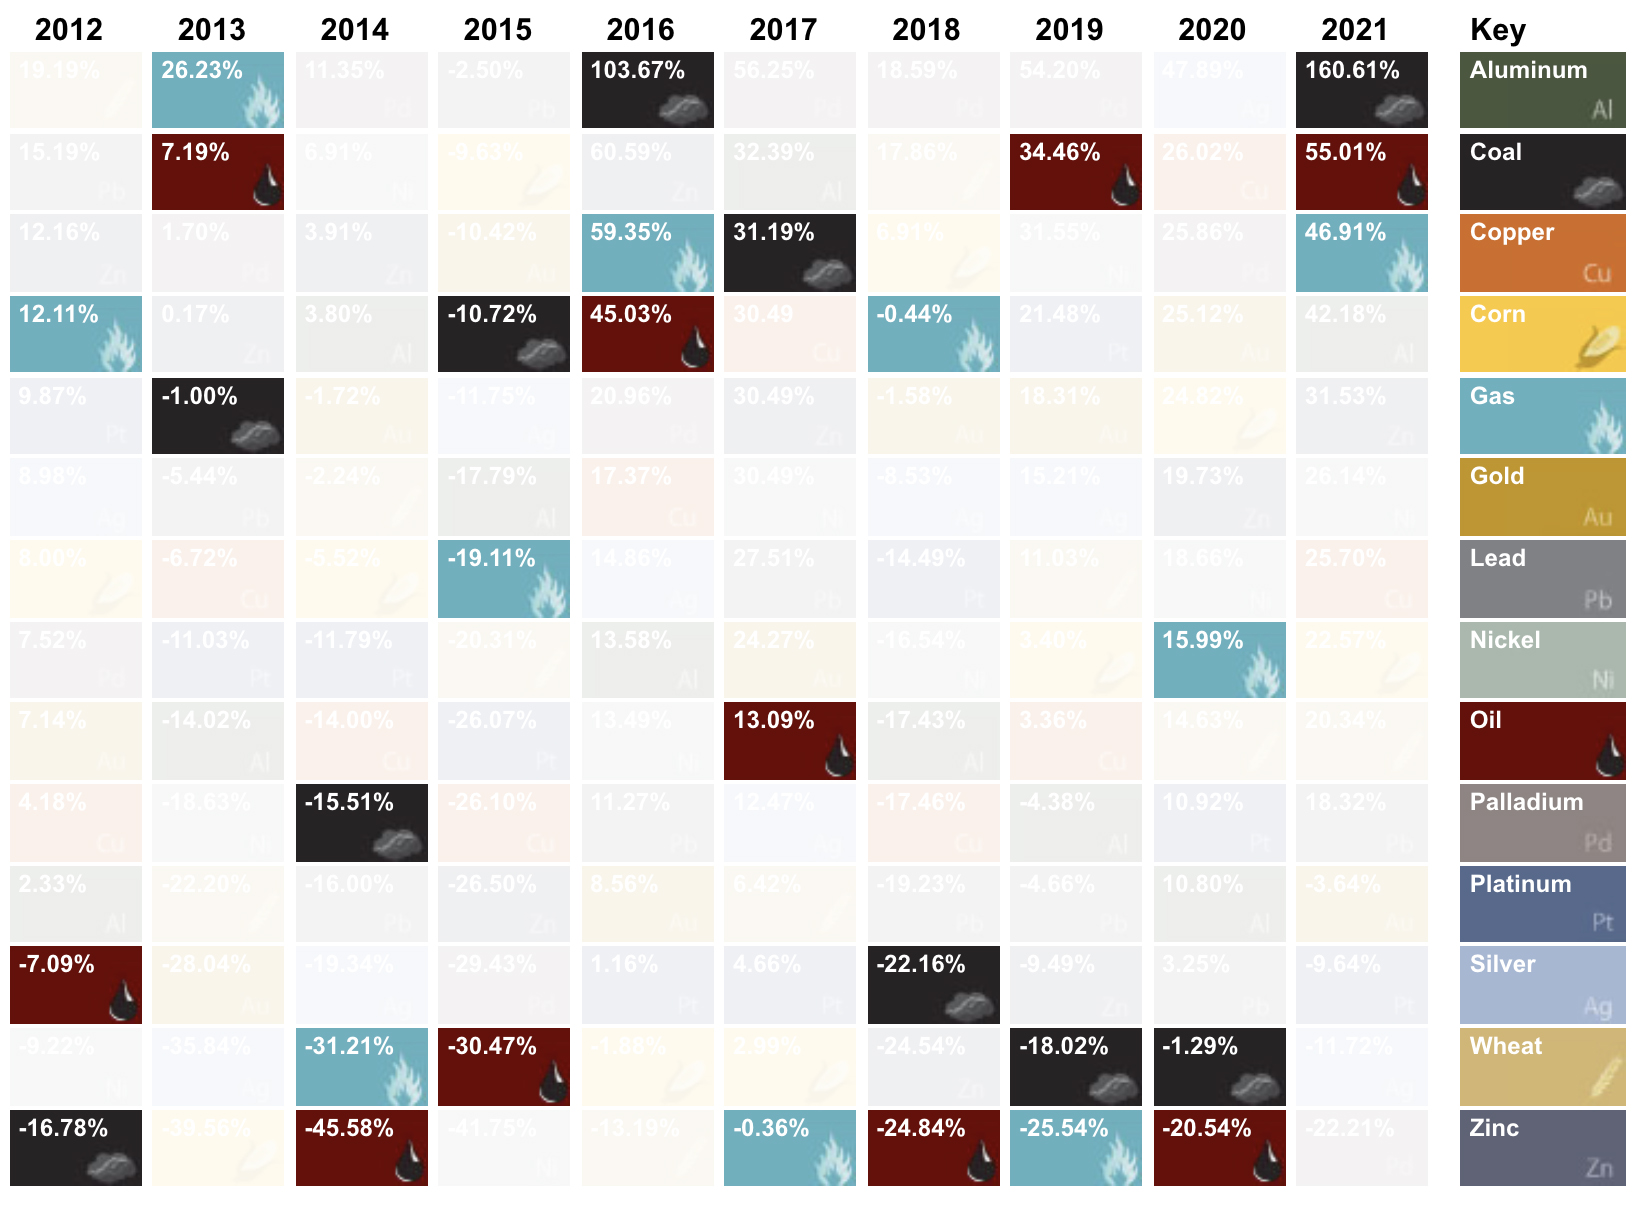
Despite being the second worst performer of 2020 with the clean energy transition on the horizon, coal was 2021’s best commodity.
High electricity demand saw coal return in style, especially in China which accounts for one-third of global coal consumption.
Base Metals Beat out Precious Metals
2021 was a tale of two metals, as precious metals and base metals had opposing returns.
Copper, nickel, zinc, aluminum, and lead, all essential for the clean energy transition, kept up last year’s positive returns as the EV batteries and renewable energy technologies caught investors’ attention.
Demand for these energy metals looks set to continue in 2022, with Tesla having already signed a $1.5 billion deal for 75,000 tonnes of nickel with Talon Metals.
On the other end of the spectrum, precious metals simply sunk like a rock last year.
Investors turned to equities, real estate, and even cryptocurrencies to preserve and grow their investments, rather than the traditionally favorable gold (-3.64%) and silver (-11.72%). Platinum and palladium also lagged behind other commodities, only returning -9.64% and -22.21% respectively.
Grains Bring Steady Gains
In a year of over and underperformers, grains kept up their steady track record and notched their fifth year in a row of positive returns.
Both corn and wheat provided double-digit returns, with corn reaching eight-year highs and wheat reaching prices not seen in over nine years. Overall, these two grains followed 2021’s trend of increasing food prices, as the UN Food and Agriculture Organization’s food price index reached a 10-year high, rising by 17.8% over the course of the year.
As inflation across commodities, assets, and consumer goods surged in 2021, investors will now be keeping a sharp eye for a pullback in 2022. We’ll have to wait and see whether or not the Fed’s plans to increase rates and taper asset purchases will manage to provide price stability in commodities.


Markets
The European Stock Market: Attractive Valuations Offer Opportunities
On average, the European stock market has valuations that are nearly 50% lower than U.S. valuations. But how can you access the market?


European Stock Market: Attractive Valuations Offer Opportunities
Europe is known for some established brands, from L’Oréal to Louis Vuitton. However, the European stock market offers additional opportunities that may be lesser known.
The above infographic, sponsored by STOXX, outlines why investors may want to consider European stocks.
Attractive Valuations
Compared to most North American and Asian markets, European stocks offer lower or comparable valuations.
| Index | Price-to-Earnings Ratio | Price-to-Book Ratio |
|---|---|---|
| EURO STOXX 50 | 14.9 | 2.2 |
| STOXX Europe 600 | 14.4 | 2 |
| U.S. | 25.9 | 4.7 |
| Canada | 16.1 | 1.8 |
| Japan | 15.4 | 1.6 |
| Asia Pacific ex. China | 17.1 | 1.8 |
Data as of February 29, 2024. See graphic for full index names. Ratios based on trailing 12 month financials. The price to earnings ratio excludes companies with negative earnings.
On average, European valuations are nearly 50% lower than U.S. valuations, potentially offering an affordable entry point for investors.
Research also shows that lower price ratios have historically led to higher long-term returns.
Market Movements Not Closely Connected
Over the last decade, the European stock market had low-to-moderate correlation with North American and Asian equities.
The below chart shows correlations from February 2014 to February 2024. A value closer to zero indicates low correlation, while a value of one would indicate that two regions are moving in perfect unison.
| EURO STOXX 50 | STOXX EUROPE 600 | U.S. | Canada | Japan | Asia Pacific ex. China |
|
|---|---|---|---|---|---|---|
| EURO STOXX 50 | 1.00 | 0.97 | 0.55 | 0.67 | 0.24 | 0.43 |
| STOXX EUROPE 600 | 1.00 | 0.56 | 0.71 | 0.28 | 0.48 | |
| U.S. | 1.00 | 0.73 | 0.12 | 0.25 | ||
| Canada | 1.00 | 0.22 | 0.40 | |||
| Japan | 1.00 | 0.88 | ||||
| Asia Pacific ex. China | 1.00 |
Data is based on daily USD returns.
European equities had relatively independent market movements from North American and Asian markets. One contributing factor could be the differing sector weights in each market. For instance, technology makes up a quarter of the U.S. market, but health care and industrials dominate the broader European market.
Ultimately, European equities can enhance portfolio diversification and have the potential to mitigate risk for investors.
Tracking the Market
For investors interested in European equities, STOXX offers a variety of flagship indices:
| Index | Description | Market Cap |
|---|---|---|
| STOXX Europe 600 | Pan-regional, broad market | €10.5T |
| STOXX Developed Europe | Pan-regional, broad-market | €9.9T |
| STOXX Europe 600 ESG-X | Pan-regional, broad market, sustainability focus | €9.7T |
| STOXX Europe 50 | Pan-regional, blue-chip | €5.1T |
| EURO STOXX 50 | Eurozone, blue-chip | €3.5T |
Data is as of February 29, 2024. Market cap is free float, which represents the shares that are readily available for public trading on stock exchanges.
The EURO STOXX 50 tracks the Eurozone’s biggest and most traded companies. It also underlies one of the world’s largest ranges of ETFs and mutual funds. As of November 2023, there were €27.3 billion in ETFs and €23.5B in mutual fund assets under management tracking the index.
“For the past 25 years, the EURO STOXX 50 has served as an accurate, reliable and tradable representation of the Eurozone equity market.”
— Axel Lomholt, General Manager at STOXX
Partnering with STOXX to Track the European Stock Market
Are you interested in European equities? STOXX can be a valuable partner:
- Comprehensive, liquid and investable ecosystem
- European heritage, global reach
- Highly sophisticated customization capabilities
- Open architecture approach to using data
- Close partnerships with clients
- Part of ISS STOXX and Deutsche Börse Group
With a full suite of indices, STOXX can help you benchmark against the European stock market.
Learn how STOXX’s European indices offer liquid and effective market access.

-

 Economy3 days ago
Economic Growth Forecasts for G7 and BRICS Countries in 2024
The IMF has released its economic growth forecasts for 2024. How do the G7 and BRICS countries compare?
-

 Markets2 weeks ago
U.S. Debt Interest Payments Reach $1 Trillion
U.S. debt interest payments have surged past the $1 trillion dollar mark, amid high interest rates and an ever-expanding debt burden.
-

 United States2 weeks ago
Ranked: The Largest U.S. Corporations by Number of Employees
We visualized the top U.S. companies by employees, revealing the massive scale of retailers like Walmart, Target, and Home Depot.
-

 Markets2 weeks ago
The Top 10 States by Real GDP Growth in 2023
This graphic shows the states with the highest real GDP growth rate in 2023, largely propelled by the oil and gas boom.
-

 Markets2 weeks ago
Ranked: The World’s Top Flight Routes, by Revenue
In this graphic, we show the highest earning flight routes globally as air travel continued to rebound in 2023.
-

 Markets3 weeks ago
Ranked: The Most Valuable Housing Markets in America
The U.S. residential real estate market is worth a staggering $47.5 trillion. Here are the most valuable housing markets in the country.


-

 Debt1 week ago
How Debt-to-GDP Ratios Have Changed Since 2000
-
Markets2 weeks ago
Ranked: The World’s Top Flight Routes, by Revenue
-

 Countries2 weeks ago
Population Projections: The World’s 6 Largest Countries in 2075
-
Markets2 weeks ago
The Top 10 States by Real GDP Growth in 2023
-

 Demographics2 weeks ago
The Smallest Gender Wage Gaps in OECD Countries
-

 United States2 weeks ago
Where U.S. Inflation Hit the Hardest in March 2024
-

 Green2 weeks ago
Top Countries By Forest Growth Since 2001
-
United States2 weeks ago
Ranked: The Largest U.S. Corporations by Number of Employees