Energy
Visualizing 25 Years of Lithium Production, by Country
![]() Subscribe to the Elements free mailing list for more like this
Subscribe to the Elements free mailing list for more like this
 Can I share this graphic?
 When do I need a license?
 Interested in this piece?
Lithium Production by Country (1995-2021)
This was originally posted on Elements. Sign up to the free mailing list to get beautiful visualizations on natural resource megatrends in your email every week.
Lithium is often dubbed as “white gold” for electric vehicles.
The lightweight metal plays a key role in the cathodes of all types of lithium-ion batteries that power EVs. Accordingly, the recent rise in EV adoption has sent lithium production to new highs.
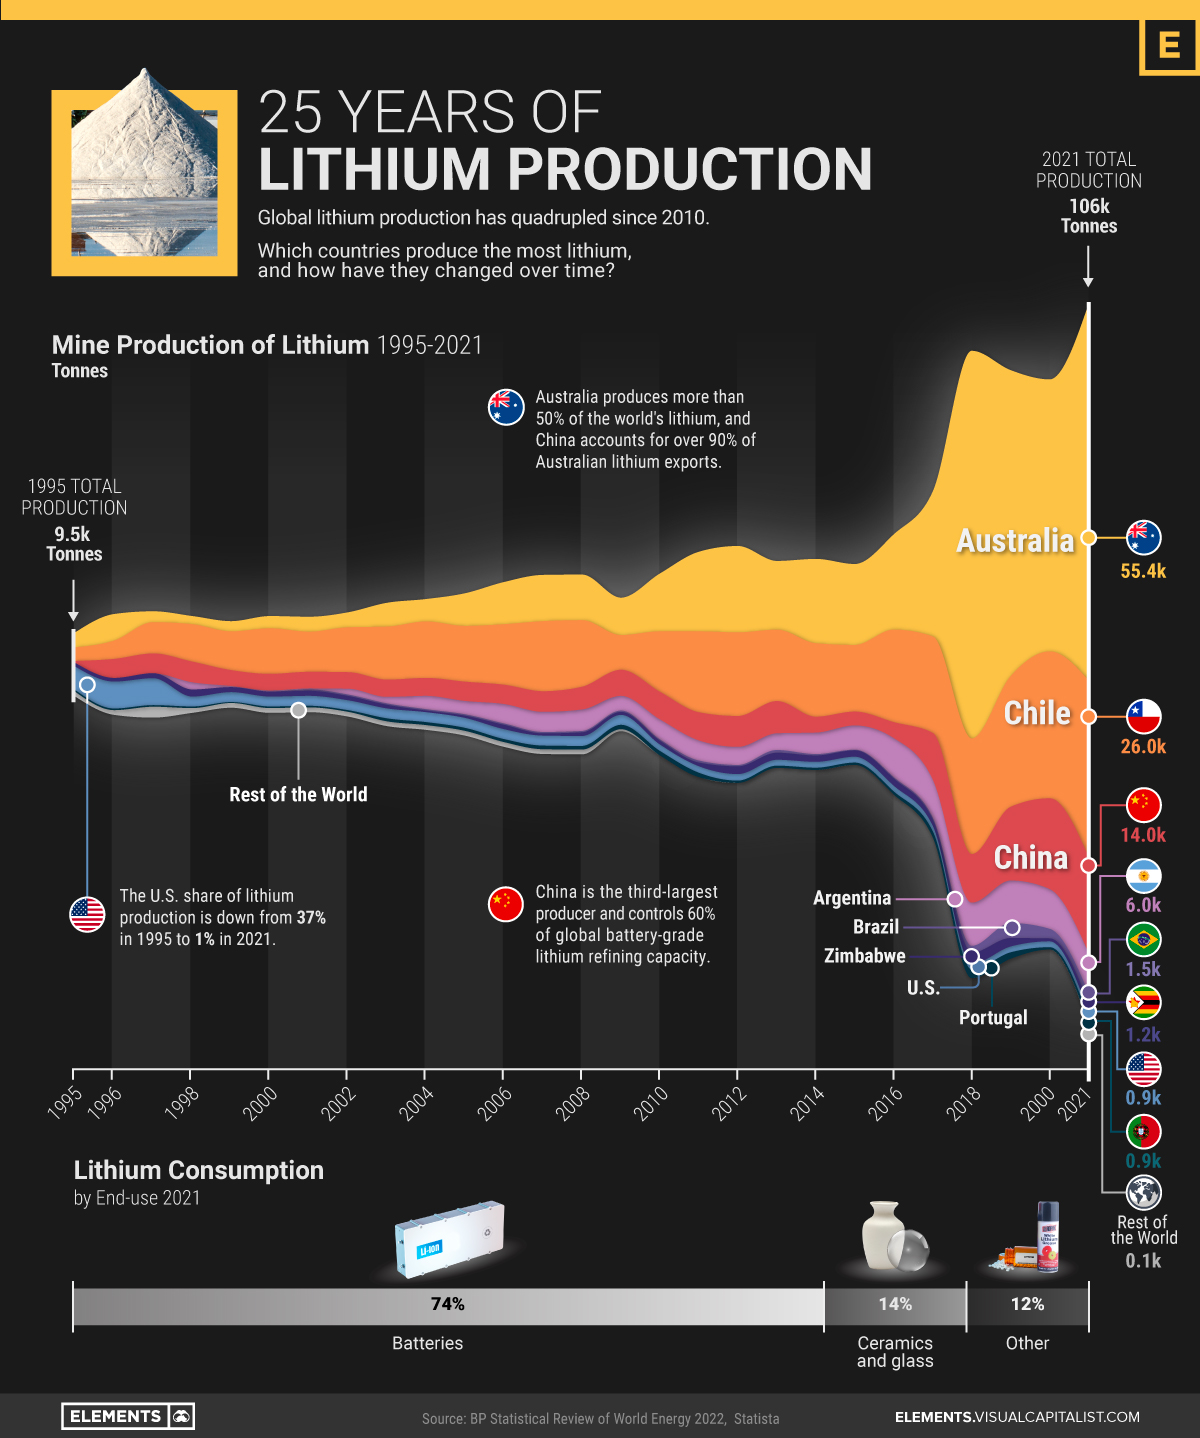
The above infographic charts more than 25 years of lithium production by country from 1995 to 2021, based on data from BP’s Statistical Review of World Energy.
The Largest Lithium Producers Over Time
In the 1990s, the U.S. was the largest producer of lithium, in stark contrast to the present.
In fact, the U.S. accounted for over one-third of global lithium production in 1995. From then onwards until 2010, Chile took over as the biggest producer with a production boom in the Salar de Atacama, one of the world’s richest lithium brine deposits.
Global lithium production surpassed 100,000 tonnes for the first time in 2021, quadrupling from 2010. What’s more, roughly 90% of it came from just three countries.
| Rank | Country | 2021 Production (tonnes) | % of Total |
|---|---|---|---|
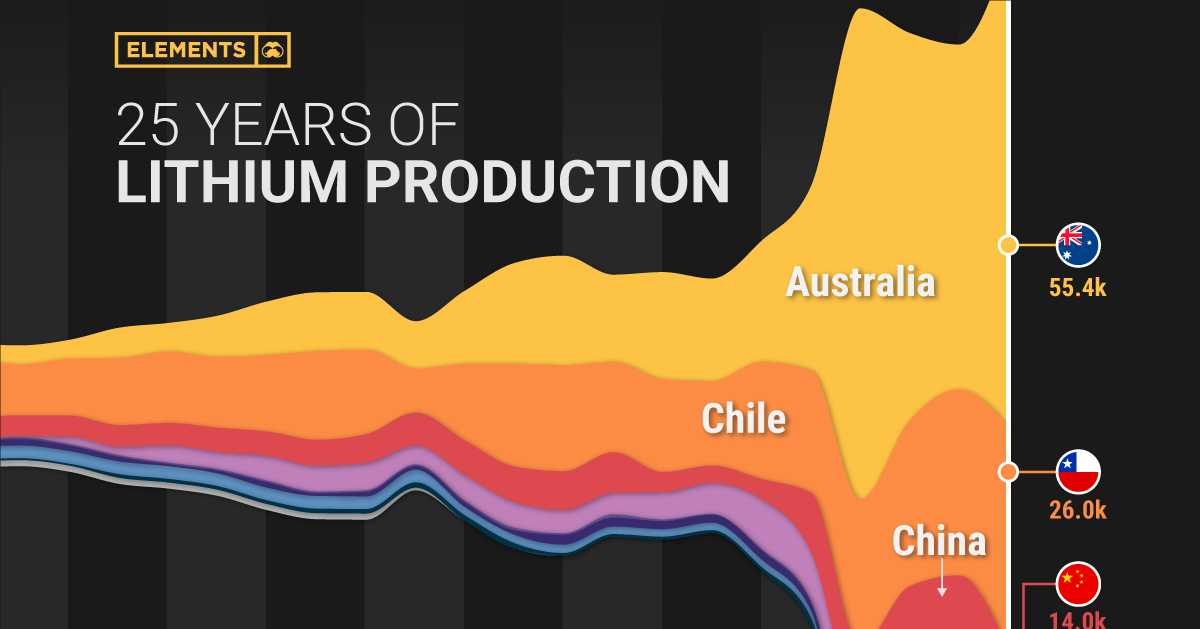
| #1 | Australia 🇦🇺 | 55,416 | 52% |
| #2 | Chile 🇨🇱 | 26,000 | 25% |
| #3 | China 🇨🇳 | 14,000 | 13% |
| #4 | Argentina 🇦🇷 | 5,967 | 6% |
| #5 | Brazil 🇧🇷 | 1,500 | 1% |
| #6 | Zimbabwe 🇿🇼 | 1,200 | 1% |
| #7 | Portugal 🇵🇹 | 900 | 1% |
| #8 | United States 🇺🇸 | 900 | 1% |
| Rest of World 🌍 | 102 | 0.1% | |
| Total | 105,984 | 100% |
Australia alone produces 52% of the world’s lithium. Unlike Chile, where lithium is extracted from brines, Australian lithium comes from hard-rock mines for the mineral spodumene.
China, the third-largest producer, has a strong foothold in the lithium supply chain. Alongside developing domestic mines, Chinese companies have acquired around $5.6 billion worth of lithium assets in countries like Chile, Canada, and Australia over the last decade. It also hosts 60% of the world’s lithium refining capacity for batteries.
Batteries have been one of the primary drivers of the exponential increase in lithium production. But how much lithium do batteries use, and how much goes into other uses?
What is Lithium Used For?
While lithium is best known for its role in rechargeable batteries—and rightly so—it has many other important uses.
Before EVs and lithium-ion batteries transformed the demand for lithium, the metal’s end-uses looked completely different as compared to today.
| End-use | Lithium Consumption 2010 (%) | Lithium Consumption 2021 (%) |
|---|---|---|
| Batteries | 23% | 74% |
| Ceramics and glass | 31% | 14% |
| Lubricating greases | 10% | 3% |
| Air treatment | 5% | 1% |
| Continuous casting | 4% | 2% |
| Other | 27% | 6% |
| Total | 100% | 100% |
In 2010, ceramics and glass accounted for the largest share of lithium consumption at 31%. In ceramics and glassware, lithium carbonate increases strength and reduces thermal expansion, which is often essential for modern glass-ceramic cooktops.
Lithium is also used to make lubricant greases for the transport, steel, and aviation industries, along with other lesser-known uses.
The Future of Lithium Production
As the world produces more batteries and EVs, the demand for lithium is projected to reach 1.5 million tonnes of lithium carbonate equivalent (LCE) by 2025 and over 3 million tonnes by 2030.
For context, the world produced 540,000 tonnes of LCE in 2021. Based on the above demand projections, production needs to triple by 2025 and increase nearly six-fold by 2030.
Although supply has been on an exponential growth trajectory, it can take anywhere from six to more than 15 years for new lithium projects to come online. As a result, the lithium market is projected to be in a deficit for the next few years.


Energy
Charted: 4 Reasons Why Lithium Could Be the Next Gold Rush
Visual Capitalist has partnered with EnergyX to show why drops in prices and growing demand may make now the right time to invest in lithium.


4 Reasons Why You Should Invest in Lithium
Lithium’s importance in powering EVs makes it a linchpin of the clean energy transition and one of the world’s most precious minerals.
In this graphic, Visual Capitalist partnered with EnergyX to explore why now may be the time to invest in lithium.
1. Lithium Prices Have Dropped
One of the most critical aspects of evaluating an investment is ensuring that the asset’s value is higher than its price would indicate. Lithium is integral to powering EVs, and, prices have fallen fast over the last year:
| Date | LiOH·H₂O* | Li₂CO₃** |
|---|---|---|
| Feb 2023 | $76 | $71 |
| March 2023 | $71 | $61 |
| Apr 2023 | $43 | $33 |
| May 2023 | $43 | $33 |
| June 2023 | $47 | $45 |
| July 2023 | $44 | $40 |
| Aug 2023 | $35 | $35 |
| Sept 2023 | $28 | $27 |
| Oct 2023 | $24 | $23 |
| Nov 2023 | $21 | $21 |
| Dec 2023 | $17 | $16 |
| Jan 2024 | $14 | $15 |
| Feb 2024 | $13 | $14 |
Note: Monthly spot prices were taken as close to the 14th of each month as possible.
*Lithium hydroxide monohydrate MB-LI-0033
**Lithium carbonate MB-LI-0029
2. Lithium-Ion Battery Prices Are Also Falling
The drop in lithium prices is just one reason to invest in the metal. Increasing economies of scale, coupled with low commodity prices, have caused the cost of lithium-ion batteries to drop significantly as well.
In fact, BNEF reports that between 2013 and 2023, the price of a Li-ion battery dropped by 82%.
| Year | Price per KWh |
|---|---|
| 2023 | $139 |
| 2022 | $161 |
| 2021 | $150 |
| 2020 | $160 |
| 2019 | $183 |
| 2018 | $211 |
| 2017 | $258 |
| 2016 | $345 |
| 2015 | $448 |
| 2014 | $692 |
| 2013 | $780 |

3. EV Adoption is Sustainable
One of the best reasons to invest in lithium is that EVs, one of the main drivers behind the demand for lithium, have reached a price point similar to that of traditional vehicle.
According to the Kelly Blue Book, Tesla’s average transaction price dropped by 25% between 2022 and 2023, bringing it in line with many other major manufacturers and showing that EVs are a realistic transport option from a consumer price perspective.
| Manufacturer | September 2022 | September 2023 |
|---|---|---|
| BMW | $69,000 | $72,000 |
| Ford | $54,000 | $56,000 |
| Volkswagon | $54,000 | $56,000 |
| General Motors | $52,000 | $53,000 |
| Tesla | $68,000 | $51,000 |
4. Electricity Demand in Transport is Growing
As EVs become an accessible transport option, there’s an investment opportunity in lithium. But possibly the best reason to invest in lithium is that the IEA reports global demand for the electricity in transport could grow dramatically by 2030:
| Transport Type | 2022 | 2025 | 2030 |
|---|---|---|---|
| Buses 🚌 | 23,000 GWh | 50,000 GWh | 130,000 GWh |
| Cars 🚙 | 65,000 GWh | 200,000 GWh | 570,000 GWh |
| Trucks 🛻 | 4,000 GWh | 15,000 GWh | 94,000 GWh |
| Vans 🚐 | 6,000 GWh | 16,000 GWh | 72,000 GWh |
The Lithium Investment Opportunity
Lithium presents a potentially classic investment opportunity. Lithium and battery prices have dropped significantly, and recently, EVs have reached a price point similar to other vehicles. By 2030, the demand for clean energy, especially in transport, will grow dramatically.
With prices dropping and demand skyrocketing, now is the time to invest in lithium.
EnergyX is poised to exploit lithium demand with cutting-edge lithium extraction technology capable of extracting 300% more lithium than current processes.

-

 Lithium4 days ago
Ranked: The Top 10 EV Battery Manufacturers in 2023
Asia dominates this ranking of the world’s largest EV battery manufacturers in 2023.
-

 Energy1 week ago
The World’s Biggest Nuclear Energy Producers
China has grown its nuclear capacity over the last decade, now ranking second on the list of top nuclear energy producers.
-

 Energy1 month ago
The World’s Biggest Oil Producers in 2023
Just three countries accounted for 40% of global oil production last year.
-

 Energy1 month ago
How Much Does the U.S. Depend on Russian Uranium?
Currently, Russia is the largest foreign supplier of nuclear power fuel to the U.S.
-

 Uranium2 months ago
Charted: Global Uranium Reserves, by Country
We visualize the distribution of the world’s uranium reserves by country, with 3 countries accounting for more than half of total reserves.
-

 Energy3 months ago
Visualizing the Rise of the U.S. as Top Crude Oil Producer
Over the last decade, the United States has established itself as the world’s top producer of crude oil, surpassing Saudi Arabia and Russia.
-

 Debt1 week ago
How Debt-to-GDP Ratios Have Changed Since 2000
-

 Markets2 weeks ago
Ranked: The World’s Top Flight Routes, by Revenue
-

 Countries2 weeks ago
Population Projections: The World’s 6 Largest Countries in 2075
-

 Markets2 weeks ago
The Top 10 States by Real GDP Growth in 2023
-

 Demographics2 weeks ago
The Smallest Gender Wage Gaps in OECD Countries
-

 United States2 weeks ago
Where U.S. Inflation Hit the Hardest in March 2024
-

 Green2 weeks ago
Top Countries By Forest Growth Since 2001
-

 United States2 weeks ago
Ranked: The Largest U.S. Corporations by Number of Employees