Commodities
Top U.S. Food Imports by Origin Country
Article/Editing:
![]() 2nd Place Winner of the 2023 Creator Program Challenge.
2nd Place Winner of the 2023 Creator Program Challenge.
Top U.S. Food Imports by Origin Country
The U.S. is a major producer and exporter of food products, but did you know that it’s also one of the world’s largest food importers?
Due to seasonality and climate, some foods can’t be grown on home soil, at least enough to fulfill consumption demands. Indeed, many familiar grocery items come from other countries.
This infographic from Julie Peasley uses data from the Chatham House Resource Trade Database (CHRTD) to show where the U.S. gets its food from, highlighting the top exporting countries of various imported food items.
The Types of Imported Foods
The U.S. imported around $148 billion worth of agricultural products in 2020, and according to the USDA, this has since risen to $194 billion in 2022.
Around 50% of all U.S. agricultural imports are horticultural products like fruits, vegetables, tree nuts, and more. Other large import categories include sugar and tropical products, meat, grains, and oilseeds.
With that context in mind, we break down each category and highlight the five foods with the largest single-origin import value.
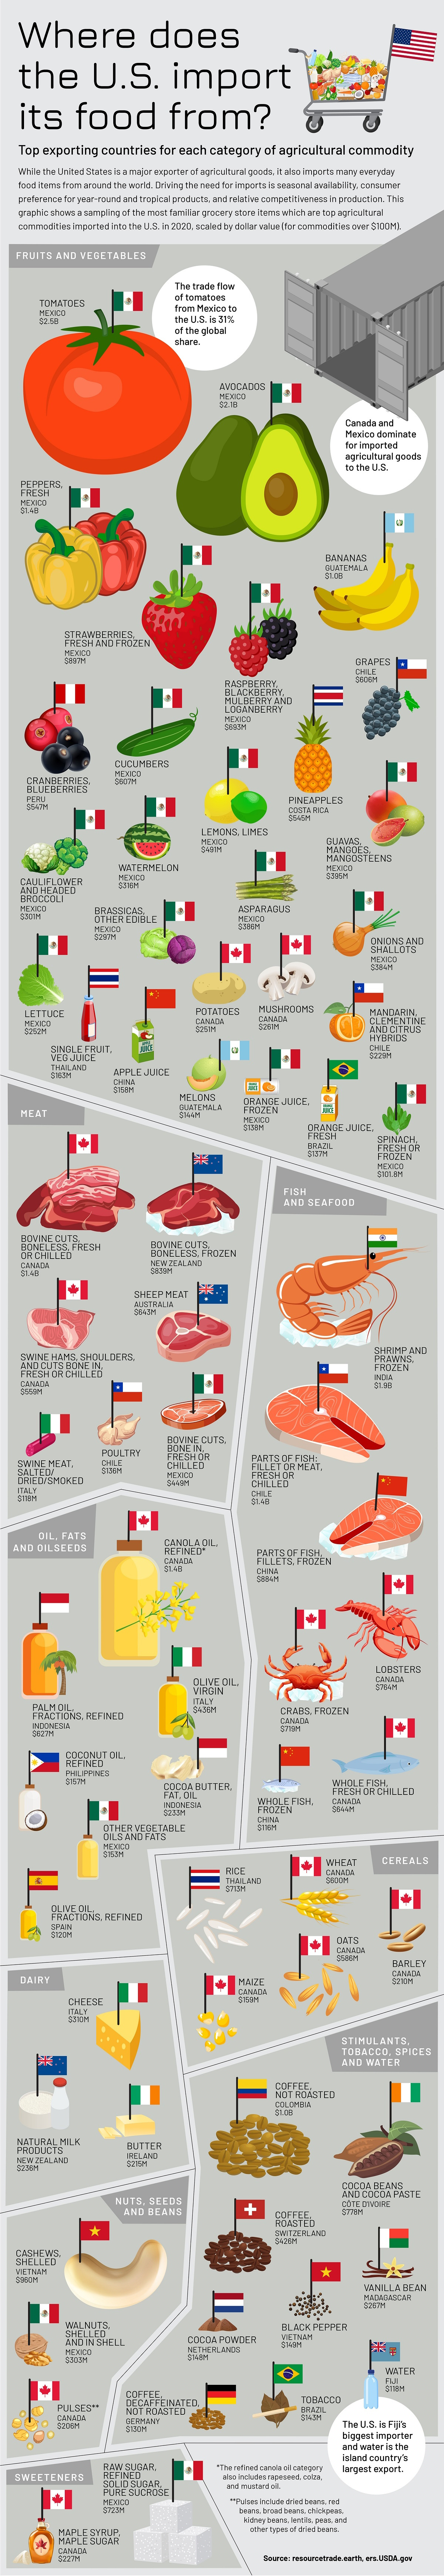
Farm Fresh: Fruit and Vegetable Imports
U.S. fruit and vegetable imports have been on a steady rise since 2000. In fact, between 2011 and 2021, fruits and nuts imports made up 44% of domestic consumption, while 35% of vegetables consumed in the U.S. came from outside the country.
Mexico is by far the largest exporter of fruits and vegetables to the United States.
| Fruit or Vegetable | Largest Exporting Country | U.S. Import Value (2020) |
|---|---|---|
| Tomatoes | 🇲🇽 Mexico | $2.5B |
| Avocados | 🇲🇽 Mexico | $2.1B |
| Peppers | 🇲🇽 Mexico | $1.4B |
| Bananas | 🇬🇹 Guatemala | $1.0B |
| Strawberries | 🇲🇽 Mexico | $897M |
The U.S. imported $2.5 billion worth of tomatoes from Mexico in 2020, representing 31% of international tomato trade. Avocados, native to central Mexico, were nearly as popular with $2.1 billion worth of imports.
Generally, the largest exporters of fruits and vegetables to the U.S. are North and South American countries, with products often coming from Guatemala, Chile, Peru, Costa Rica, and Brazil.
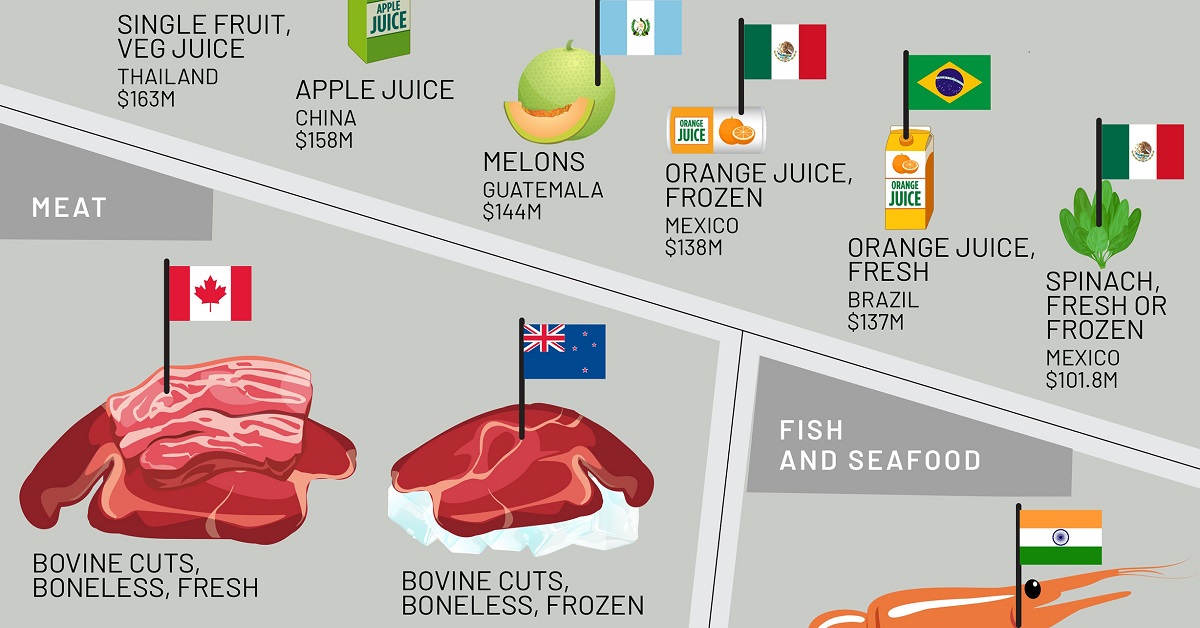
Beefed Up: Meat Imports
The U.S. is the world’s largest overall consumer of beef (or bovine meat), and the third-largest per capita consumer at nearly 37.9 kg (84 lbs) per person per year.
Therefore, despite being one of the top producers of beef, the country still imports a lot of it.
| Meat | Largest Exporting Country | U.S. Import Value (2020) |
|---|---|---|
| Bovine Cuts | 🇨🇦 Canada | $1.4B |
| Bovine Cuts, Frozen | 🇳🇿 New Zealand | $839M |
| Sheep Meat | 🇦🇺 Australia | $643M |
| Swine Hams, Shoulders, and Cuts | 🇨🇦 Canada | $559M |
| Bovine Cuts, Bone In | 🇲🇽 Mexico | $449M |
Precisely, The U.S. imported $8.7 billion worth of meat in 2020. Canada was the largest source of imported beef, with the U.S. accounting for more than 70% of all Canadian beef exports.
The sources of meat imports are more geographically diverse than fruits and vegetables, with billions of dollars of imports coming from New Zealand and Australia.
Making Waves: Seafood Imports
Despite plenty of coastlines, the U.S. imports 70–85% of all its seafood and accounted for 15% of global seafood imports in 2020 at $21.8 billion.
Frozen shrimp and prawns were the top seafood import, with $1.9 billion worth from India.
| Fish and Seafood | Largest Exporting Country | U.S. Import Value (2020) |
|---|---|---|
| Shrimp and Prawns, Frozen | 🇮🇳 India | $1.9B |
| Fish Fillet or Meat | 🇨🇱 Chile | $1.4B |
| Fish Fillet or Meat, Frozen | 🇨🇳 China | $884M |
| Lobsters | 🇨🇦 Canada | $764M |
| Crabs, Frozen | 🇨🇦 Canada | $719M |
The largest source of U.S. seafood imports overall with $3.1 billion total was Canada, which leads in lobster, crab, and whole fish imports. It was followed by Chile at $2.1 billion, primarily for parts of fish (fillet or meat, fresh or chilled).
Other Foods: Oils, Grains, Coffee, and More
There are plenty of other types of foods and agricultural products that the U.S. relies on other countries for. Here are the largest single-origin U.S. food imports for the remaining categories:
| Food | Category | Largest Exporting Country | U.S. Import Value (2020) |
|---|---|---|---|
| Canola Oil, Refined | Oils | 🇨🇦 Canada | $1.4B |
| Coffee, Not Roasted | Stimulants/Spices | 🇨🇴 Colombia | $1.0B |
| Cashews, Shelled | Nuts/Seeds/Beans | 🇻🇳 Vietnam | $960M |
| Raw Sugar, Refined | Sweetners | 🇲🇽 Mexico | $723M |
| Rice | Cereals | 🇹🇭 Thailand | $713M |
| Cheese | Dairy | 🇮🇹 Italy | $310M |
Some of the highest and potentially surprising exports? Imports of refined Canadian canola oil totaled $1.4 billion in 2020, while Vietnam exported a whopping $960 million worth of cashews to America.
A Global Plate: The Diversity of U.S. Food Imports
The amount and value of food imported to the U.S. highlights the diversity of consumer preferences and the importance of global food stocks, considering America is one of the world’s leading food producers.
With countries having to rely on others to satisfy demand for limited production supply or exotic foods, the interconnectedness of the global food system is both vital and delicate.
What’s clear is that the U.S. food plate is indeed a global one, with many foods taking remarkable journeys from farm to fork.

This article was published as a part of Visual Capitalist's Creator Program, which features data-driven visuals from some of our favorite Creators around the world.


Markets
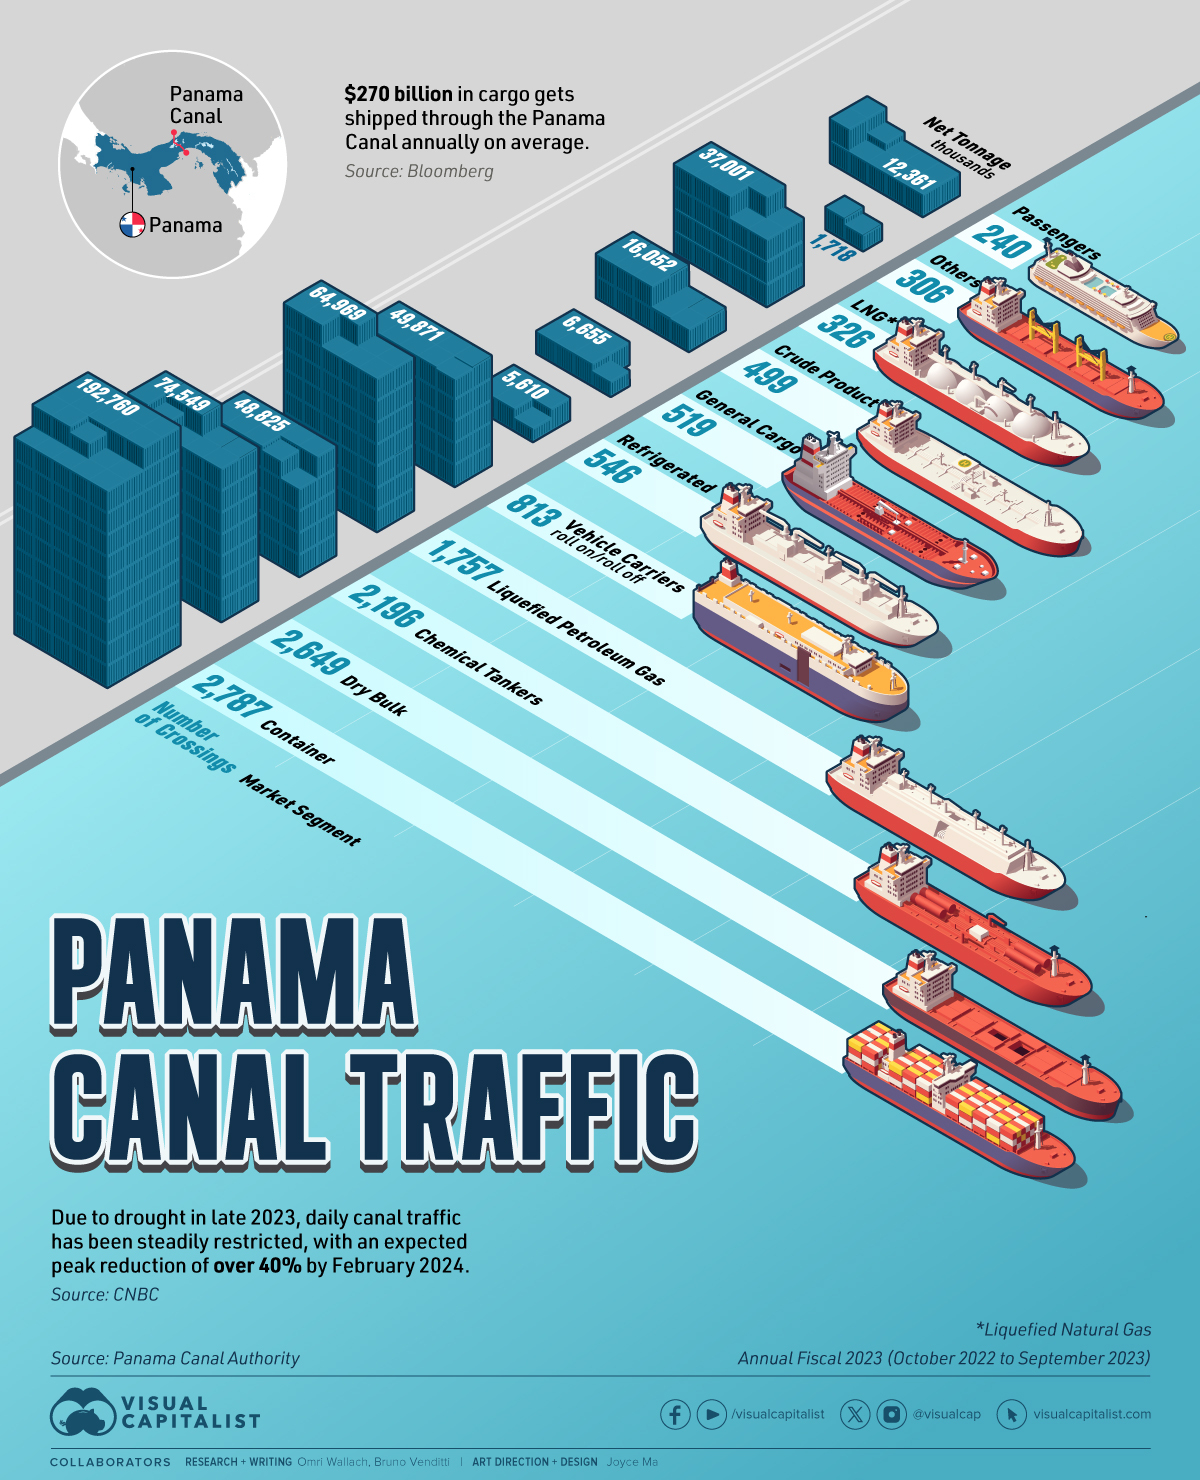
Panama Canal Traffic by Shipment Category and Tonnage
This graphic illustrates Panama Canal traffic by shipment category, looking at the total number of shipping crossings and the total tonnage.
Panama Canal Traffic by Shipment Category and Tonnage
This was originally posted on our Voronoi app. Download the app for free on iOS or Android and discover incredible data-driven charts from a variety of trusted sources.
Daily Panama Canal traffic has been steadily restricted to start the year, with an expected peak reduction of over 40% by February 2024 due to severe drought. The problem is already affecting supply chains for U.S. and Asian importers.
This graphic illustrates the number of shipping crossings by market segment at the Canal and the net tonnage carried during the Annual Fiscal 2023 (October 2022 to September 2023). Data is from the Panama Canal Authority.
About the Panama Canal
The Panama Canal is an artificial 82-kilometer (51-mile) waterway that connects the Pacific Ocean with the Atlantic Ocean, built between 1904 and 1914.
The Canal locks at each end lift ships to Gatun Lake, an artificial freshwater lake 26 meters (85 ft) above sea level. The shortcut dramatically reduces the time for ships to travel between the two oceans, enabling them to avoid the route around the southernmost tip of South America via the Drake Passage or Strait of Magellan.
The Panama Canal moves roughly $270 billion worth of cargo annually–it’s the trade route taken by 40% of all U.S. container traffic alone and handles about 5% of all global maritime trade.
The Driest October in 70 Years
Last October, however, Panama received 41% less rainfall than usual, leading to the driest October in 70 years in what was supposed to be Panama’s rainy season, bringing the level of the Gatun Lake almost six feet below where it was a year ago. Additionally, infrastructure constraints led the Panama Canal Authority to restrict the number of ships that could pass each day.
The principal commodity groups carried through the Canal are motor vehicles, petroleum products, grains, coal, and coke.
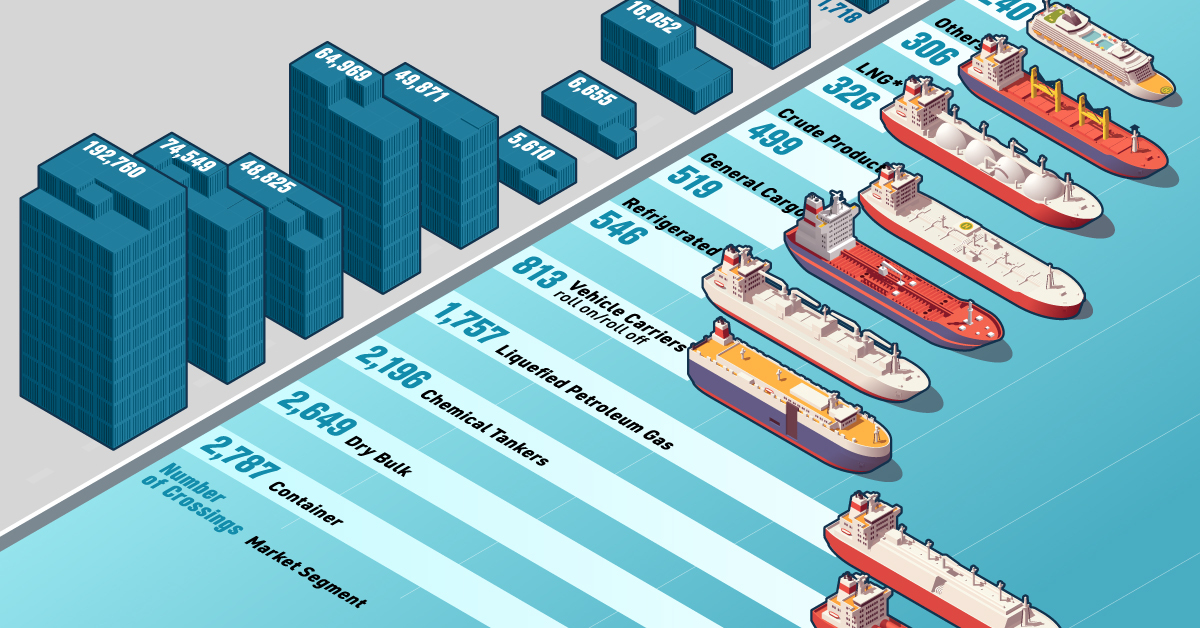
| Market Segment | Transits (#) | Net Tonnage (thousands) |
|---|---|---|
| Container | 2,787 | 192,760 |
| Dy Bulk | 2,649 | 74,549 |
| Chemical Tankers | 2,196 | 48,825 |
| Liquefied Petroleum Gas | 1,757 | 64,969 |
| Vehicle Carriers | 813 | 49,871 |
| Refrigerated | 546 | 5,610 |
| General Cargo | 519 | 6,655 |
| Crude Product Tankers | 499 | 16,052 |
| Liquefied Natural Gas | 326 | 37,001 |
| Other | 306 | 1,718 |
| Passengers | 240 | 12,361 |
| Total | 12,638 | 510,370 |
According to the Panama Canal Authority, most of its traffic came from containers and dry bulk like soybeans. The world’s largest operator of chemical tankers (Stolt-Nielsen) typically also uses the Canal. However, due to the drought and the backup at the crossing, the operator has decided to reroute its fleet to the Suez Canal.
Although representing the smaller number of crossings, the Canal is also an important route for passengers, with many ocean cruise lines offering popular Panama Canal itineraries that sail through the Canal in the approximately 8-hour passage to their next destination in the opposite ocean.

-

 Misc1 week ago
How Hard Is It to Get Into an Ivy League School?
-

 Technology2 weeks ago
Ranked: Semiconductor Companies by Industry Revenue Share
-

 Markets2 weeks ago
Ranked: The World’s Top Flight Routes, by Revenue
-

 Countries2 weeks ago
Population Projections: The World’s 6 Largest Countries in 2075
-

 Markets2 weeks ago
The Top 10 States by Real GDP Growth in 2023
-

 Demographics2 weeks ago
The Smallest Gender Wage Gaps in OECD Countries
-

 United States2 weeks ago
Where U.S. Inflation Hit the Hardest in March 2024
-

 Environment2 weeks ago
Top Countries By Forest Growth Since 2001