Space
Animation: Using Planets to Visualize the Speed of Light
Article/Editing:
The Speed of Light Visualized Using Planets
We often come across the term “light-year” in the context of space travel. But what does it actually mean?
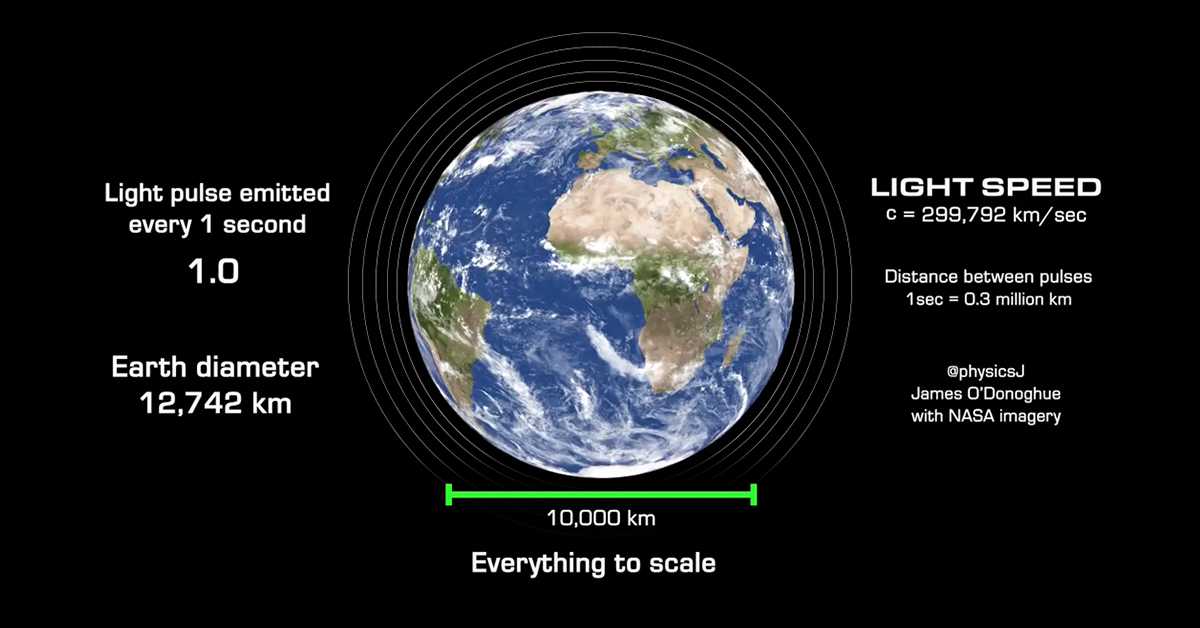
A light-year is the distance light travels in one year. At a speed of 186,000 miles/sec (300,000km/sec), light travels 5.88 trillion miles (9.46 trillion km) in a year—a distance well beyond immediate comprehension.
Scientists created the term light-year to measure astronomical distances beyond the confines of the Earth. And in the vastness of space, light photons, which can go around the Earth 7.5 times in just one second, seem slow.
The above animation from planetary scientist Dr.James O’Donoghue helps put the speed of light into a broader perspective while highlighting the vast distances between celestial bodies.
Light Speed: Fast, but Slow
The Moon is the nearest celestial body to Earth at 239,000 miles (384,400 km) away. A light photon emitted from Earth would get to the Moon in a mere 1.25 seconds.
But how does this compare to other celestial bodies in our solar system?
| Celestial Body | Distance at Closest Approach | Light Travel Time from Earth |
|---|---|---|
| Moon | 0.38 million km | 1.25 sec |
| Mars | 54.6 million km | 3 min |
| Sun | 150 million km | 8 min |
| Jupiter | 588 million km | 33 min |
| Saturn | 1.2 billion km | 67 min |
| Pluto | 4.3 billion km | 4 hrs |
If you watched the entire length of the above video, you probably saw how “slow” light is. The same photon of light that reached the Moon in a little over a second took three long minutes to reach Mars, the next planet beyond Earth in our solar system.
It takes light just over eight minutes to get from the Sun to Earth. This means that when we look at the Sun, we see it as it was eight minutes ago, and if it were to disappear suddenly, we wouldn’t realize it for eight whole minutes.
Therefore, how “fast” or “slow” light is depends on your perspective. To us Earth-dwelling humans, it feels instantaneous. But the vastness of the universe makes even light seem slow—and it travels at a speed that our spacecraft aren’t even close to matching.

This article was published as a part of Visual Capitalist's Creator Program, which features data-driven visuals from some of our favorite Creators around the world.


Space
Which Companies Own the Most Satellites?
Despite Starlink’s dominance in the industry, the company is set to face intense competition in the coming years.

Which Companies Own the Most Satellites?
Nearly 7,000 satellites orbit the Earth, serving vital functions such as communication, navigation, and scientific research.
In 2022 alone, more than 150 launches took place, sending new instruments into space, with many more expected over the next decade.
But who owns these objects? In this graphic, we utilize data from the Union of Concerned Scientists to highlight the leaders in satellite technology.
SpaceX’s Dominance in Space
SpaceX, led by Elon Musk, is unquestionably the industry leader, currently operating the largest fleet of satellites in orbit—about 50% of the global total.
The company has already completed 62 missions this year, surpassing any other company or nation, and operates thousands of internet-beaming Starlink spacecraft that provide global internet connectivity.
Starlink customers receive a small satellite dish that self-orients itself to align with Starlink’s low-Earth-orbit satellites.
| Owner | Total | Share | Country |
|---|---|---|---|
| SpaceX | 3,395 | 50% | USA |
| OneWeb Satellites | 502 | 7% | UK |
| Chinese Government | 369 | 5% | China |
| U.S. Government | 306 | 4% | USA |
| Planet Labs, Inc. | 195 | 3% | USA |
| Russian Federation | 137 | 2% | Russia |
| Spire Global Inc. | 127 | 2% | USA |
| Swarm Technologies | 84 | 1% | USA |
| Iridium Communications, Inc. | 75 | 1% | USA |
| Other | 1,528 | 23% |
Percentages may not add to 100 due to rounding.
In second place is a lesser-known company, British OneWeb Satellites. The company, headquartered in London, counts the UK government among its investors and provides high-speed internet services to governments, businesses, and communities.
Like many other satellite operators, OneWeb relies on SpaceX to launch its satellites.
Despite Starlink’s dominance in the industry, the company is set to face intense competition in the coming years. Amazon’s Project Kuiper plans to deploy 3,236 satellites by 2029 to compete with SpaceX’s network. The first of the fleet could launch as early as 2024.
The Rise of China’s Space Program
After the top private companies, governments also own a significant portion of satellites orbiting the Earth. The U.S. remains the leader in total satellites, when adding those owned by both companies and government agencies together.
American expenditures on space programs reached $62 billion in 2022, five times more than the second one, China.
China, however, has sped up its space program over the last 20 years and currently has the highest number of satellites in orbit belonging directly to government agencies. Most of these are used for Earth observation, communications, defense, and technology development.
Satellite Demand to Rise Over the Decade
Despite the internet being taken for granted in major metropolitan areas and developed countries, one out of every three people worldwide has never used the web.
Furthermore, the increasing demand for data and the emergence of new, more cost-effective satellite technologies are expected to present significant opportunities for private space companies.
In this context, satellite demand is projected to quadruple over the next decade.

-

 Education1 week ago
How Hard Is It to Get Into an Ivy League School?
-

 Technology2 weeks ago
Ranked: Semiconductor Companies by Industry Revenue Share
-

 Markets2 weeks ago
Ranked: The World’s Top Flight Routes, by Revenue
-

 Demographics2 weeks ago
Population Projections: The World’s 6 Largest Countries in 2075
-

 Markets2 weeks ago
The Top 10 States by Real GDP Growth in 2023
-

 Demographics2 weeks ago
The Smallest Gender Wage Gaps in OECD Countries
-

 Economy2 weeks ago
Where U.S. Inflation Hit the Hardest in March 2024
-

 Green2 weeks ago
Top Countries By Forest Growth Since 2001