Misc
A Map of Every Object in Our Solar System
View the full-size version of this infographic.

A Map of Every Object in Our Solar System
View the high resolution version of this incredible map by clicking here
The path through the solar system is a rocky road.
Asteroids, comets, planets and moons and all kinds of small bodies of rock, metals, minerals and ice are continually moving as they orbit the sun. In contrast to the simple diagrams we’re used to seeing, our solar system is a surprisingly crowded place.
In this stunning visualization, biologist Eleanor Lutz painstakingly mapped out every known object in Earth’s solar system (>10km in diameter), hopefully helping you on your next journey through space.
Data-Driven Solar System
This particular visualization combines five different data sets from NASA:
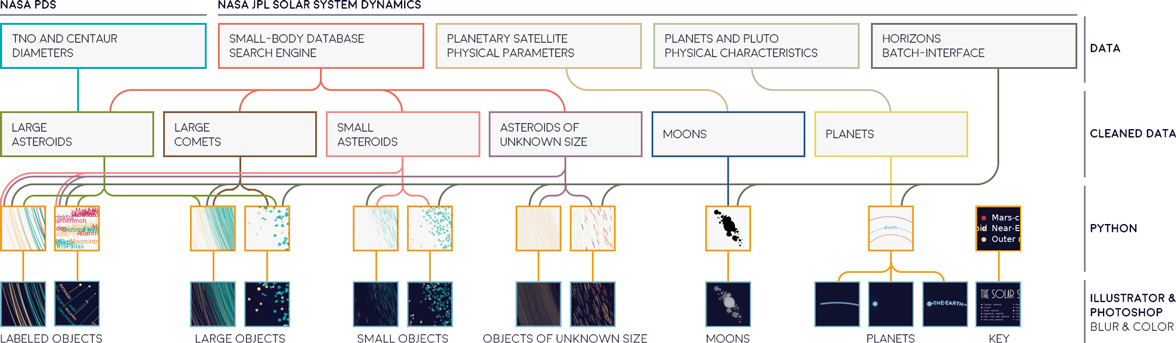
Source: Tabletop Whale
From this data, Lutz mapped all the orbits of over 18,000 asteroids in the solar system, including 10,000 that were at least 10km in diameter, and about 8,000 objects of unknown size.
This map shows each asteroid’s position on New Year’s Eve 1999.
The Pull of Gravity
When plotting the objects, Lutz observed that the solar system is not arranged in linear distances. Rather, it is logarithmic, with exponentially more objects situated close to the sun. Lutz made use of this observation to space out their various orbits of the 18,000 objects in her map.
What she is visualizing is the pull of the sun, as the majority of objects tend to gravitate towards the inner part of the solar system. This is the same observation Sir Isaac Newton used to develop the concept of gravity, positing that heavier objects produce a bigger gravitational pull than lighter ones. Since the sun is the largest object in our solar system, it has the strongest gravitational pull.
If the sun is continually pulling at the planets, why don’t they all fall into the sun? It’s because the planets are moving sideways at the same time.
Without that sideways motion, the objects would fall to the center – and without the pull toward the center, it would go flying off in a straight line.
This explains the clustering of patterns in solar systems, and why the farther you travel through the solar system, the bigger the distance and the fewer the objects.
The Top Ten Non-Planets in the Solar System
We all know that the sun and the planets are the largest objects in our corner of the universe, but there are many noteworthy objects as well.
| Rank | Name | Diameter | Notes |
|---|---|---|---|
| 1 | Ganymede | 3,273 mi (5,268 km) | Jupiter's largest moon |
| 2 | Titan | 3,200 mi (5,151 km) | Saturn's largest moon |
| 3 | Callisto | 2,996 mi (4,821 km) | Jupiter's second largest moon |
| 4 | Io | 2,264 mi (3,643 km) | Moon orbiting Jupiter |
| 5 | Moon | 2,159 mi (3,474 km) | Earth's only moon |
| 6 | Europa | 1,940 mi (3,122 km) | Moon orbiting Jupiter |
| 7 | Triton | 1,680 mi (2,710 km) | Neptune's largest moon |
| 8 | Pluto | 1,476 mi (2,376 km) | Dwarf planet |
| 9 | Eris | 1,473 mi (2,372 km) | Dwarf planet |
| 10 | Titania | 981 mi (1,578 km) | Uranus' largest moon |
Source: Ourplnt.com
While the map only shows objects greater than 10 kilometers in diameter, there are plenty of smaller objects to watch out for as well.
An Atlas of Space
This map is one among many of Lutz’s space related visualizations. She is also in the process of creating an Atlas of Space to showcase her work.
As we reach further and further beyond the boundaries of earth, her work may come in handy the next time you make a wrong turn at Mars and find yourself lost in an asteroid belt.
“I knew I shoulda taken that left turn at Albuquerque!”


Misc
How Hard Is It to Get Into an Ivy League School?
We detail the admission rates and average annual cost for Ivy League schools, as well as the median SAT scores required to be accepted.


How Hard Is It to Get Into an Ivy League School?
This was originally posted on our Voronoi app. Download the app for free on iOS or Android and discover incredible data-driven charts from a variety of trusted sources.
Ivy League institutions are renowned worldwide for their academic excellence and long-standing traditions. But how hard is it to get into one of the top universities in the U.S.?
In this graphic, we detail the admission rates and average annual cost for Ivy League schools, as well as the median SAT scores required to be accepted. The data comes from the National Center for Education Statistics and was compiled by 24/7 Wall St.
Note that “average annual cost” represents the net price a student pays after subtracting the average value of grants and/or scholarships received.
Harvard is the Most Selective
The SAT is a standardized test commonly used for college admissions in the United States. It’s taken by high school juniors and seniors to assess their readiness for college-level academic work.
When comparing SAT scores, Harvard and Dartmouth are among the most challenging universities to gain admission to. The median SAT scores for their students are 760 for reading and writing and 790 for math. Still, Harvard has half the admission rate (3.2%) compared to Dartmouth (6.4%).
| School | Admission rate (%) | SAT Score: Reading & Writing | SAT Score: Math | Avg Annual Cost* |
|---|---|---|---|---|
| Harvard University | 3.2 | 760 | 790 | $13,259 |
| Columbia University | 3.9 | 750 | 780 | $12,836 |
| Yale University | 4.6 | 760 | 780 | $16,341 |
| Brown University | 5.1 | 760 | 780 | $26,308 |
| Princeton University | 5.7 | 760 | 780 | $11,080 |
| Dartmouth College | 6.4 | 760 | 790 | $33,023 |
| University of Pennsylvania | 6.5 | 750 | 790 | $14,851 |
| Cornell University | 7.5 | 750 | 780 | $29,011 |
*Costs after receiving federal financial aid.
Additionally, Dartmouth has the highest average annual cost at $33,000. Princeton has the lowest at $11,100.
While student debt has surged in the United States in recent years, hitting $1.73 trillion in 2023, the worth of obtaining a degree from any of the schools listed surpasses mere academics. This is evidenced by the substantial incomes earned by former students.
Harvard grads, for example, have the highest average starting salary in the country, at $91,700.

-

 Maps2 weeks ago
Mapped: Average Wages Across Europe
-

 Money1 week ago
Which States Have the Highest Minimum Wage in America?
-

 Real Estate1 week ago
Ranked: The Most Valuable Housing Markets in America
-

 Markets1 week ago
Charted: Big Four Market Share by S&P 500 Audits
-

 AI1 week ago
The Stock Performance of U.S. Chipmakers So Far in 2024
-

 Automotive2 weeks ago
Almost Every EV Stock is Down After Q1 2024
-

 Money2 weeks ago
Where Does One U.S. Tax Dollar Go?
-

 Green2 weeks ago
Ranked: Top Countries by Total Forest Loss Since 2001