Technology
A High Level Look at Satellites
A High Level Look at Satellites
View the full-size version of the first visualization to see in full detail.
Satellites rarely get much attention, but they’re the hubs that keep our modern world connected. Just how many satellites are orbiting around Earth? Who’s launching them? And, what exactly are they doing up there anyway? These are good questions. Let’s dig in.
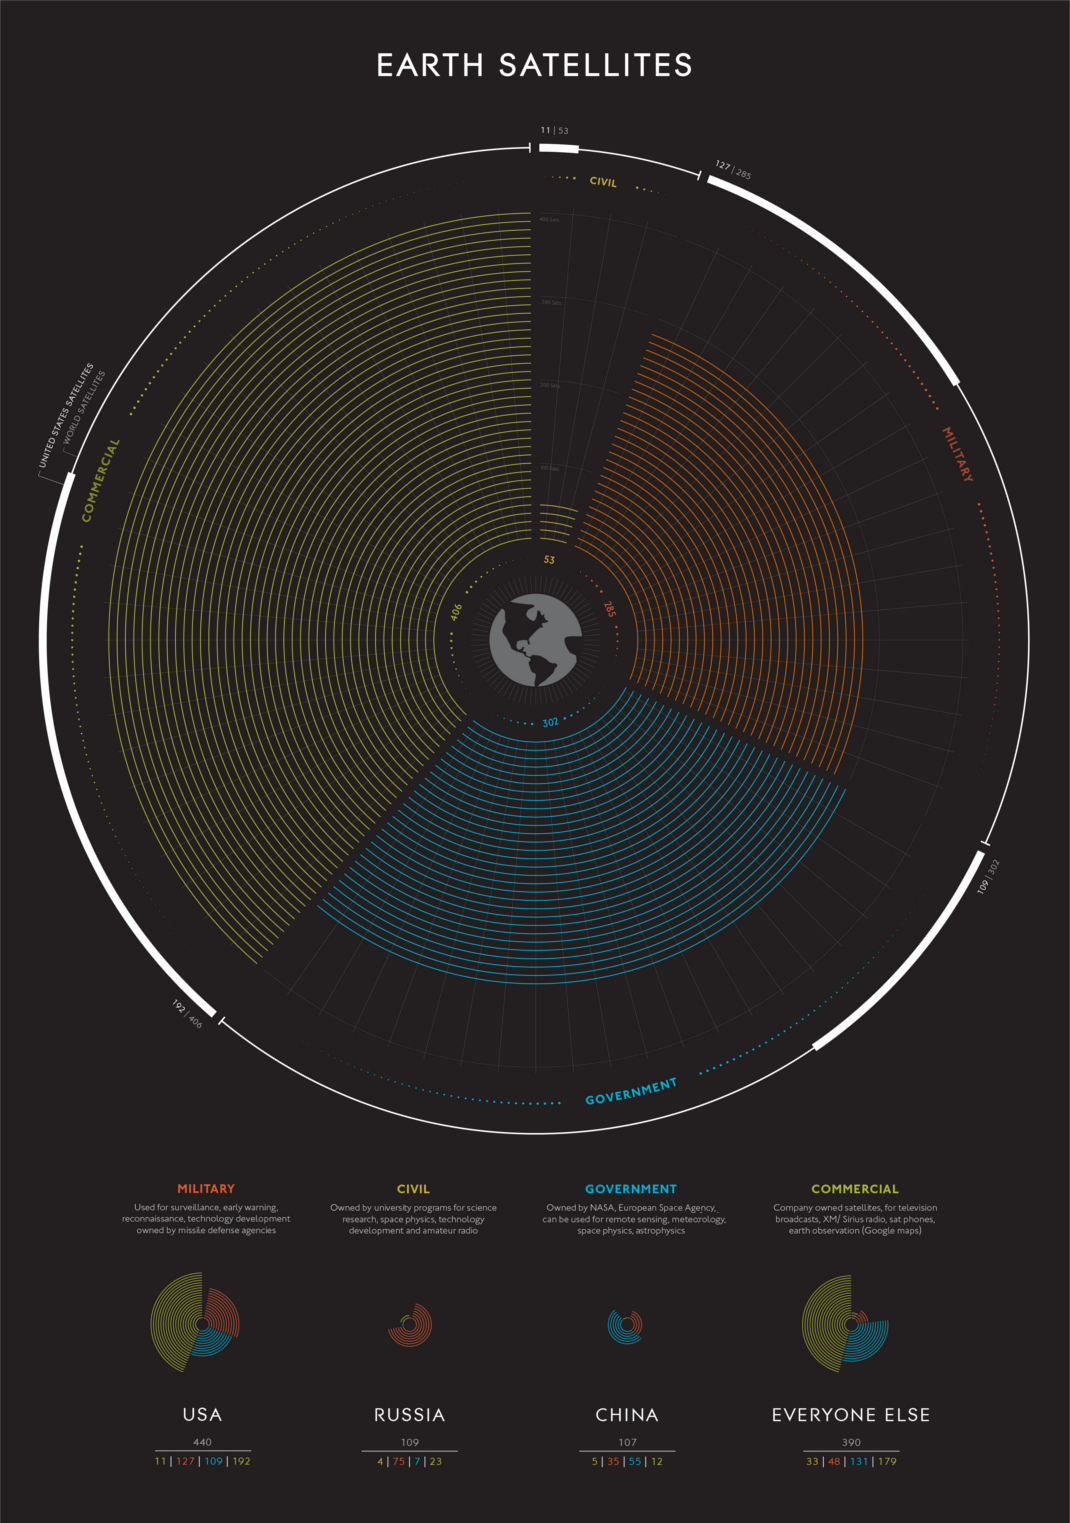
Today’s visualization comes to us from Carey Spies, and while it is based on older data, it provides a useful breakdown of the types of satellites that orbit the Earth.
There are now nearly 1,500 satellites in orbit in 2017, and if SpaceX’s plans for a 4,425-satellite communications network come to fruition, our planet’s exosphere will become even more crowded.
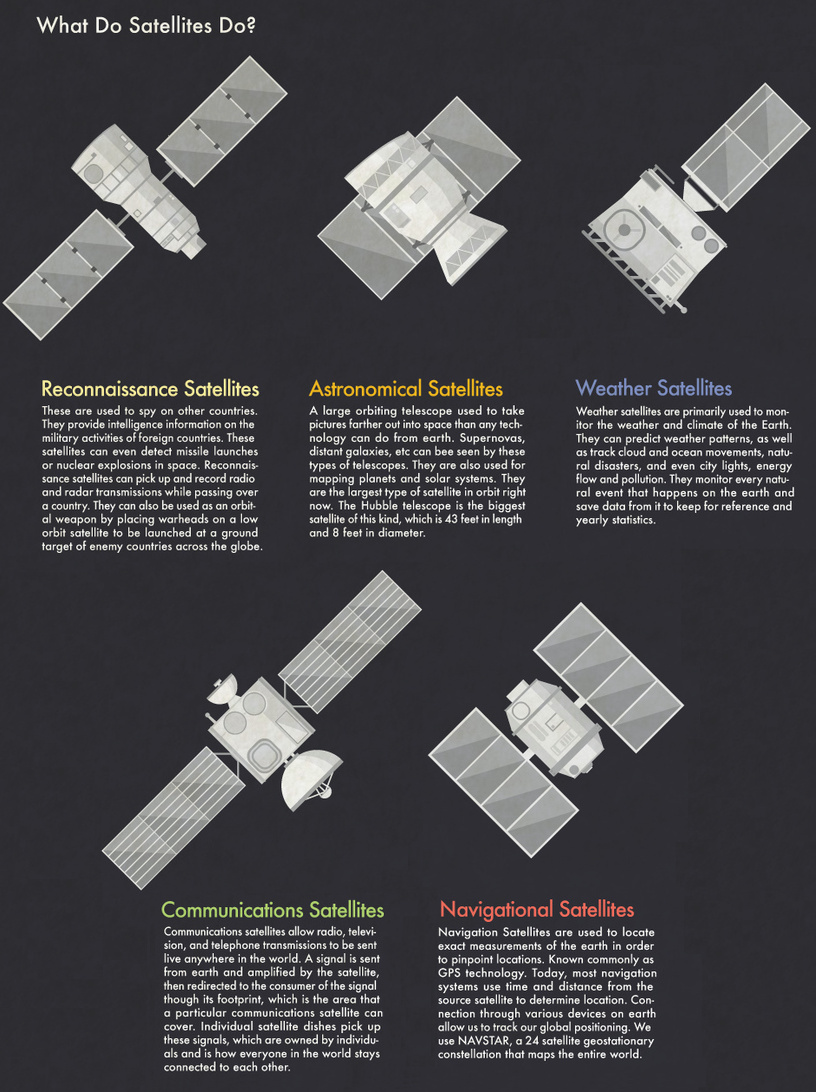
What do satellites actually do?
Satellites are launched into space for a number of reasons.
They do everything from military reconnaissance to keeping our GPS systems working properly. The truly global scope of telecommunications wouldn’t be possible without our expansive network of orbiting satellites. For example, O3b Networks’ 12 satellites provide broadband internet service to emerging markets.
Who’s launching satellites?
The United States, with nearly 600 operating satellites, has clearly won the space race in this sense. That said, everyone from Azerbaijan to Vietnam now has equipment in orbit, and the list keeps growing.
The change over time, seen in this interactive map, shows that now practically everyone is in the game:
Launching rockets used to be the sole domain of nations, but the privatization of spaceflight has dramatically increased the number of commercial satellites in orbit. Iridium Communications, for example, has a constellation of 70+ operational satellites.
Anxiety in the Exosphere
Operating satellites are only one part of the equation. Sputnik I was launched into space nearly 60 years ago, and as one might guess, a lot of obsolete and dead equipment has built up over that time. The United States Space Surveillance Network estimates that there are 21,000 objects larger than 10cm orbiting the Earth. An increase in “space junk” could have major implications, as even tiny objects can cause severe damage to equipment.
We must cooperate now to guarantee economically vital spaceflight.
– Brigitte Zypries, German Federal Minister for Economic Affairs and Energy
Another looming issue is the potential weaponization of space. Until now, nations have operated under the “gentlemen’s agreement” that nothing launched into space should be weaponized, but the U.S., China, and Russia have all been accused of taking steps towards putting destructive objects into orbit. Beyond the obvious implications of conflict in space, damaged satellites would also exacerbate the aforementioned “space junk” problem.
What’s on the Horizon
While companies like SpaceX are looking for ways to reduce the overall cost of launching rockets into space, other innovations may also make it easier than ever to put structures into orbit. The Archinaut Program – which received $20 million in funding from NASA – is looking at ways to manufacture and assemble structures in space.
One thing is for certain; space is about to get a whole lot more crowded.


Technology
Ranked: Semiconductor Companies by Industry Revenue Share
Nvidia is coming for Intel’s crown. Samsung is losing ground. AI is transforming the space. We break down revenue for semiconductor companies.


Semiconductor Companies by Industry Revenue Share
This was originally posted on our Voronoi app. Download the app for free on Apple or Android and discover incredible data-driven charts from a variety of trusted sources.
Did you know that some computer chips are now retailing for the price of a new BMW?
As computers invade nearly every sphere of life, so too have the chips that power them, raising the revenues of the businesses dedicated to designing them.
But how did various chipmakers measure against each other last year?
We rank the biggest semiconductor companies by their percentage share of the industry’s revenues in 2023, using data from Omdia research.
Which Chip Company Made the Most Money in 2023?
Market leader and industry-defining veteran Intel still holds the crown for the most revenue in the sector, crossing $50 billion in 2023, or 10% of the broader industry’s topline.
All is not well at Intel, however, with the company’s stock price down over 20% year-to-date after it revealed billion-dollar losses in its foundry business.
| Rank | Company | 2023 Revenue | % of Industry Revenue |
|---|---|---|---|
| 1 | Intel | $51B | 9.4% |
| 2 | NVIDIA | $49B | 9.0% |
| 3 | Samsung Electronics | $44B | 8.1% |
| 4 | Qualcomm | $31B | 5.7% |
| 5 | Broadcom | $28B | 5.2% |
| 6 | SK Hynix | $24B | 4.4% |
| 7 | AMD | $22B | 4.1% |
| 8 | Apple | $19B | 3.4% |
| 9 | Infineon Tech | $17B | 3.2% |
| 10 | STMicroelectronics | $17B | 3.2% |
| 11 | Texas Instruments | $17B | 3.1% |
| 12 | Micron Technology | $16B | 2.9% |
| 13 | MediaTek | $14B | 2.6% |
| 14 | NXP | $13B | 2.4% |
| 15 | Analog Devices | $12B | 2.2% |
| 16 | Renesas Electronics Corporation | $11B | 1.9% |
| 17 | Sony Semiconductor Solutions Corporation | $10B | 1.9% |
| 18 | Microchip Technology | $8B | 1.5% |
| 19 | Onsemi | $8B | 1.4% |
| 20 | KIOXIA Corporation | $7B | 1.3% |
| N/A | Others | $126B | 23.2% |
| N/A | Total | $545B | 100% |
Note: Figures are rounded. Totals and percentages may not sum to 100.
Meanwhile, Nvidia is very close to overtaking Intel, after declaring $49 billion of topline revenue for 2023. This is more than double its 2022 revenue ($21 billion), increasing its share of industry revenues to 9%.
Nvidia’s meteoric rise has gotten a huge thumbs-up from investors. It became a trillion dollar stock last year, and broke the single-day gain record for market capitalization this year.
Other chipmakers haven’t been as successful. Out of the top 20 semiconductor companies by revenue, 12 did not match their 2022 revenues, including big names like Intel, Samsung, and AMD.
The Many Different Types of Chipmakers
All of these companies may belong to the same industry, but they don’t focus on the same niche.
According to Investopedia, there are four major types of chips, depending on their functionality: microprocessors, memory chips, standard chips, and complex systems on a chip.
Nvidia’s core business was once GPUs for computers (graphics processing units), but in recent years this has drastically shifted towards microprocessors for analytics and AI.
These specialized chips seem to be where the majority of growth is occurring within the sector. For example, companies that are largely in the memory segment—Samsung, SK Hynix, and Micron Technology—saw peak revenues in the mid-2010s.

-

 Real Estate2 weeks ago
Visualizing America’s Shortage of Affordable Homes
-

 Technology1 week ago
Ranked: Semiconductor Companies by Industry Revenue Share
-

 Money1 week ago
Which States Have the Highest Minimum Wage in America?
-

 Real Estate1 week ago
Ranked: The Most Valuable Housing Markets in America
-

 Business2 weeks ago
Charted: Big Four Market Share by S&P 500 Audits
-

 AI2 weeks ago
The Stock Performance of U.S. Chipmakers So Far in 2024
-

 Misc2 weeks ago
Almost Every EV Stock is Down After Q1 2024
-

 Money2 weeks ago
Where Does One U.S. Tax Dollar Go?