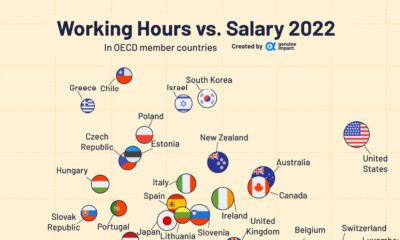

What are the average work hours and salaries in OECD countries? We look at the data for trends across regions.
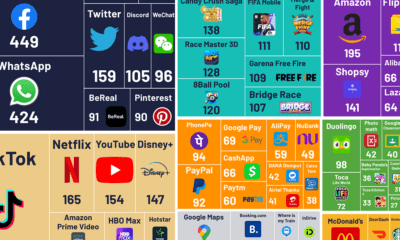

What are the world's most popular apps? This graphic visualizes the most downloaded apps, grouped together by different categories.
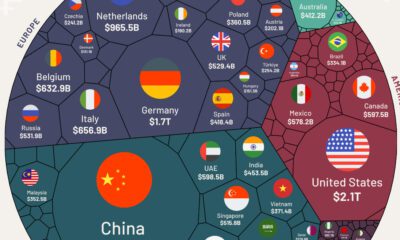

We visualize nearly $25 trillion of global exports by country, showing you the top exporting nations and the data behind it all.
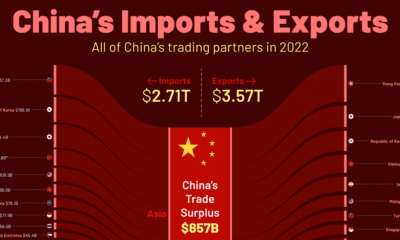

China trades with more than 200 countries globally. Here's how China's trade partners break down by import and export destinations.
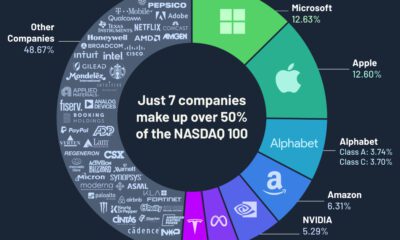

Just seven companies make up over 50% of the Nasdaq 100 by weight, and most of them are from the technology sector.
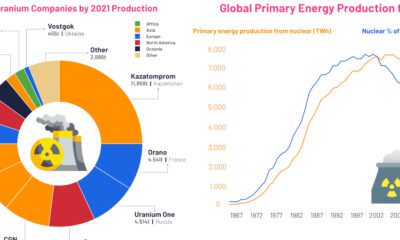

These visuals highlight the uranium mining industry and its output, as well as the trajectory of nuclear energy from 1960 to today.
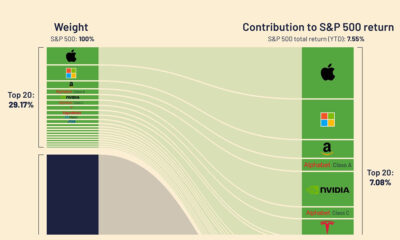

From Apple to NVIDIA, megacap stocks are fueling S&P 500 returns. The majority of these firms are also investing heavily in AI.
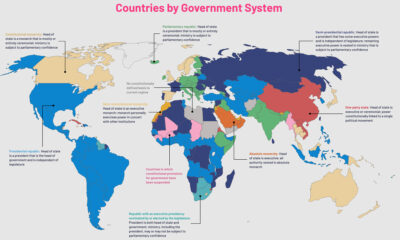

The political regimes of the world's countries have changed over centuries. This map charts the nine government systems that rule the world today.
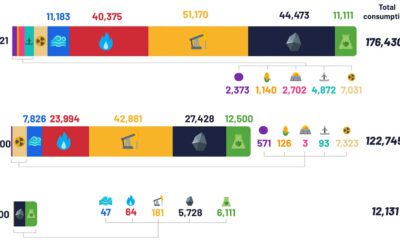

Despite the advent of renewable sources of energy, fossil fuels and their carbon emissions, haven’t gone anywhere.
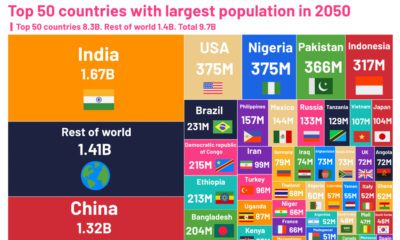

These charts highlight the changing world population between 2022 and 2050, showing which countries are growing—and shrinking—the fastest.