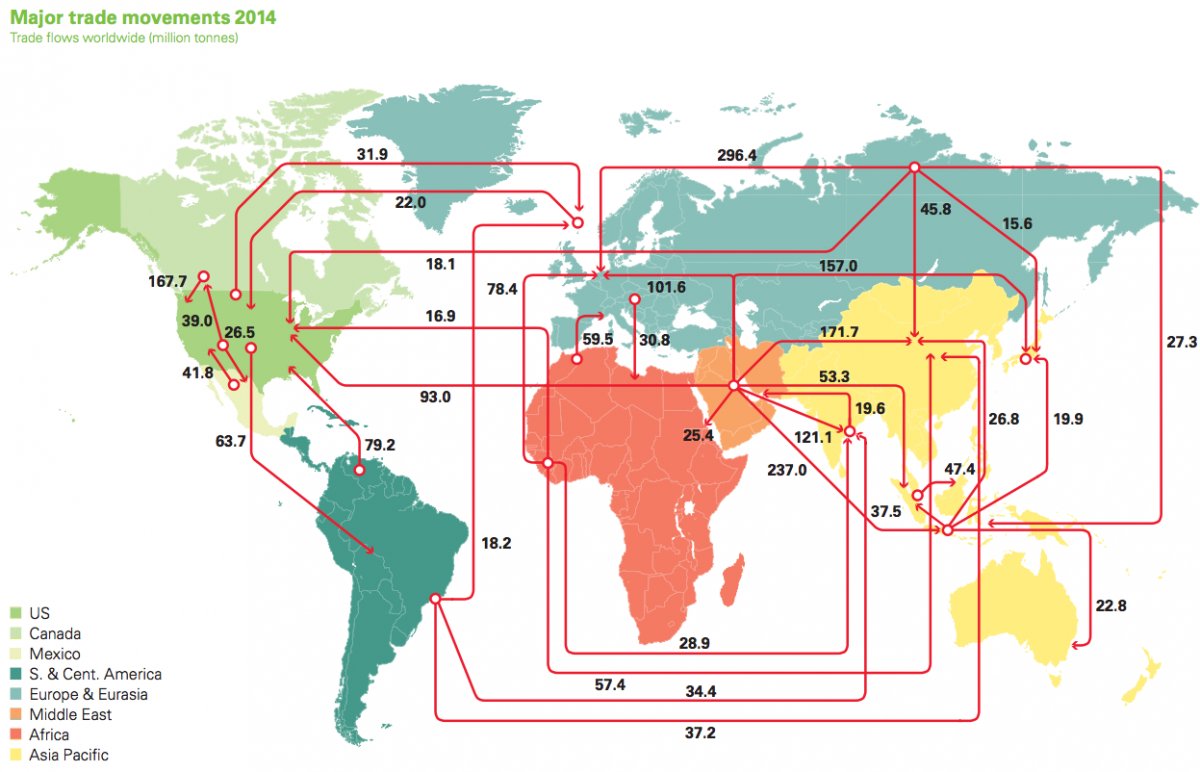
Every day, 93 million barrels of oil are consumed by the global economy. How does this oil change hands? This map visualizes the global oil trade.
Hyperinflation has happened hundreds of times throughout history, but today we present the origins of the world's most famous case in Germany after WW1.
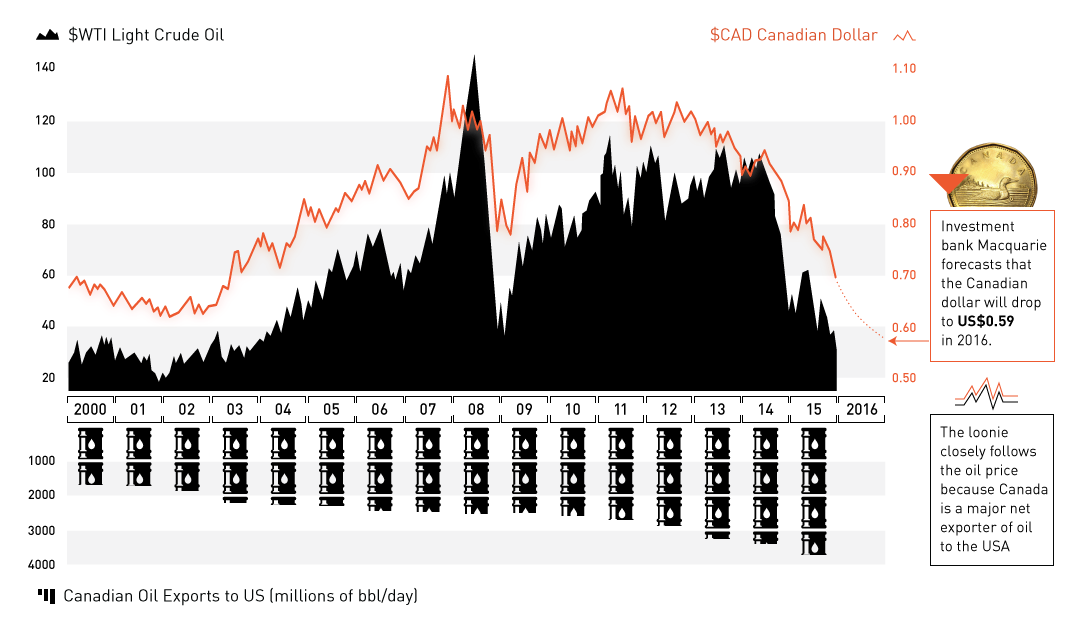
The oil plunge has wreaked havoc on the Canadian dollar. Now at 13-yr lows and expected to go lower, we explain the relationship between oil and...
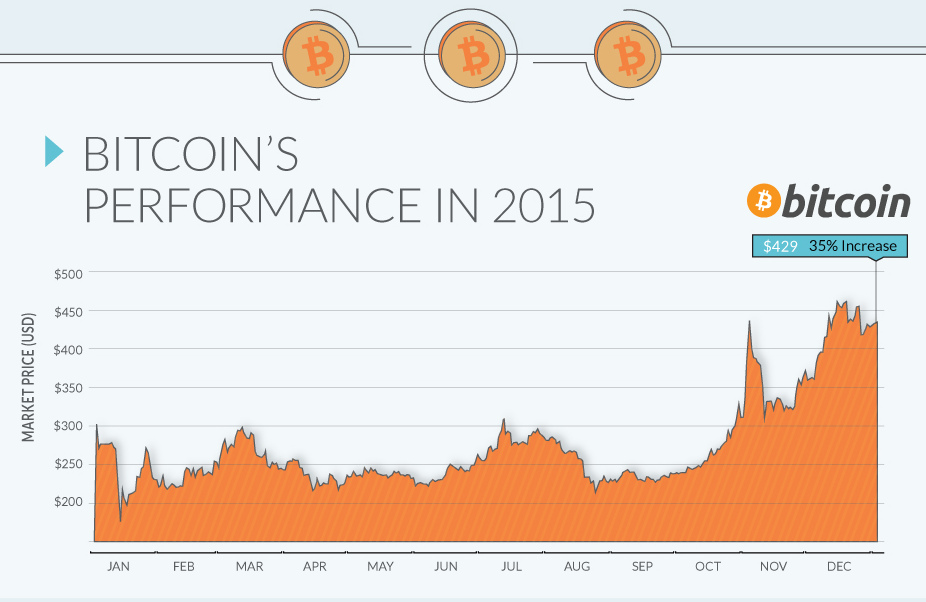
In a year that the US dollar gained on most currencies, it was the digital cryptocurrency Bitcoin that was the top performer by a significant margin.
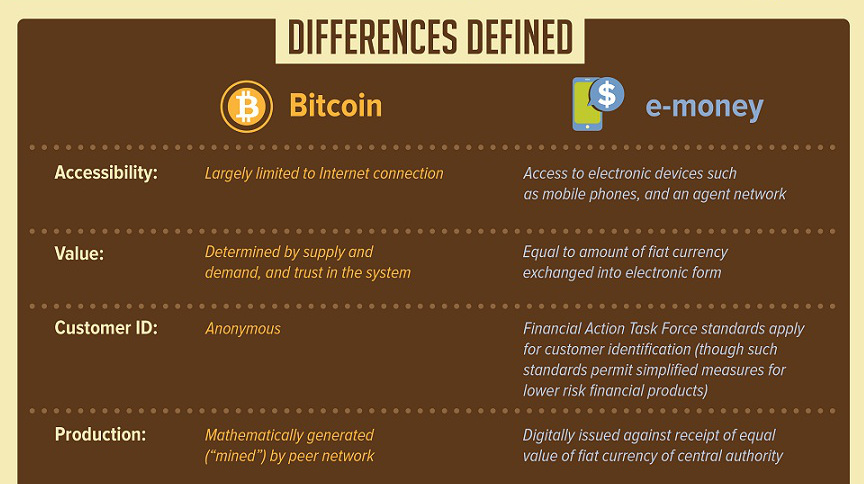
E-money and Bitcoin are both digital payment mediums, but that is where the similarities end. Find out the differences between the two in this infographic.
The euro has fallen precipitously since the beginning of the Financial Crisis in terms of USD. Crises plague the eurozone - will it be able to...
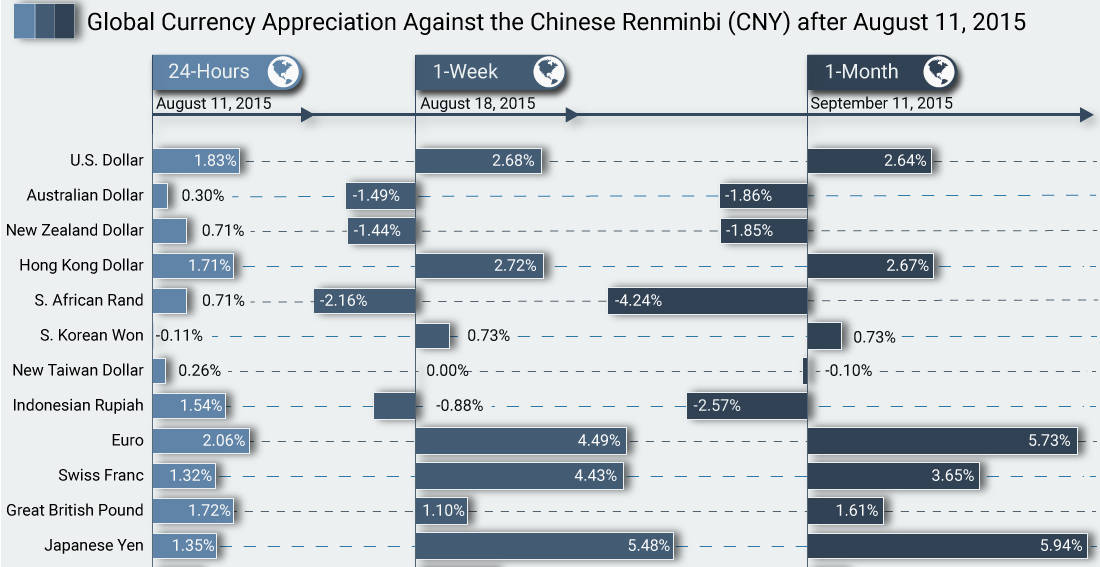
On August 11, China's central banks shocked markets by devaluating the yuan in the biggest move in 20 years. Over one month later, here is the...
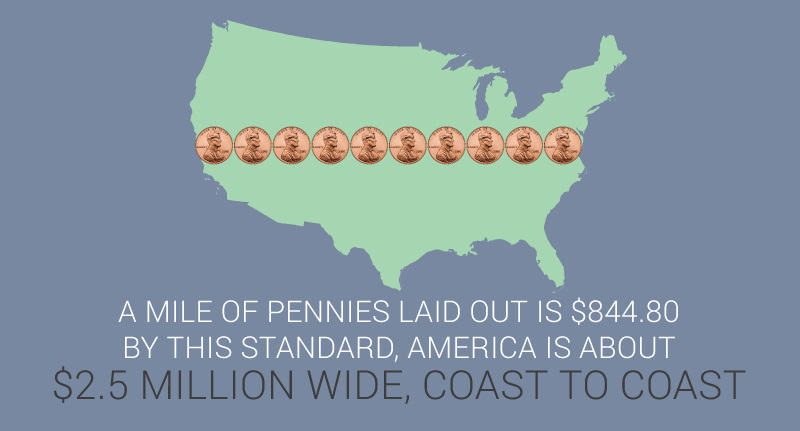
This infographic covers 33 little-known U.S. currency facts about the bills and coins in circulation today.
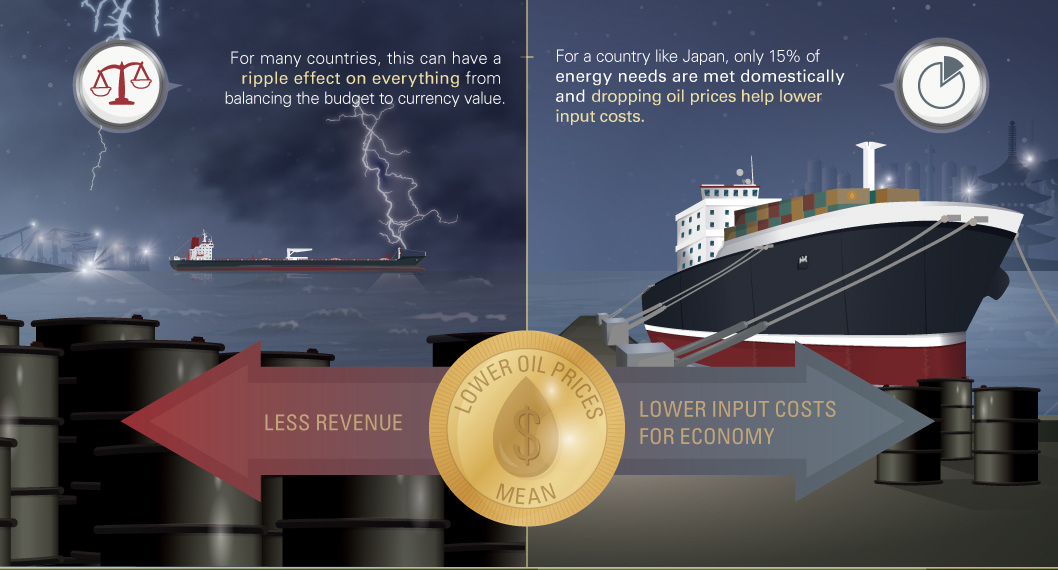
Plunging oil prices have profound effects on major importers and exporters of oil. In this case, we look at how currencies of net exporters are impacted.
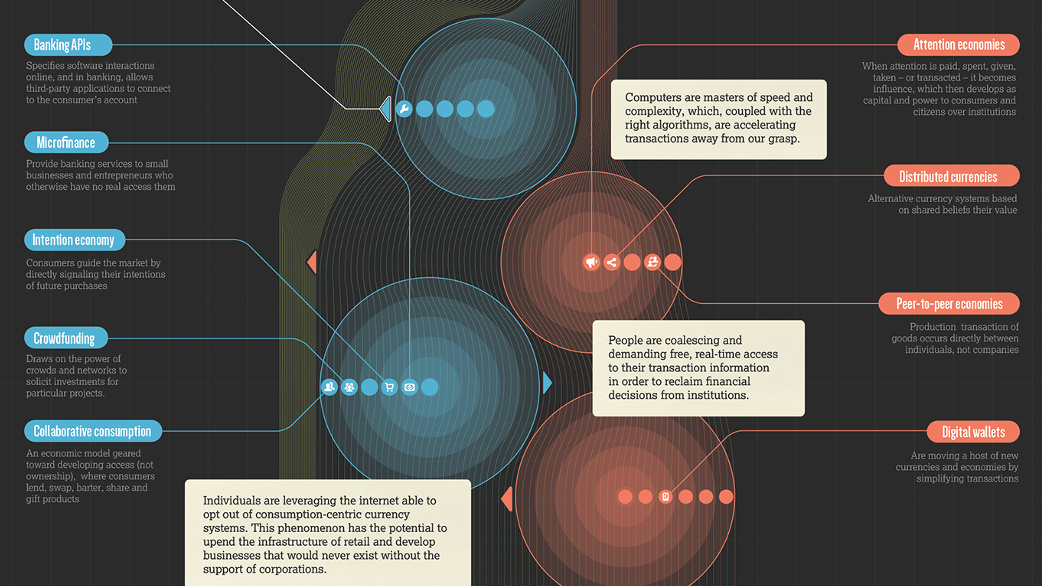
The past, present, and future of money on an infographic timeline. How has technology shaped currency and trade and what does it look like in the...


