Energy
The Inflation Factor: How Rising Food and Energy Prices Impact the Economy
![]() Subscribe to the Elements free mailing list for more like this
Subscribe to the Elements free mailing list for more like this
How Rising Food and Energy Prices Impact the Economy
This was originally posted on Elements. Sign up to the free mailing list to get beautiful visualizations on natural resource megatrends in your email every week.
Since Russia’s invasion of Ukraine, the effects of energy supply disruptions are cascading across everything from food prices to electricity to consumer sentiment.
In response to soaring prices, many OECD countries are tapping into their strategic petroleum reserves. In fact, since March, the U.S. has sold a record one million barrels of oil per day from these reserves. This, among other factors, has led gasoline prices to fall more recently—yet deficits could follow into 2023, causing prices to increase.
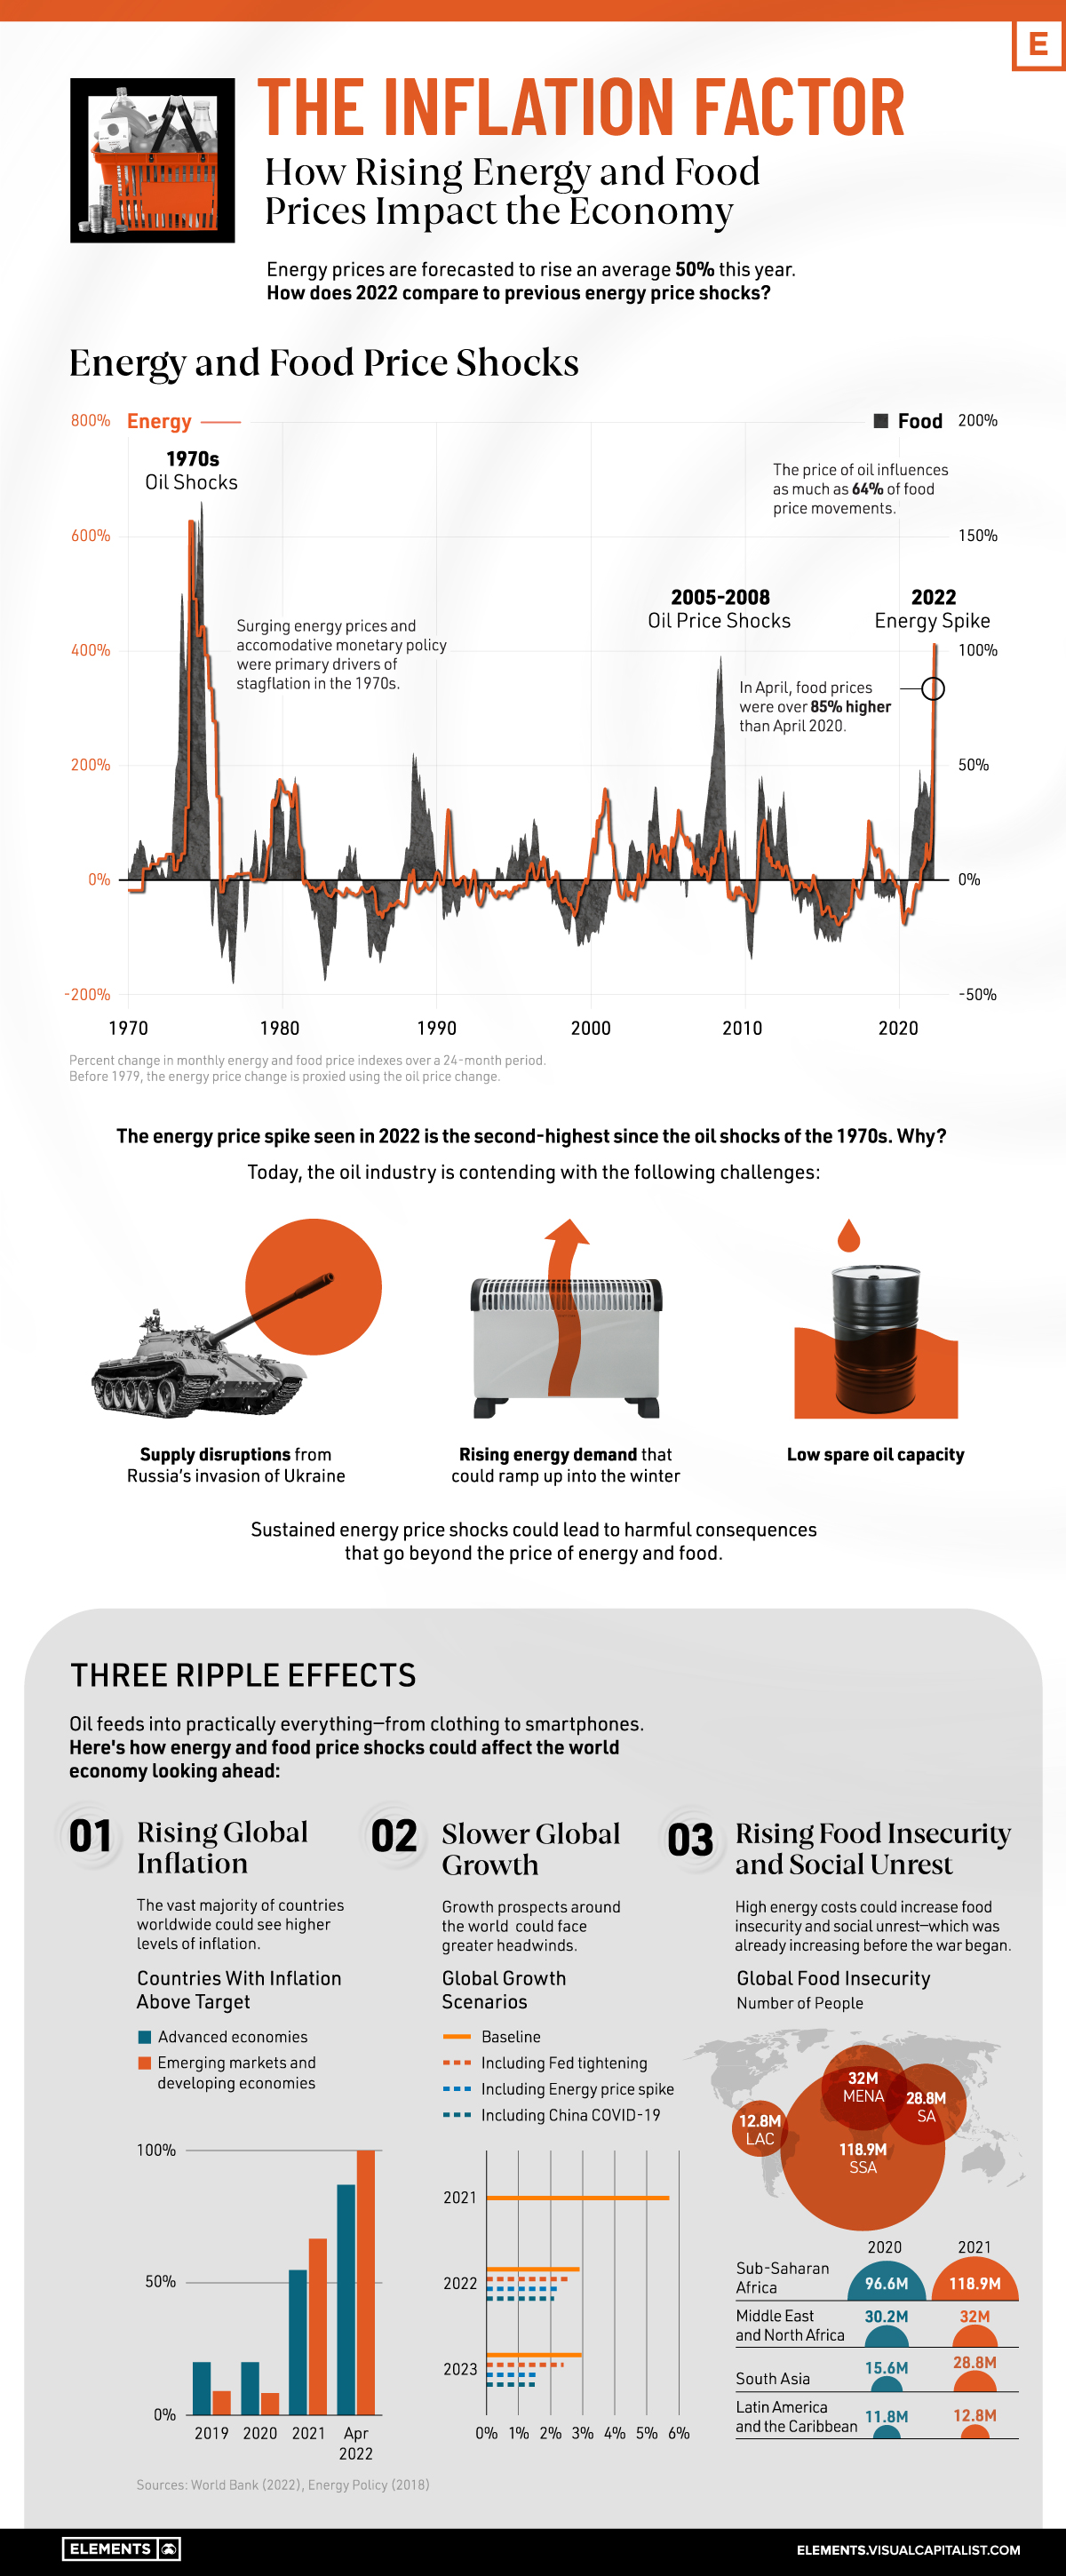
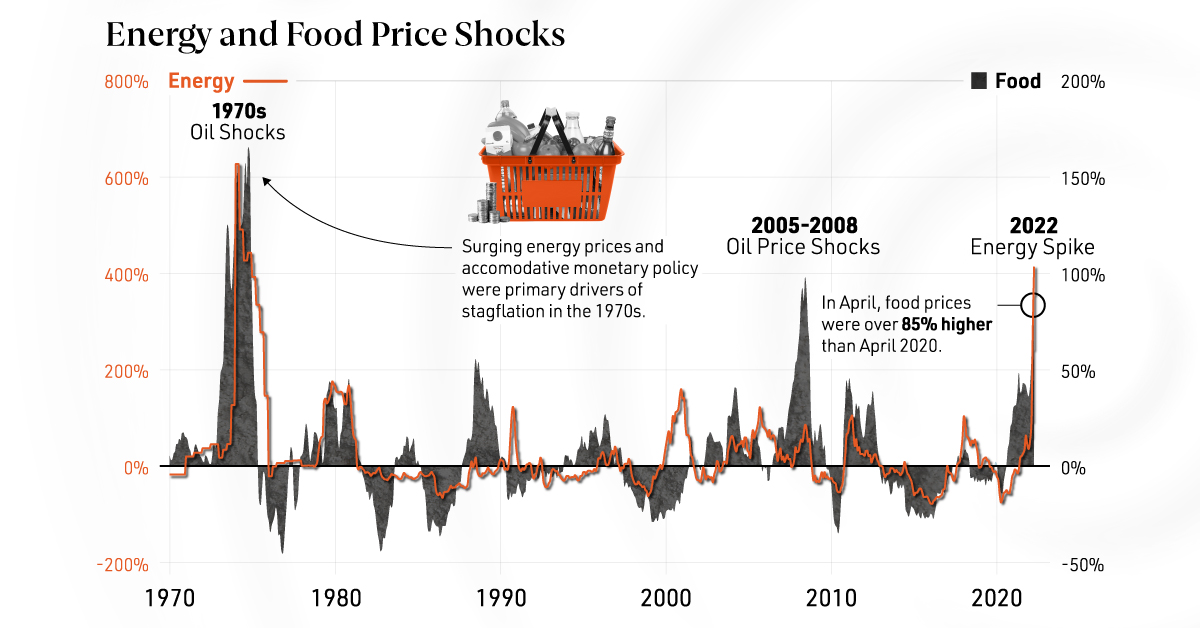
With data from the World Bank, the above infographic charts energy shocks over the last half century and what this means for the global economy looking ahead.
Energy Price Shocks Since 1979
How does today’s energy price shock compare to previous spikes in real terms?
| U.S.$/bbl Equivalent | Crude Oil | Natural Gas | Coal |
|---|---|---|---|
| 2022* | $93 | $170 | $61 |
| 2008 | $127 | $100 | $46 |
| 1979 | $119 | $72 | $33 |
*2022 forecast
As the above table shows, the annual price of crude oil is forecasted to average $93 per barrel equivalent in 2022. By comparison, during the 2008 and 1979 price shocks, crude oil averaged $127 and $119 per barrel, respectively.
What distinguishes the 2022 energy spike is that prices have soared across all fuels. Where price shocks were more or less isolated in the past, many countries such as Germany and the Netherlands are looking to coal to make up for oil supply disruptions. Meanwhile, European natural gas prices have hit record highs.
Food prices have also spiked. Driven by higher input costs across fuel, chemicals, and fertilizer, agriculture commodity prices are forecasted to rise 18% in 2022. Fertilizer prices alone could increase 70% in part due to Russia’s dominance of the global fertilizer market—exporting more than any country worldwide.
What are 3 Ripple Effects of Rising Energy Prices?
Oil feeds into nearly everything, from food to smartphones. In fact, the price of oil influences as much as 64% of food price movements.
How could energy and food shocks affect the world economy in the near future, and why is a lot riding on the price of oil?
1. Rising Global Inflation
In 2022, inflation became a global phenomenon—impacting 100% of advanced countries and 87% of emerging markets and developing economies analyzed by the World Bank.
| Countries With Inflation Above Target | 2019 | 2020 | 2021 | Apr 2022 |
|---|---|---|---|---|
| Emerging Markets and Developing Economies | 20% | 20% | 55% | 87% |
| Advanced Economies | 9% | 8% | 67% | 100% |
Sample includes 31 emerging markets and developing economies and 12 advanced economies
By contrast, roughly two-thirds of advanced economies and just over half of emerging markets experienced inflation above target in 2021.
This has contributed to tighter monetary conditions. The table below shows how rising inflation in the U.S. has corresponded with interest rate hikes since the 1980s:
| Date | Core CPI at Beginning of Cycle | Magnitude of Rate Hikes Over Course of Tightening Cycle |
|---|---|---|
| 1979-81 | 9.3% | 9.0 p.p |
| 1983-84 | 4.6% | 3.0 p.p |
| 1986-89 | 3.6% | 4.0 p.p |
| 1994-95 | 2.8% | 3.0 p.p |
| 1999-00 | 2.0% | 1.75 p.p |
| 2004-06 | 1.9% | 4.25 p.p. |
| 2015-19 | 2.1% | 2.25 p.p |
| 2022-23 | 6.4% | 2.75 p.p |
2023 is an estimate based on market expectations of the level of the Fed Funds rate in mid-2023. U.S. Core CPI for 2023 based on latest data available.
In many cases, when the U.S. has rapidly tightened monetary policy in response to price pressures, emerging markets and developing economies have experienced financial crises amid higher borrowing costs.
2. Slower Global Growth
Energy price shocks could add greater headwinds to global growth prospects:
| Global Growth Scenarios | 2021 | 2022 | 2023 |
|---|---|---|---|
| Baseline | 5.7% | 2.9% | 3.0% |
| Including Fed tightening | 2.6% | 2.4% | |
| Including Energy price spike | 2.2% | 1.6% | |
| Including China COVID-19 | 2.1% | 1.5% |
Together, price spikes, hawkish monetary policy, and COVID-19 lockdowns in China could negatively impact global growth.
3. Rising Food Insecurity and Social Unrest
Even before the energy price shock of 2022, global food insecurity was increasing due to COVID-19 and mounting inflationary pressures.
| Number of People in Acute Food Insecurity | 2020 | 2021 |
|---|---|---|
| Sub-Saharan Africa | 97M | 119M |
| Middle East and North Africa | 30M | 32M |
| South Asia | 16M | 29M |
| Latin America and the Caribbean | 12M | 13M |
Sustained food shortages and high food prices could send millions into acute food insecurity.
In addition, high fuel and food prices are often correlated with mass protests, political violence, and riots. While Sri Lanka and Peru have already begun to see heightened riots, Turkey and Egypt are also at risk for social unrest as the cost of living accelerates and food insecurity worsens.
Global Challenges
Since World War II, oil price shocks have been a major constraint on economic growth. As the war in Ukraine continues, the outlook for today’s energy market is far from clear as a number of geopolitical factors could sway oil price movements and its corresponding effects.


Energy
Charted: 4 Reasons Why Lithium Could Be the Next Gold Rush
Visual Capitalist has partnered with EnergyX to show why drops in prices and growing demand may make now the right time to invest in lithium.


4 Reasons Why You Should Invest in Lithium
Lithium’s importance in powering EVs makes it a linchpin of the clean energy transition and one of the world’s most precious minerals.
In this graphic, Visual Capitalist partnered with EnergyX to explore why now may be the time to invest in lithium.
1. Lithium Prices Have Dropped
One of the most critical aspects of evaluating an investment is ensuring that the asset’s value is higher than its price would indicate. Lithium is integral to powering EVs, and, prices have fallen fast over the last year:
| Date | LiOH·H₂O* | Li₂CO₃** |
|---|---|---|
| Feb 2023 | $76 | $71 |
| March 2023 | $71 | $61 |
| Apr 2023 | $43 | $33 |
| May 2023 | $43 | $33 |
| June 2023 | $47 | $45 |
| July 2023 | $44 | $40 |
| Aug 2023 | $35 | $35 |
| Sept 2023 | $28 | $27 |
| Oct 2023 | $24 | $23 |
| Nov 2023 | $21 | $21 |
| Dec 2023 | $17 | $16 |
| Jan 2024 | $14 | $15 |
| Feb 2024 | $13 | $14 |
Note: Monthly spot prices were taken as close to the 14th of each month as possible.
*Lithium hydroxide monohydrate MB-LI-0033
**Lithium carbonate MB-LI-0029
2. Lithium-Ion Battery Prices Are Also Falling
The drop in lithium prices is just one reason to invest in the metal. Increasing economies of scale, coupled with low commodity prices, have caused the cost of lithium-ion batteries to drop significantly as well.
In fact, BNEF reports that between 2013 and 2023, the price of a Li-ion battery dropped by 82%.
| Year | Price per KWh |
|---|---|
| 2023 | $139 |
| 2022 | $161 |
| 2021 | $150 |
| 2020 | $160 |
| 2019 | $183 |
| 2018 | $211 |
| 2017 | $258 |
| 2016 | $345 |
| 2015 | $448 |
| 2014 | $692 |
| 2013 | $780 |

3. EV Adoption is Sustainable
One of the best reasons to invest in lithium is that EVs, one of the main drivers behind the demand for lithium, have reached a price point similar to that of traditional vehicle.
According to the Kelly Blue Book, Tesla’s average transaction price dropped by 25% between 2022 and 2023, bringing it in line with many other major manufacturers and showing that EVs are a realistic transport option from a consumer price perspective.
| Manufacturer | September 2022 | September 2023 |
|---|---|---|
| BMW | $69,000 | $72,000 |
| Ford | $54,000 | $56,000 |
| Volkswagon | $54,000 | $56,000 |
| General Motors | $52,000 | $53,000 |
| Tesla | $68,000 | $51,000 |
4. Electricity Demand in Transport is Growing
As EVs become an accessible transport option, there’s an investment opportunity in lithium. But possibly the best reason to invest in lithium is that the IEA reports global demand for the electricity in transport could grow dramatically by 2030:
| Transport Type | 2022 | 2025 | 2030 |
|---|---|---|---|
| Buses 🚌 | 23,000 GWh | 50,000 GWh | 130,000 GWh |
| Cars 🚙 | 65,000 GWh | 200,000 GWh | 570,000 GWh |
| Trucks 🛻 | 4,000 GWh | 15,000 GWh | 94,000 GWh |
| Vans 🚐 | 6,000 GWh | 16,000 GWh | 72,000 GWh |
The Lithium Investment Opportunity
Lithium presents a potentially classic investment opportunity. Lithium and battery prices have dropped significantly, and recently, EVs have reached a price point similar to other vehicles. By 2030, the demand for clean energy, especially in transport, will grow dramatically.
With prices dropping and demand skyrocketing, now is the time to invest in lithium.
EnergyX is poised to exploit lithium demand with cutting-edge lithium extraction technology capable of extracting 300% more lithium than current processes.

-

 Lithium4 days ago
Ranked: The Top 10 EV Battery Manufacturers in 2023
Asia dominates this ranking of the world’s largest EV battery manufacturers in 2023.
-

 Energy1 week ago
The World’s Biggest Nuclear Energy Producers
China has grown its nuclear capacity over the last decade, now ranking second on the list of top nuclear energy producers.
-

 Energy1 month ago
The World’s Biggest Oil Producers in 2023
Just three countries accounted for 40% of global oil production last year.
-

 Energy1 month ago
How Much Does the U.S. Depend on Russian Uranium?
Currently, Russia is the largest foreign supplier of nuclear power fuel to the U.S.
-

 Uranium2 months ago
Charted: Global Uranium Reserves, by Country
We visualize the distribution of the world’s uranium reserves by country, with 3 countries accounting for more than half of total reserves.
-

 Energy3 months ago
Visualizing the Rise of the U.S. as Top Crude Oil Producer
Over the last decade, the United States has established itself as the world’s top producer of crude oil, surpassing Saudi Arabia and Russia.


-

 Misc1 week ago
How Hard Is It to Get Into an Ivy League School?
-

 Technology2 weeks ago
Ranked: Semiconductor Companies by Industry Revenue Share
-

 Markets2 weeks ago
Ranked: The World’s Top Flight Routes, by Revenue
-

 Countries2 weeks ago
Population Projections: The World’s 6 Largest Countries in 2075
-

 Markets2 weeks ago
The Top 10 States by Real GDP Growth in 2023
-

 Demographics2 weeks ago
The Smallest Gender Wage Gaps in OECD Countries
-

 Economy2 weeks ago
Where U.S. Inflation Hit the Hardest in March 2024
-

 Green2 weeks ago
Top Countries By Forest Growth Since 2001