Energy
All Electric Semi Truck Models in One Graphic
![]() Subscribe to the Elements free mailing list for more like this
Subscribe to the Elements free mailing list for more like this
Every Electric Semi Truck in One Graphic
This was originally posted on Elements. Sign up to the free mailing list to get beautiful visualizations on natural resource megatrends in your email every week.
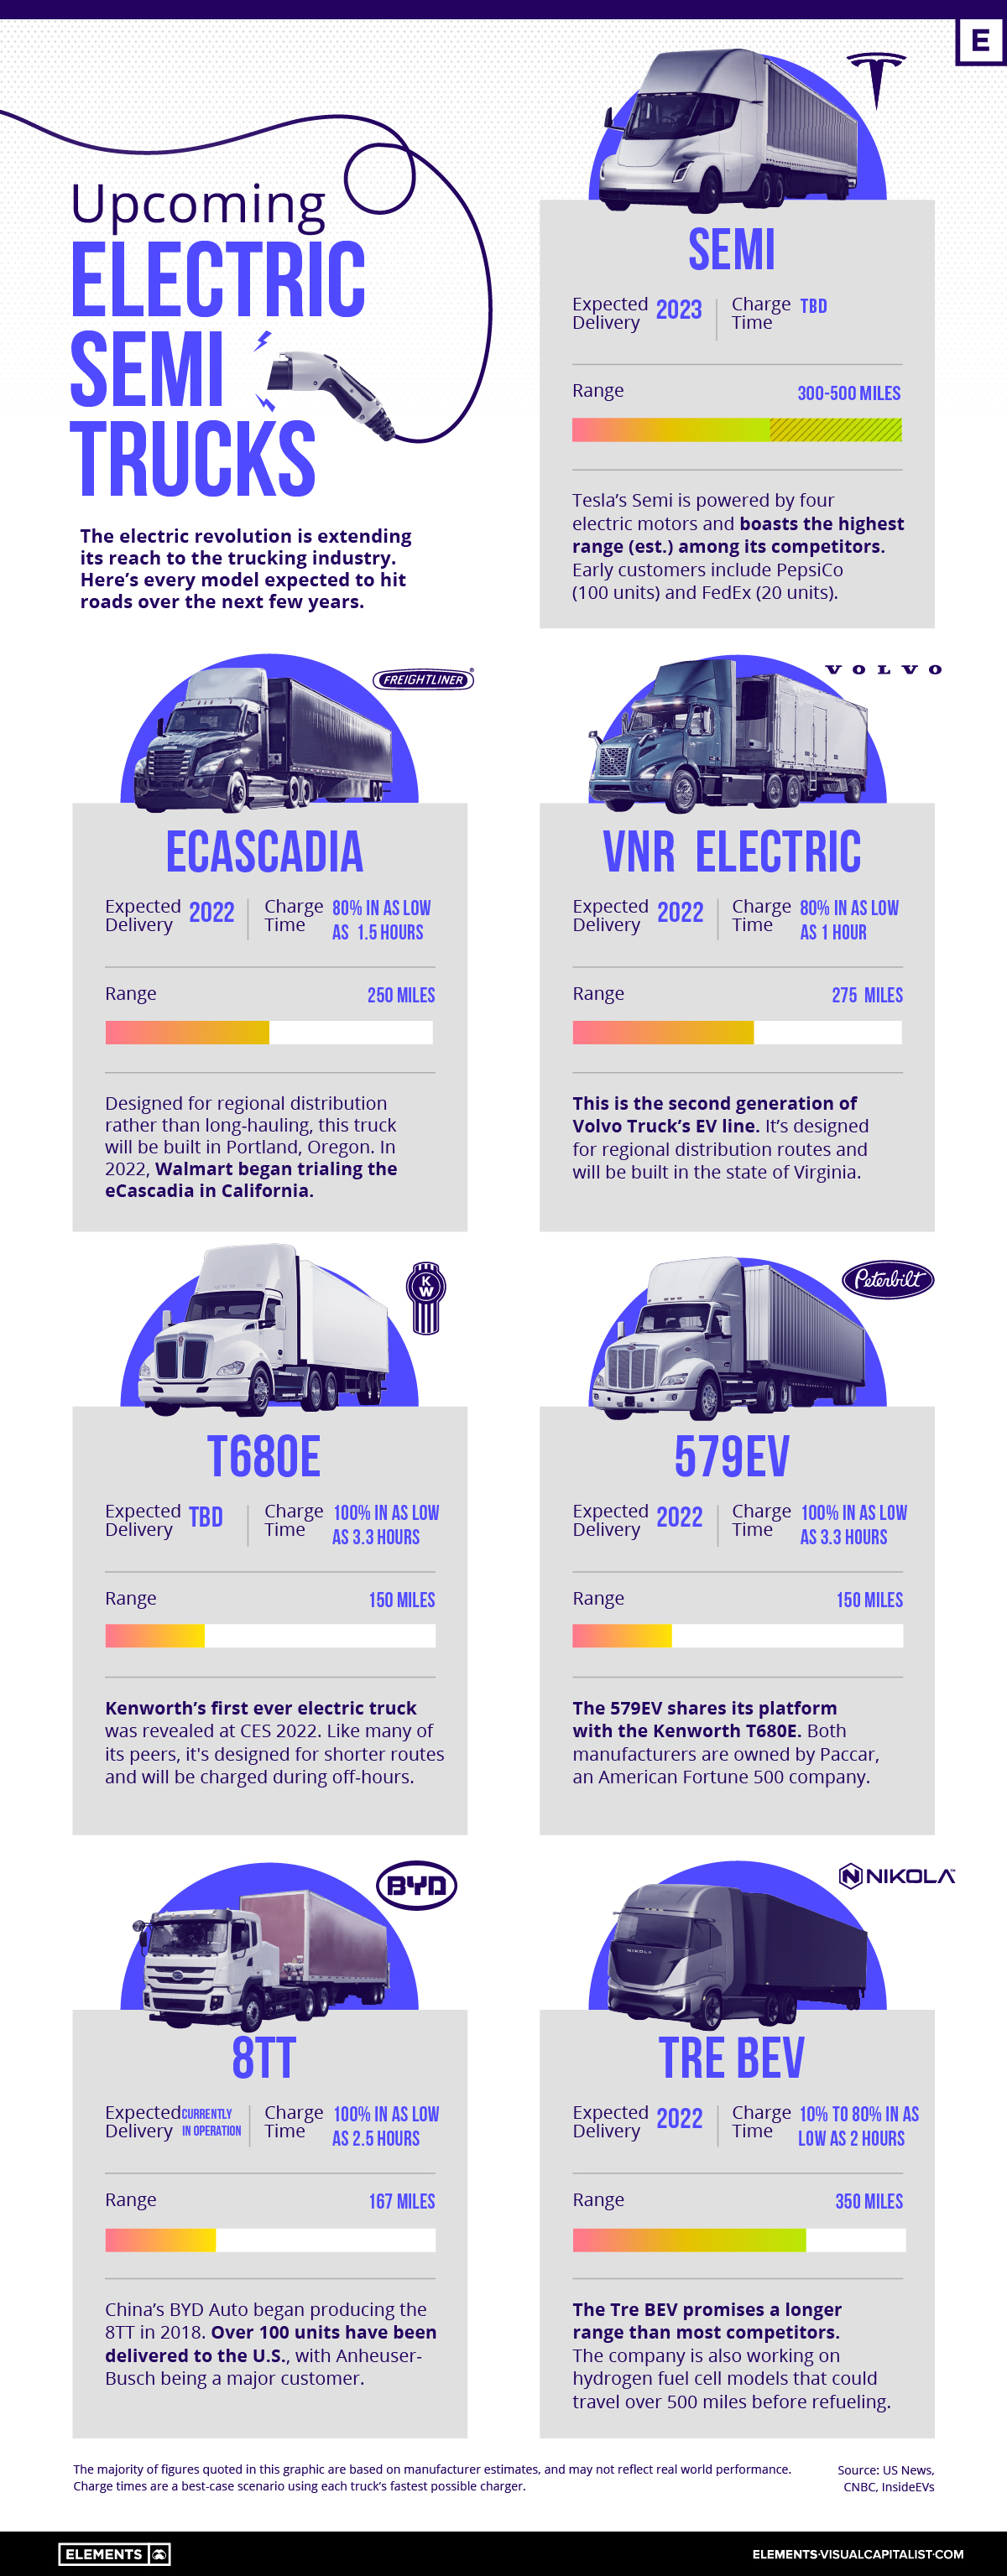
Electric semi trucks are coming, and they could help to decarbonize the shipping and logistics industry. However, range remains a major limitation.
This presents challenges for long-hauling, where the average diesel-powered semi can travel up to 2,000 miles before refueling. Compare this to the longest range electric model, the Tesla Semi, which promises up to 500 miles. A key word here is “promises”—the Semi is still in development, and nothing has been proven yet.
In this infographic, we’ve listed all of the upcoming electric semi trucks, complete with range and charge time estimates. Further in the article, we’ll explore the potential commercial use cases of this first generation of trucks.
Model Overview
The following table includes all of the models included in the above infographic.
| Company | Truck Name | Range | Charge Time | Expected Delivery |
|---|---|---|---|---|
| 🇺🇸 Tesla | Semi | 300-500 miles | TBD | 2023 |
| 🇺🇸 Freightliner | eCascadia | 250 miles | 80% in as low as 1.5 hrs | 2022 |
| 🇸🇪 Volvo | VNR Electric | 275 miles | 80% in as low as 1 hr | 2022 |
| 🇺🇸 Kenworth | T680E | 150 miles | 100% in as low as 3.3 hrs | TBD |
| 🇺🇸 Peterbilt | 579EV | 150 miles | 100% in as low as 3.3 hrs | 2022 |
| 🇨🇳 BYD | 8TT | 167 miles | 100% in as low as 2.5 hrs | In operation |
| 🇺🇸 Nikola | Tre BEV | 350 miles | 10% to 80% in as low as 2 hrs | 2022 |
Source: US News, CNBC, InsideEVs
With the exception of Tesla’s Semi, all of these trucks are currently in operation or expected to begin delivering this year. You may want to take this with a grain of salt, as the electric vehicle industry has become notorious for delays.
In terms of range, Tesla and Nikola are promising the highest figures (300+ miles), while the rest of the competition is targeting between 150 to 275 miles. It’s reasonable to assume that the Tesla and Nikola semis will be the most expensive.
Charge times are difficult to compare because of the variables involved. This includes the amount of charge and the type of charger used. Nikola, for example, claims it will take 2 hours to charge its Tre BEV from 10% to 80% when using a 240kW charger.
Charger technology is also improving quickly. Tesla is believed to be rolling out a 1 MW (1,000 kW) charger that could add 400 miles of range in just 30 minutes.
Use Cases of Electric Semi Trucks
Given their relatively lower ranges, electric semis are unlikely to be used for long hauls.
Instead, they’re expected to be deployed on regional and urban routes, where the total distance traveled between destinations is much lower. There are many reasons why electric semis are suited for these routes, as listed below:
- Smaller batteries can be installed, which keeps the cost of the truck lower
- Urban routes provide greater opportunities to use regenerative braking
- Quieter and cleaner operation in densely populated areas
An example of a regional route would be delivering containers from the Port of Los Angeles to the Los Angeles Transportation Center Intermodal Facility (LATC). The LATC is where containers are loaded onto trains, and is located roughly 28 miles away.
With a round trip totaling nearly 60 miles, an electric semi with a range of 200 miles could feasibly complete this route three times before needing a charge. The truck could be charged overnight, as well as during off hours in the middle of the day.
Hydrogen for Long Hauls?
We’ve covered the differences between battery and hydrogen fuel cell vehicles in the past, but this was from a passenger car perspective. The conclusion, in that case, was that battery electric has become the dominant technology. In terms of long-haul trucking, however, hydrogen may have an edge.
If we look at what will become mainstream, probably for smaller mobility it will be EVs, and fuel cells for larger mobility. That is the conclusion so far.
-Toshihiro Mibe, CEO, Honda
There are several reasons for why hydrogen could be beneficial for delivering heavy cargo over long distances. These are listed below:
- Refueling a hydrogen fuel cell takes less time than recharging a battery. Note, however, that charge times are still improving.
- A fuel cell configuration is typically lighter than an equivalent battery pack. Less drivetrain weight translates to a higher cargo capacity.
- Hydrogen-powered trucks could achieve a much higher range.
This last point hasn’t been proven yet, but we can reference Nikola, which is developing hydrogen-powered semi trucks. The company has two models in the works, which are the Tre FCEV with a range of 500 miles, and the Two FCEV with a range of 900 miles.
Keep in mind that these numbers are once again estimates and that Nikola has been accused of fraud in the past.
Who’s Using Electric Semi Trucks Today?
Although there are very few models available, electric semi trucks are indeed being used today.
In January 2020, Anheuser-Busch announced that it had received its 100th 8TT. The 8TT is produced by China’s BYD Motors and was one of the first electric semis to see real-world application. The brewing company uses its 8TTs to deliver products to retail destinations across California (e.g. grocery stores).
Another U.S. company using electric semis is Walmart. The retailer is trialing both the eCascadia from Freightliner and the Tre BEV from Nikola. The trucks are being used to pick up cargo from suppliers and then deliver it to regional consolidation centers.
Energy
Charted: 4 Reasons Why Lithium Could Be the Next Gold Rush
Visual Capitalist has partnered with EnergyX to show why drops in prices and growing demand may make now the right time to invest in lithium.


4 Reasons Why You Should Invest in Lithium
Lithium’s importance in powering EVs makes it a linchpin of the clean energy transition and one of the world’s most precious minerals.
In this graphic, Visual Capitalist partnered with EnergyX to explore why now may be the time to invest in lithium.
1. Lithium Prices Have Dropped
One of the most critical aspects of evaluating an investment is ensuring that the asset’s value is higher than its price would indicate. Lithium is integral to powering EVs, and, prices have fallen fast over the last year:
| Date | LiOH·H₂O* | Li₂CO₃** |
|---|---|---|
| Feb 2023 | $76 | $71 |
| March 2023 | $71 | $61 |
| Apr 2023 | $43 | $33 |
| May 2023 | $43 | $33 |
| June 2023 | $47 | $45 |
| July 2023 | $44 | $40 |
| Aug 2023 | $35 | $35 |
| Sept 2023 | $28 | $27 |
| Oct 2023 | $24 | $23 |
| Nov 2023 | $21 | $21 |
| Dec 2023 | $17 | $16 |
| Jan 2024 | $14 | $15 |
| Feb 2024 | $13 | $14 |
Note: Monthly spot prices were taken as close to the 14th of each month as possible.
*Lithium hydroxide monohydrate MB-LI-0033
**Lithium carbonate MB-LI-0029
2. Lithium-Ion Battery Prices Are Also Falling
The drop in lithium prices is just one reason to invest in the metal. Increasing economies of scale, coupled with low commodity prices, have caused the cost of lithium-ion batteries to drop significantly as well.
In fact, BNEF reports that between 2013 and 2023, the price of a Li-ion battery dropped by 82%.
| Year | Price per KWh |
|---|---|
| 2023 | $139 |
| 2022 | $161 |
| 2021 | $150 |
| 2020 | $160 |
| 2019 | $183 |
| 2018 | $211 |
| 2017 | $258 |
| 2016 | $345 |
| 2015 | $448 |
| 2014 | $692 |
| 2013 | $780 |

3. EV Adoption is Sustainable
One of the best reasons to invest in lithium is that EVs, one of the main drivers behind the demand for lithium, have reached a price point similar to that of traditional vehicle.
According to the Kelly Blue Book, Tesla’s average transaction price dropped by 25% between 2022 and 2023, bringing it in line with many other major manufacturers and showing that EVs are a realistic transport option from a consumer price perspective.
| Manufacturer | September 2022 | September 2023 |
|---|---|---|
| BMW | $69,000 | $72,000 |
| Ford | $54,000 | $56,000 |
| Volkswagon | $54,000 | $56,000 |
| General Motors | $52,000 | $53,000 |
| Tesla | $68,000 | $51,000 |
4. Electricity Demand in Transport is Growing
As EVs become an accessible transport option, there’s an investment opportunity in lithium. But possibly the best reason to invest in lithium is that the IEA reports global demand for the electricity in transport could grow dramatically by 2030:
| Transport Type | 2022 | 2025 | 2030 |
|---|---|---|---|
| Buses 🚌 | 23,000 GWh | 50,000 GWh | 130,000 GWh |
| Cars 🚙 | 65,000 GWh | 200,000 GWh | 570,000 GWh |
| Trucks 🛻 | 4,000 GWh | 15,000 GWh | 94,000 GWh |
| Vans 🚐 | 6,000 GWh | 16,000 GWh | 72,000 GWh |
The Lithium Investment Opportunity
Lithium presents a potentially classic investment opportunity. Lithium and battery prices have dropped significantly, and recently, EVs have reached a price point similar to other vehicles. By 2030, the demand for clean energy, especially in transport, will grow dramatically.
With prices dropping and demand skyrocketing, now is the time to invest in lithium.
EnergyX is poised to exploit lithium demand with cutting-edge lithium extraction technology capable of extracting 300% more lithium than current processes.

-

 Lithium5 days ago
Ranked: The Top 10 EV Battery Manufacturers in 2023
Asia dominates this ranking of the world’s largest EV battery manufacturers in 2023.
-

 Energy1 week ago
The World’s Biggest Nuclear Energy Producers
China has grown its nuclear capacity over the last decade, now ranking second on the list of top nuclear energy producers.
-

 Energy1 month ago
The World’s Biggest Oil Producers in 2023
Just three countries accounted for 40% of global oil production last year.
-

 Energy1 month ago
How Much Does the U.S. Depend on Russian Uranium?
Currently, Russia is the largest foreign supplier of nuclear power fuel to the U.S.
-

 Uranium2 months ago
Charted: Global Uranium Reserves, by Country
We visualize the distribution of the world’s uranium reserves by country, with 3 countries accounting for more than half of total reserves.
-

 Energy3 months ago
Visualizing the Rise of the U.S. as Top Crude Oil Producer
Over the last decade, the United States has established itself as the world’s top producer of crude oil, surpassing Saudi Arabia and Russia.


-

 Science7 days ago
Visualizing the Average Lifespans of Mammals
-

 Markets2 weeks ago
The Top 10 States by Real GDP Growth in 2023
-

 Demographics2 weeks ago
The Smallest Gender Wage Gaps in OECD Countries
-

 United States2 weeks ago
Where U.S. Inflation Hit the Hardest in March 2024
-

 Green2 weeks ago
Top Countries By Forest Growth Since 2001
-

 United States2 weeks ago
Ranked: The Largest U.S. Corporations by Number of Employees
-

 Maps2 weeks ago
The Largest Earthquakes in the New York Area (1970-2024)
-

 Green2 weeks ago
Ranked: The Countries With the Most Air Pollution in 2023