Energy
What is the Cost of Europe’s Energy Crisis?
![]() Subscribe to the Elements free mailing list for more like this
Subscribe to the Elements free mailing list for more like this
What is the Cost of Europe’s Energy Crisis?
This was originally posted on Elements. Sign up to the free mailing list to get beautiful visualizations on natural resource megatrends in your email every week.
Europe is scrambling to cut its reliance on Russian fossil fuels.
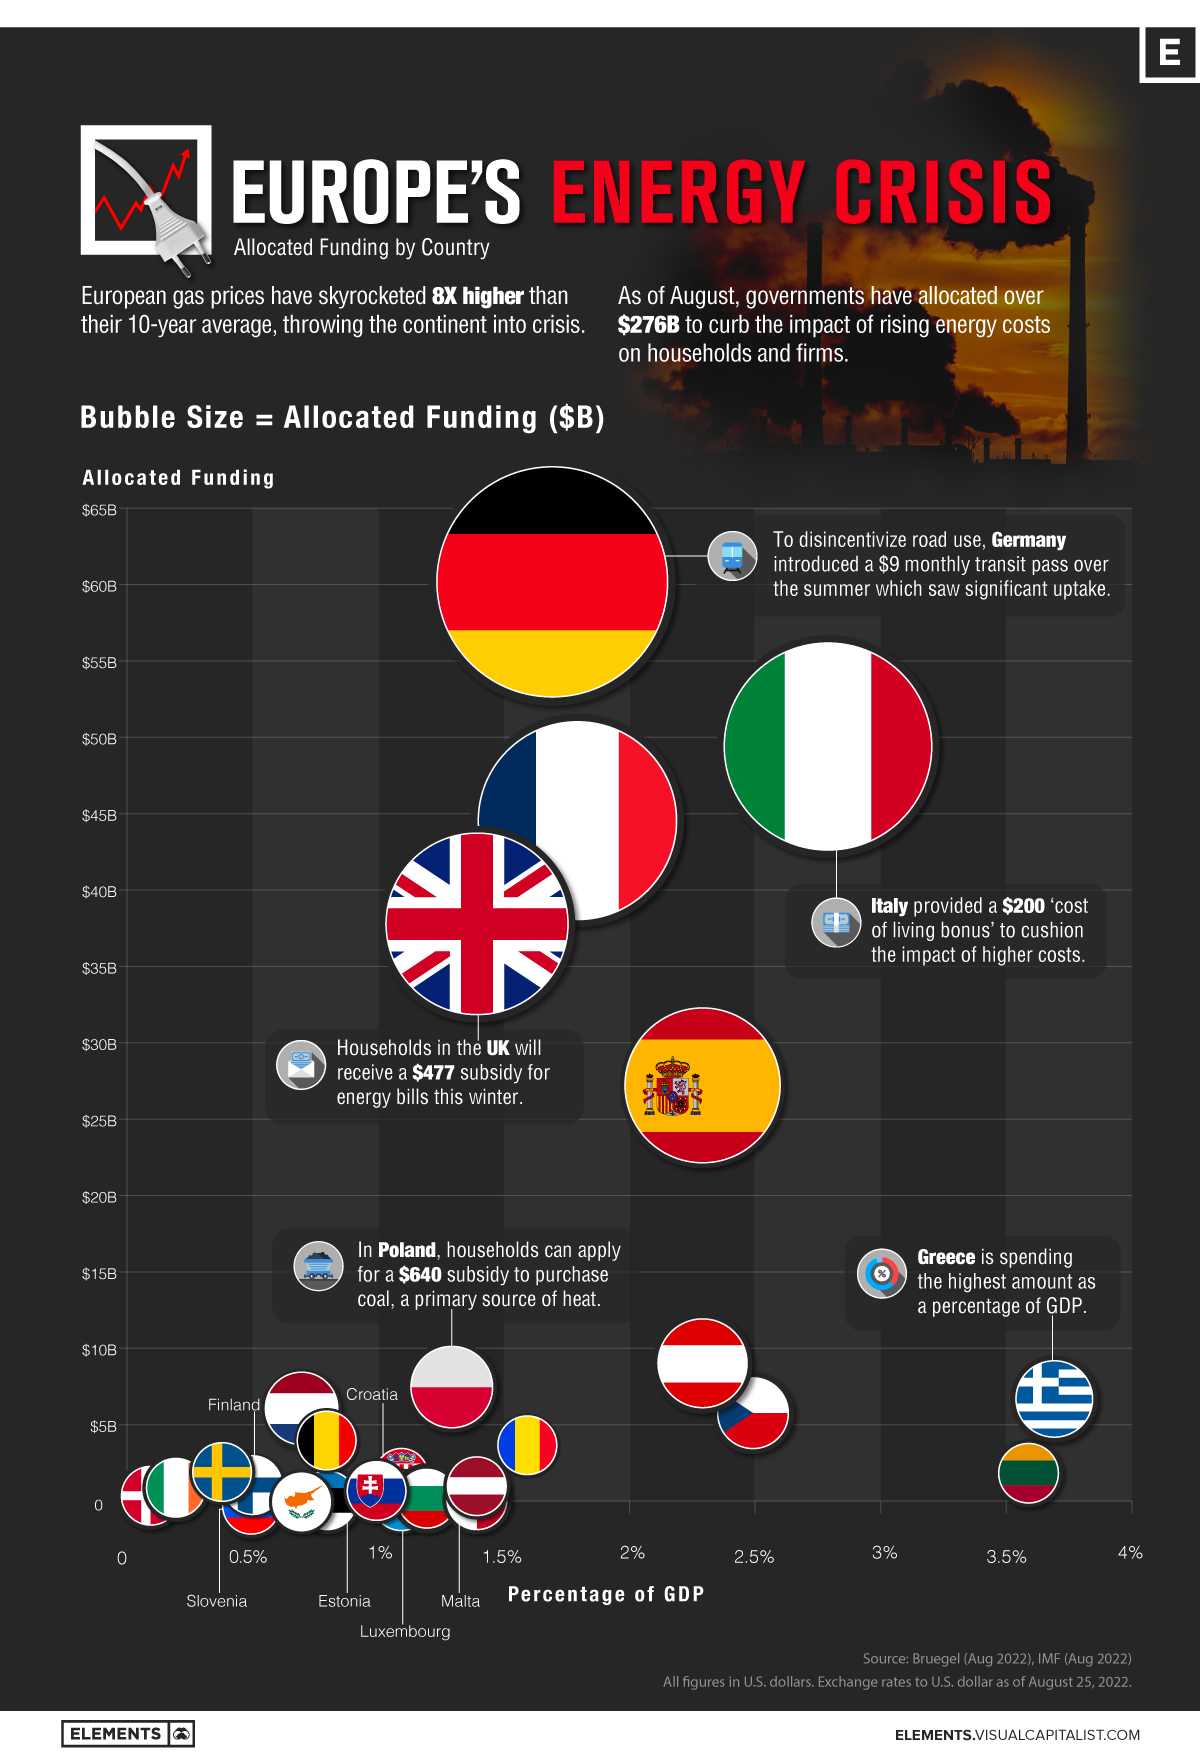
As European gas prices soar eight times their 10-year average, countries are introducing policies to curb the impact of rising prices on households and businesses. These include everything from the cost of living subsidies to wholesale price regulation. Overall, funding for such initiatives has reached $276 billion as of August.
With the continent thrown into uncertainty, the above chart shows allocated funding by country in response to the energy crisis.
The Energy Crisis, In Numbers
Using data from Bruegel, the below table reflects spending on national policies, regulation, and subsidies in response to the energy crisis for select European countries between September 2021 and July 2022. All figures in U.S. dollars.
| Country | Allocated Funding | Percentage of GDP | Household Energy Spending, Average Percentage |
|---|---|---|---|
| 🇩🇪 Germany | $60.2B | 1.7% | 9.9% |
| 🇮🇹 Italy | $49.5B | 2.8% | 10.3% |
| 🇫🇷 France | $44.7B | 1.8% | 8.5% |
| 🇬🇧 U.K. | $37.9B | 1.4% | 11.3% |
| 🇪🇸 Spain | $27.3B | 2.3% | 8.9% |
| 🇦🇹 Austria | $9.1B | 2.3% | 8.9% |
| 🇵🇱 Poland | $7.6B | 1.3% | 12.9% |
| 🇬🇷 Greece | $6.8B | 3.7% | 9.9% |
| 🇳🇱 Netherlands | $6.2B | 0.7% | 8.6% |
| 🇨🇿 Czech Republic | $5.9B | 2.5% | 16.1% |
| 🇧🇪 Belgium | $4.1B | 0.8% | 8.2% |
| 🇷🇴 Romania | $3.8B | 1.6% | 12.5% |
| 🇱🇹 Lithuania | $2.0B | 3.6% | 10.0% |
| 🇸🇪 Sweden | $1.9B | 0.4% | 9.2% |
| 🇫🇮 Finland | $1.2B | 0.5% | 6.1% |
| 🇸🇰 Slovakia | $1.0B | 1.0% | 14.0% |
| 🇮🇪 Ireland | $1.0B | 0.2% | 9.2% |
| 🇧🇬 Bulgaria | $0.8B | 1.2% | 11.2% |
| 🇱🇺 Luxembourg | $0.8B | 1.1% | n/a |
| 🇭🇷 Croatia | $0.6B | 1.1% | 14.3% |
| 🇱🇻 Lativia | $0.5B | 1.4% | 11.6% |
| 🇩🇰 Denmark | $0.5B | 0.1% | 8.2% |
| 🇸🇮 Slovenia | $0.3B | 0.5% | 10.4% |
| 🇲🇹 Malta | $0.2B | 1.4% | n/a |
| 🇪🇪 Estonia | $0.2B | 0.8% | 10.9% |
| 🇨🇾 Cyprus | $0.1B | 0.7% | n/a |
Source: Bruegel, IMF. Euro and pound sterling exchange rates to U.S. dollar as of August 25, 2022.
Germany is spending over $60 billion to combat rising energy prices. Key measures include a $300 one-off energy allowance for workers, in addition to $147 million in funding for low-income families. Still, energy costs are forecasted to increase by an additional $500 this year for households.
In Italy, workers and pensioners will receive a $200 cost of living bonus. Additional measures, such as tax credits for industries with high energy usage were introduced, including a $800 million fund for the automotive sector.
With energy bills predicted to increase three-fold over the winter, households in the U.K. will receive a $477 subsidy in the winter to help cover electricity costs.
Meanwhile, many Eastern European countries—whose households spend a higher percentage of their income on energy costs— are spending more on the energy crisis as a percentage of GDP. Greece is spending the highest, at 3.7% of GDP.
Utility Bailouts
Energy crisis spending is also extending to massive utility bailouts.
Uniper, a German utility firm, received $15 billion in support, with the government acquiring a 30% stake in the company. It is one of the largest bailouts in the country’s history. Since the initial bailout, Uniper has requested an additional $4 billion in funding.
Not only that, Wien Energie, Austria’s largest energy company, received a €2 billion line of credit as electricity prices have skyrocketed.
Deepening Crisis
Is this the tip of the iceberg? To offset the impact of high gas prices, European ministers are discussing even more tools throughout September in response to a threatening energy crisis.
To reign in the impact of high gas prices on the price of power, European leaders are considering a price ceiling on Russian gas imports and temporary price caps on gas used for generating electricity, among others.
Price caps on renewables and nuclear were also suggested.
Given the depth of the situation, the chief executive of Shell said that the energy crisis in Europe would extend beyond this winter, if not for several years.


Energy
Charted: 4 Reasons Why Lithium Could Be the Next Gold Rush
Visual Capitalist has partnered with EnergyX to show why drops in prices and growing demand may make now the right time to invest in lithium.


4 Reasons Why You Should Invest in Lithium
Lithium’s importance in powering EVs makes it a linchpin of the clean energy transition and one of the world’s most precious minerals.
In this graphic, Visual Capitalist partnered with EnergyX to explore why now may be the time to invest in lithium.
1. Lithium Prices Have Dropped
One of the most critical aspects of evaluating an investment is ensuring that the asset’s value is higher than its price would indicate. Lithium is integral to powering EVs, and, prices have fallen fast over the last year:
| Date | LiOH·H₂O* | Li₂CO₃** |
|---|---|---|
| Feb 2023 | $76 | $71 |
| March 2023 | $71 | $61 |
| Apr 2023 | $43 | $33 |
| May 2023 | $43 | $33 |
| June 2023 | $47 | $45 |
| July 2023 | $44 | $40 |
| Aug 2023 | $35 | $35 |
| Sept 2023 | $28 | $27 |
| Oct 2023 | $24 | $23 |
| Nov 2023 | $21 | $21 |
| Dec 2023 | $17 | $16 |
| Jan 2024 | $14 | $15 |
| Feb 2024 | $13 | $14 |
Note: Monthly spot prices were taken as close to the 14th of each month as possible.
*Lithium hydroxide monohydrate MB-LI-0033
**Lithium carbonate MB-LI-0029
2. Lithium-Ion Battery Prices Are Also Falling
The drop in lithium prices is just one reason to invest in the metal. Increasing economies of scale, coupled with low commodity prices, have caused the cost of lithium-ion batteries to drop significantly as well.
In fact, BNEF reports that between 2013 and 2023, the price of a Li-ion battery dropped by 82%.
| Year | Price per KWh |
|---|---|
| 2023 | $139 |
| 2022 | $161 |
| 2021 | $150 |
| 2020 | $160 |
| 2019 | $183 |
| 2018 | $211 |
| 2017 | $258 |
| 2016 | $345 |
| 2015 | $448 |
| 2014 | $692 |
| 2013 | $780 |

3. EV Adoption is Sustainable
One of the best reasons to invest in lithium is that EVs, one of the main drivers behind the demand for lithium, have reached a price point similar to that of traditional vehicle.
According to the Kelly Blue Book, Tesla’s average transaction price dropped by 25% between 2022 and 2023, bringing it in line with many other major manufacturers and showing that EVs are a realistic transport option from a consumer price perspective.
| Manufacturer | September 2022 | September 2023 |
|---|---|---|
| BMW | $69,000 | $72,000 |
| Ford | $54,000 | $56,000 |
| Volkswagon | $54,000 | $56,000 |
| General Motors | $52,000 | $53,000 |
| Tesla | $68,000 | $51,000 |
4. Electricity Demand in Transport is Growing
As EVs become an accessible transport option, there’s an investment opportunity in lithium. But possibly the best reason to invest in lithium is that the IEA reports global demand for the electricity in transport could grow dramatically by 2030:
| Transport Type | 2022 | 2025 | 2030 |
|---|---|---|---|
| Buses 🚌 | 23,000 GWh | 50,000 GWh | 130,000 GWh |
| Cars 🚙 | 65,000 GWh | 200,000 GWh | 570,000 GWh |
| Trucks 🛻 | 4,000 GWh | 15,000 GWh | 94,000 GWh |
| Vans 🚐 | 6,000 GWh | 16,000 GWh | 72,000 GWh |
The Lithium Investment Opportunity
Lithium presents a potentially classic investment opportunity. Lithium and battery prices have dropped significantly, and recently, EVs have reached a price point similar to other vehicles. By 2030, the demand for clean energy, especially in transport, will grow dramatically.
With prices dropping and demand skyrocketing, now is the time to invest in lithium.
EnergyX is poised to exploit lithium demand with cutting-edge lithium extraction technology capable of extracting 300% more lithium than current processes.

-

 Lithium4 days ago
Ranked: The Top 10 EV Battery Manufacturers in 2023
Asia dominates this ranking of the world’s largest EV battery manufacturers in 2023.
-

 Energy1 week ago
The World’s Biggest Nuclear Energy Producers
China has grown its nuclear capacity over the last decade, now ranking second on the list of top nuclear energy producers.
-

 Energy1 month ago
The World’s Biggest Oil Producers in 2023
Just three countries accounted for 40% of global oil production last year.
-

 Energy1 month ago
How Much Does the U.S. Depend on Russian Uranium?
Currently, Russia is the largest foreign supplier of nuclear power fuel to the U.S.
-

 Uranium2 months ago
Charted: Global Uranium Reserves, by Country
We visualize the distribution of the world’s uranium reserves by country, with 3 countries accounting for more than half of total reserves.
-

 Energy3 months ago
Visualizing the Rise of the U.S. as Top Crude Oil Producer
Over the last decade, the United States has established itself as the world’s top producer of crude oil, surpassing Saudi Arabia and Russia.


-

 Education1 week ago
How Hard Is It to Get Into an Ivy League School?
-

 Technology2 weeks ago
Ranked: Semiconductor Companies by Industry Revenue Share
-

 Markets2 weeks ago
Ranked: The World’s Top Flight Routes, by Revenue
-

 Demographics2 weeks ago
Population Projections: The World’s 6 Largest Countries in 2075
-

 Markets2 weeks ago
The Top 10 States by Real GDP Growth in 2023
-

 Demographics2 weeks ago
The Smallest Gender Wage Gaps in OECD Countries
-

 Economy2 weeks ago
Where U.S. Inflation Hit the Hardest in March 2024
-

 Green2 weeks ago
Top Countries By Forest Growth Since 2001