Environment
Charted: The Safest and Deadliest Energy Sources
Article/Editing:
Charted: The Safest and Deadliest Energy Sources
Recent conversations about climate change, emissions, and health have put a spotlight on the world’s energy sources.
As of 2021, nearly 90% of global CO₂ emissions came from fossil fuels. But energy production doesn’t just lead to carbon emissions, it can also cause accidents and air pollution that has a significant toll on human life.
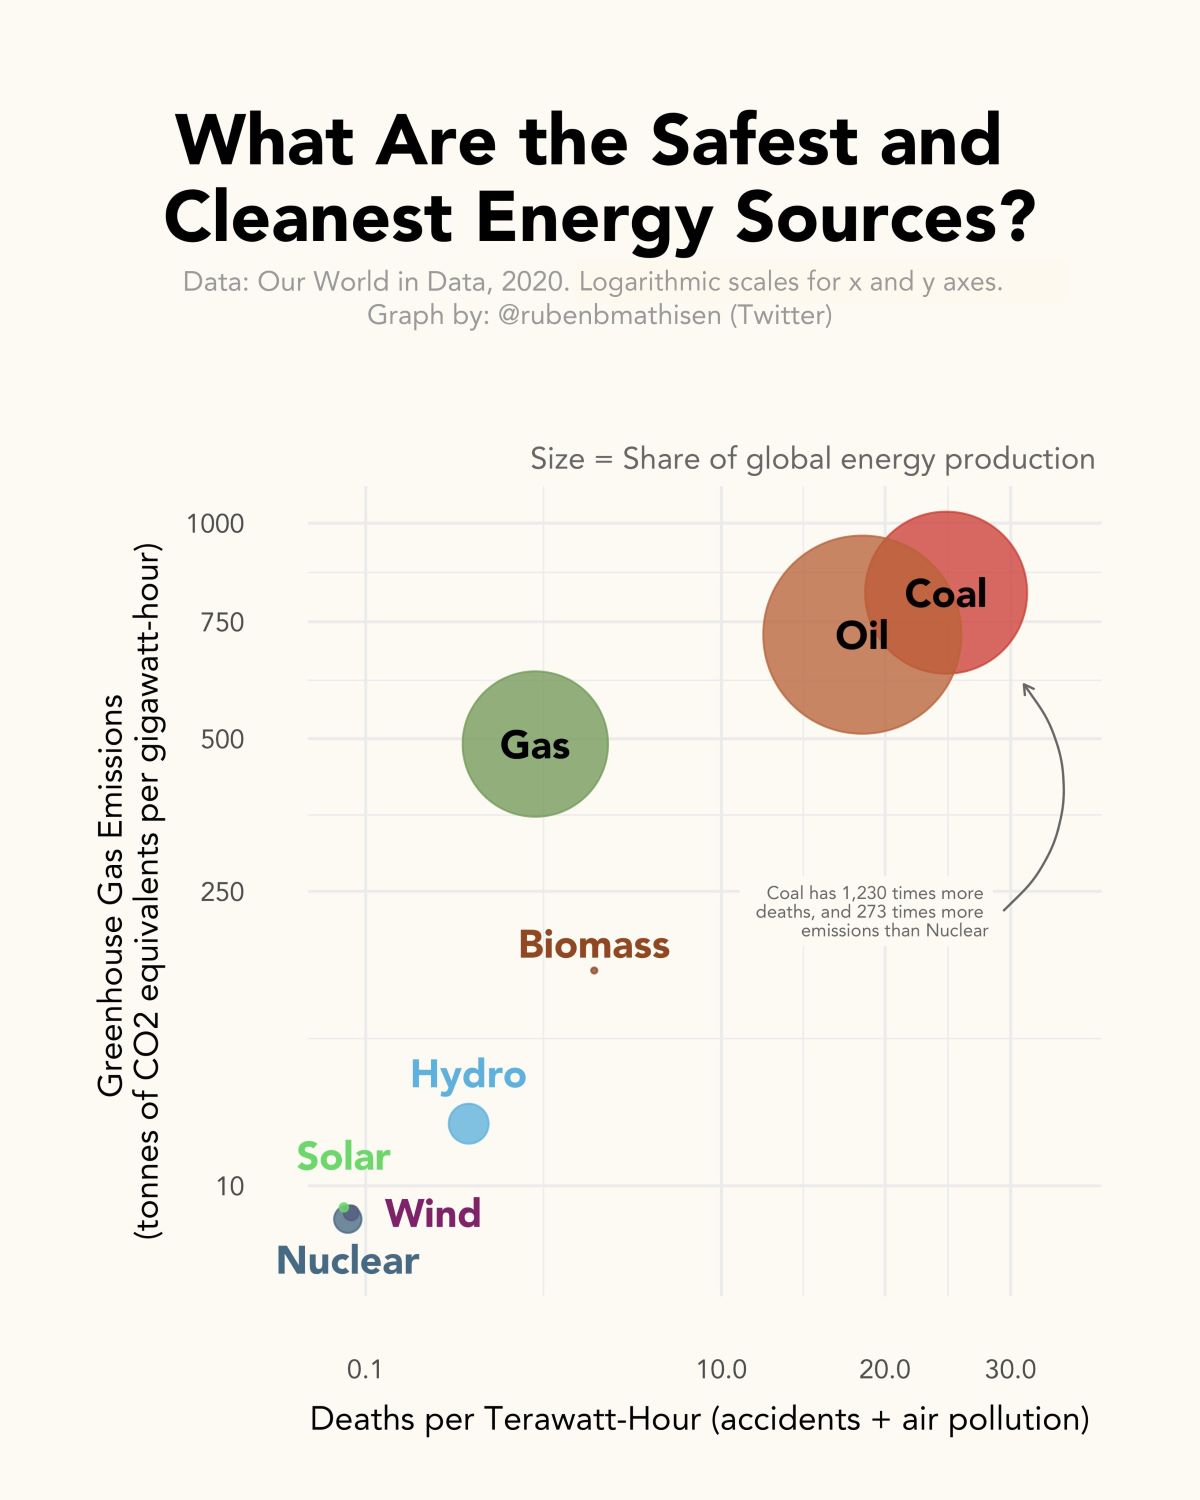
This graphic by Ruben Mathisen uses data from Our World in Data to help visualize exactly how safe or deadly these energy sources are.
Fossil Fuels are the Highest Emitters
All energy sources today produce greenhouse gases either directly or indirectly. However, the top three GHG-emitting energy sources are all fossil fuels.
| Energy | GHG Emissions (CO₂e/gigawatt-hour) |
|---|---|
| Coal | 820 tonnes |
| Oil | 720 tonnes |
| Natural Gas | 490 tonnes |
| Biomass | 78-230 tonnes |
| Hydropower | 34 tonnes |
| Solar | 5 tonnes |
| Wind | 4 tonnes |
| Nuclear | 3 tonnes |
Coal produces 820 tonnes of CO₂ equivalent (CO₂e) per gigawatt-hour. Not far behind is oil, which produces 720 tonnes CO₂e per gigawatt-hour. Meanwhile, natural gas produces 490 tonnes of CO₂e per gigawatt-hour.
These three sources contribute to over 60% of the world’s energy production.
Deadly Effects
Generating energy at a massive scale can have other side effects, like air pollution or accidents that take human lives.
| Energy Sources | Death rate (deaths/terawatt-hour) |
|---|---|
| Coal | 24.6 |
| Oil | 18.4 |
| Natural Gas | 2.8 |
| Biomass | 4.6 |
| Hydropower | 1.3 |
| Wind | 0.04 |
| Nuclear energy | 0.03 |
| Solar | 0.02 |
According to Our World in Data, air pollution and accidents from mining and burning coal fuels account for around 25 deaths per terawatt-hour of electricity—roughly the amount consumed by about 150,000 EU citizens in one year. The same measurement sees oil responsible for 18 annual deaths, and natural gas causing three annual deaths.
Meanwhile, hydropower, which is the most widely used renewable energy source, causes one annual death per 150,000 people. The safest energy sources by far are wind, solar, and nuclear energy at fewer than 0.1 annual deaths per terawatt-hour.
Nuclear energy, because of the sheer volume of electricity generated and low amount of associated deaths, is one of the world’s safest energy sources, despite common perceptions.

This article was published as a part of Visual Capitalist's Creator Program, which features data-driven visuals from some of our favorite Creators around the world.


Green
Ranked: Top Countries by Total Forest Loss Since 2001
The country with the most forest loss since 2001 lost as much forest cover as the next four countries combined.
Ranked: Top Countries By Total Forest Loss Since 2001
This was originally posted on our Voronoi app. Download the app for free on iOS or Android and discover incredible data-driven charts from a variety of trusted sources.
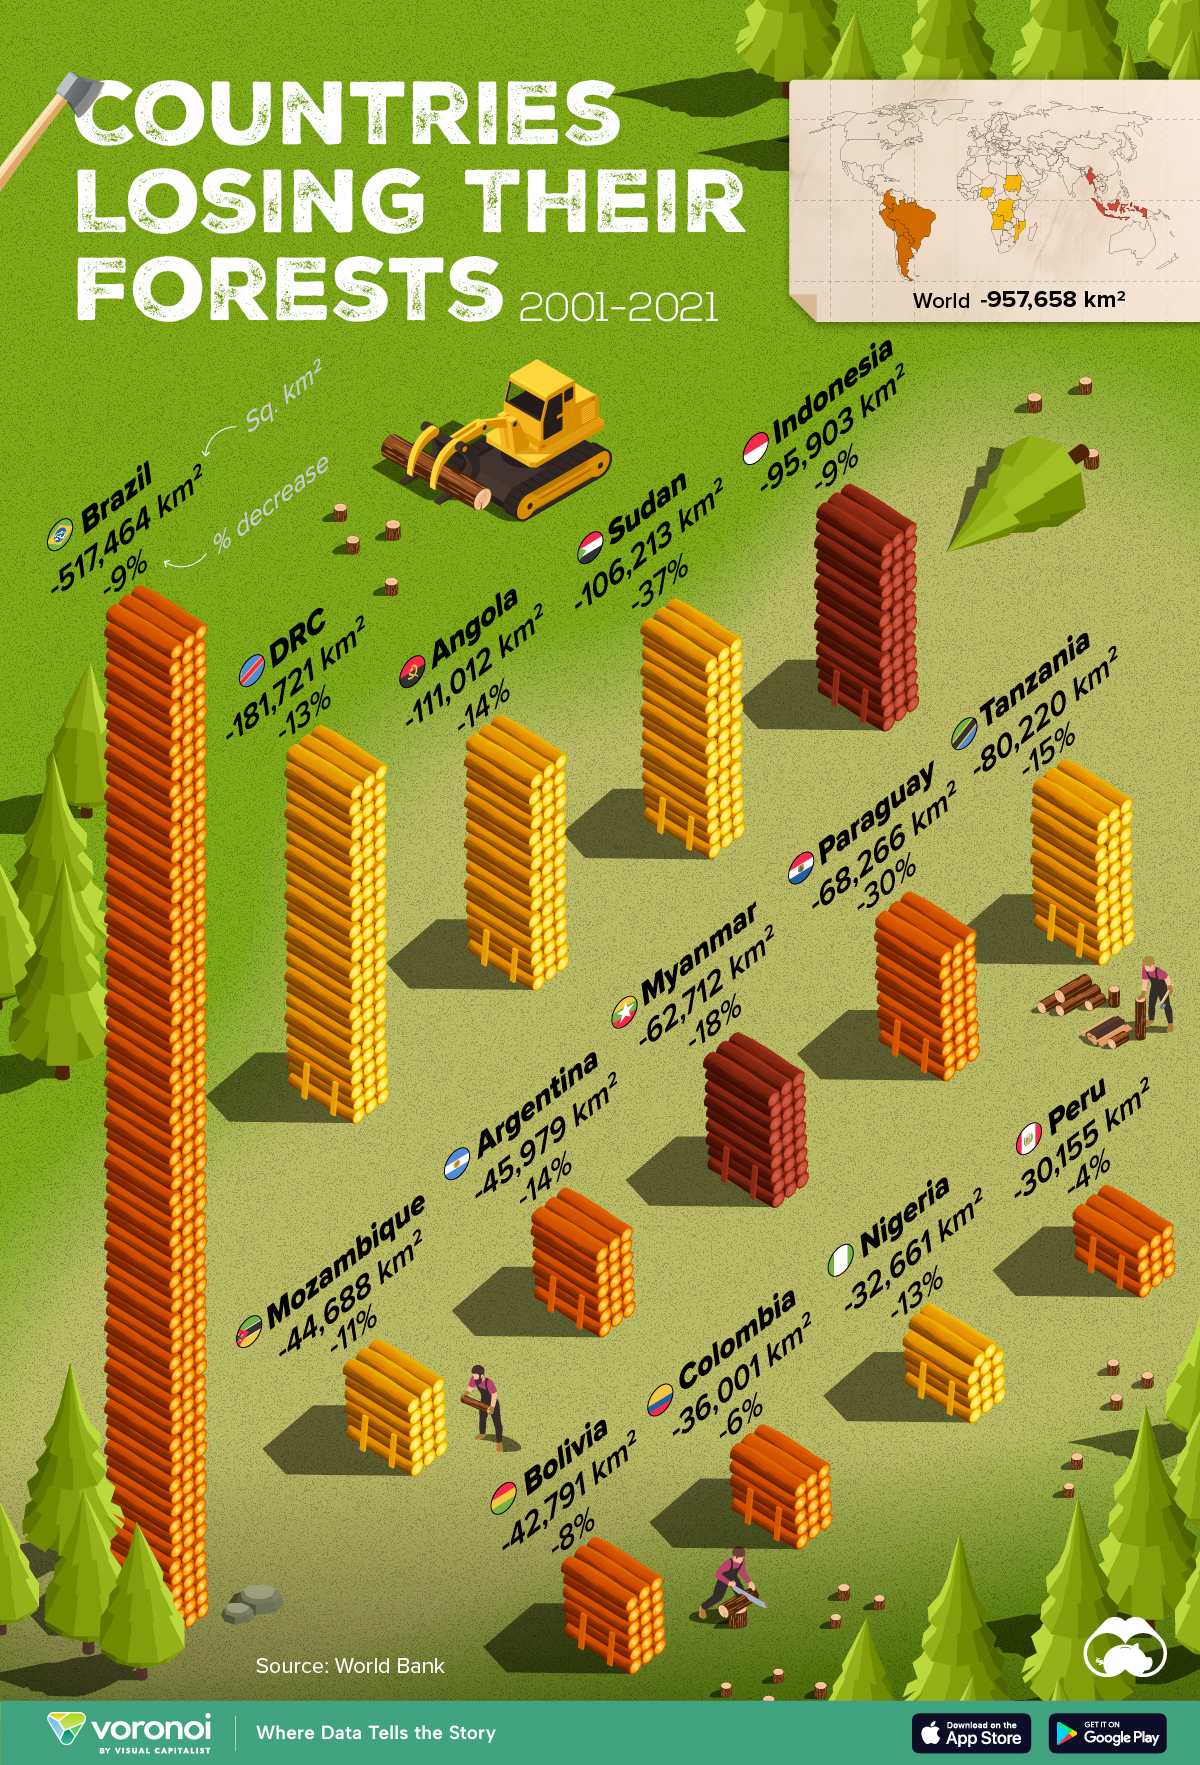
Forests are critical natural resources, often caught in the crosshairs of economic development. Thanks to expanding human settlement, agriculture, and industry, the world lost nearly 1 million square kilometers (km²) of forest cover since 2001.
But where has most of this deforestation occurred?
We rank the countries by the total decrease in their forest area between 2001 and 2021, measured in square kilometers along with their percentage decrease for context. All of this data was sourced from the World Bank.
A caveat to this data: countries are ranked by total forest loss, so countries with the largest forests feature predominantly on this list.
Which Country Has Lost the Most Forests (2001-2021)?
Brazil has lost more than half a million square kilometers of forest in the last two decades. Agricultural expansion for beef and soy production alongside mining and infrastructure growth are the primary drivers behind this large scale deforestation.
This has also caused periodic fires in the Amazon rainforest, drawing repeated alarm from around the world. In fact, Brazil has lost as much forest cover as the next four countries combined.
The table below lists the countries included in this graphic, as well as several others further down the ranking.
| Rank | Country | Region | 2001–21 Change (in km2) | % of Forest Loss |
|---|---|---|---|---|
| 1 | 🇧🇷 Brazil | South America | -517,464 | -9% |
| 2 | 🇨🇩 DRC | Africa | -181,721 | -13% |
| 3 | 🇦🇴 Angola | Africa | -111,012 | -14% |
| 4 | 🇸🇩 Sudan | Africa | -106,213 | -37% |
| 5 | 🇮🇩 Indonesia | Asia | -95,903 | -9% |
| 6 | 🇹🇿 Tanzania | Africa | -80,220 | -15% |
| 7 | 🇵🇾 Paraguay | South America | -68,266 | -30% |
| 8 | 🇲🇲 Myanmar | Asia | -62,712 | -18% |
| 9 | 🇦🇷 Argentina | South America | -45,979 | -14% |
| 10 | 🇲🇿 Mozambique | Africa | -44,688 | -11% |
| 11 | 🇧🇴 Bolivia | South America | -42,791 | -8% |
| 12 | 🇨🇴 Colombia | South America | -36,001 | -6% |
| 13 | 🇳🇬 Nigeria | Africa | -32,661 | -13% |
| 14 | 🇵🇪 Peru | South America | -30,155 | -4% |
| 15 | 🇰🇭 Cambodia | Asia | -28,491 | -26% |
| 16 | 🇻🇪 Venezuela | South America | -28,130 | -6% |
| 17 | 🇲🇽 Mexico | North America | -26,732 | -4% |
| 18 | 🇿🇲 Zambia | Africa | -23,924 | -5% |
| 19 | 🇧🇼 Botswana | Africa | -23,660 | -14% |
| 20 | 🇨🇮 Cote d'Ivoire | Africa | -22,577 | -45% |
What is quickly apparent is how most of the countries on this list are from Africa and South America. A study found a correlation where developing economies tend to have higher deforestation rates than advanced economies. Former colonies have also experienced more forest loss than those that were not colonized.
In Asia, Indonesia’s burgeoning palm oil industry is a key driver to deforestation, though efforts are now being made to reverse its impact. Meanwhile, Cambodia experienced rapid clear-cutting for its growing rubber plantations and timber industry.
Finally, Myanmar has long contended with illegal logging, but the country’s ongoing civil war is styming conversation efforts.

-

 Sports1 week ago
The Highest Earning Athletes in Seven Professional Sports
-

 Countries2 weeks ago
Population Projections: The World’s 6 Largest Countries in 2075
-

 Markets2 weeks ago
The Top 10 States by Real GDP Growth in 2023
-

 Demographics2 weeks ago
The Smallest Gender Wage Gaps in OECD Countries
-

 United States2 weeks ago
Where U.S. Inflation Hit the Hardest in March 2024
-

 Green2 weeks ago
Top Countries By Forest Growth Since 2001
-

 United States2 weeks ago
Ranked: The Largest U.S. Corporations by Number of Employees
-

 Maps2 weeks ago
The Largest Earthquakes in the New York Area (1970-2024)