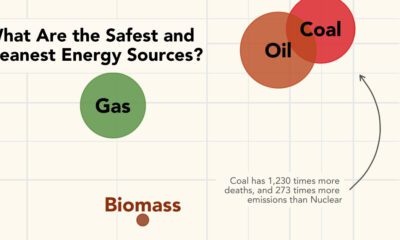

What are the safest energy sources? This graphic shows both GHG emissions and accidental deaths caused by different energy sources.
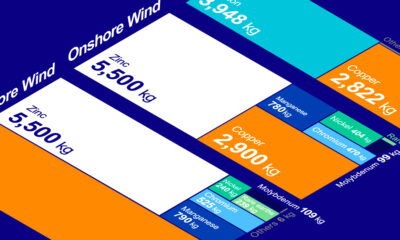

Metals are critical to the rollout of clean energy technologies like wind and solar, but just how much do they use?
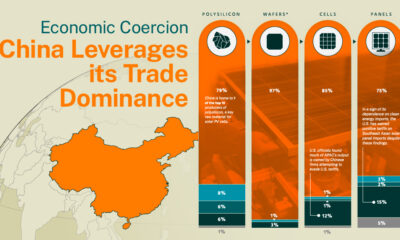

The Hinrich Foundation explores China's use of economic coercion and the implications of its control over the solar energy sector.
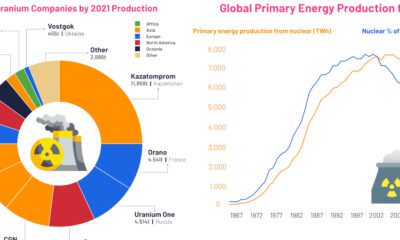

These visuals highlight the uranium mining industry and its output, as well as the trajectory of nuclear energy from 1960 to today.
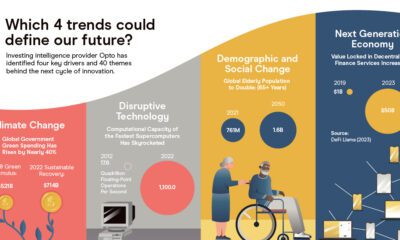

Uncover the next big idea with thematic investing. Explore opportunities in climate change, disruptive innovation, and next-gen tech.
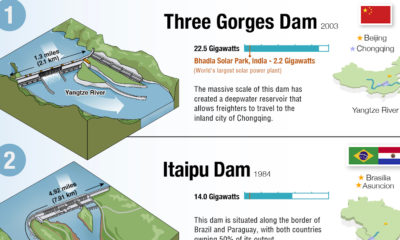

Hydroelectric dams generate 40% of the world's renewable energy, the largest of any type. View this infographic to learn more.
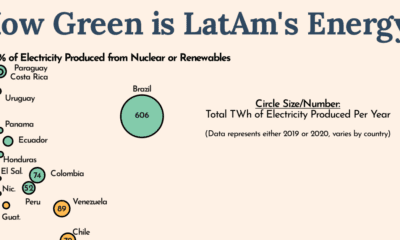

Countries around the world are looking to decarbonize, but Latin America is leading the charge in green energy usage.


In 2020, solar power saw its largest-ever annual capacity expansion at 127 gigawatts. Here's a snapshot of solar power capacity by country.
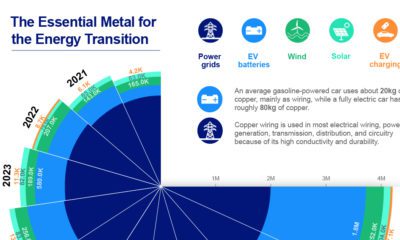

Global copper demand for alternative energy sources is expected to jump from 2.1 million tonnes in 2020 to 4.3 million tonnes in 2030.
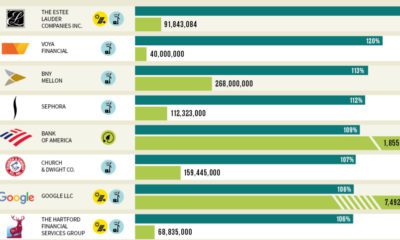

Which U.S. companies use the most green energy as a percentage of total energy used? Here are the 50 highest ranked companies according to the EPA.


 Creator Program