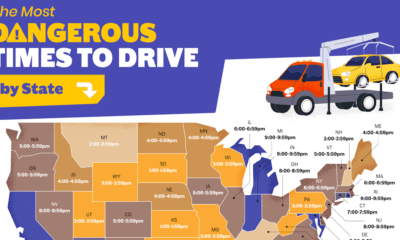

When is the most dangerous time to drive on American roads? We break down the data by hour, day, month, and state.
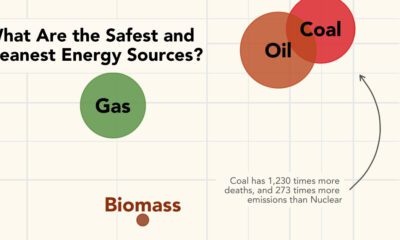

What are the safest energy sources? This graphic shows both GHG emissions and accidental deaths caused by different energy sources.
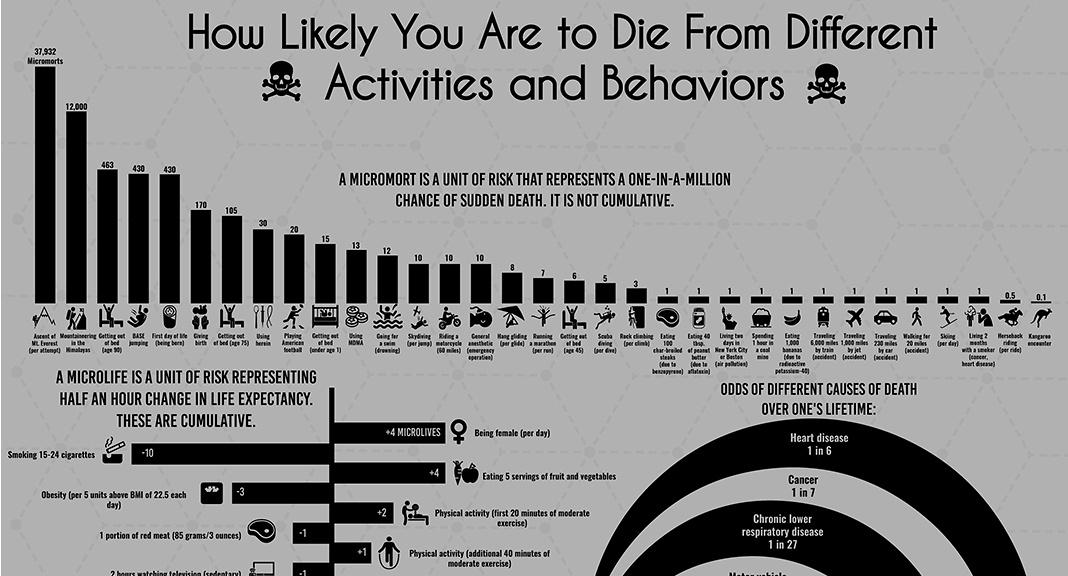
Science has given us insight into which behaviors may prolong or shorten life, but is there a universal, data-driven way to quantify death?
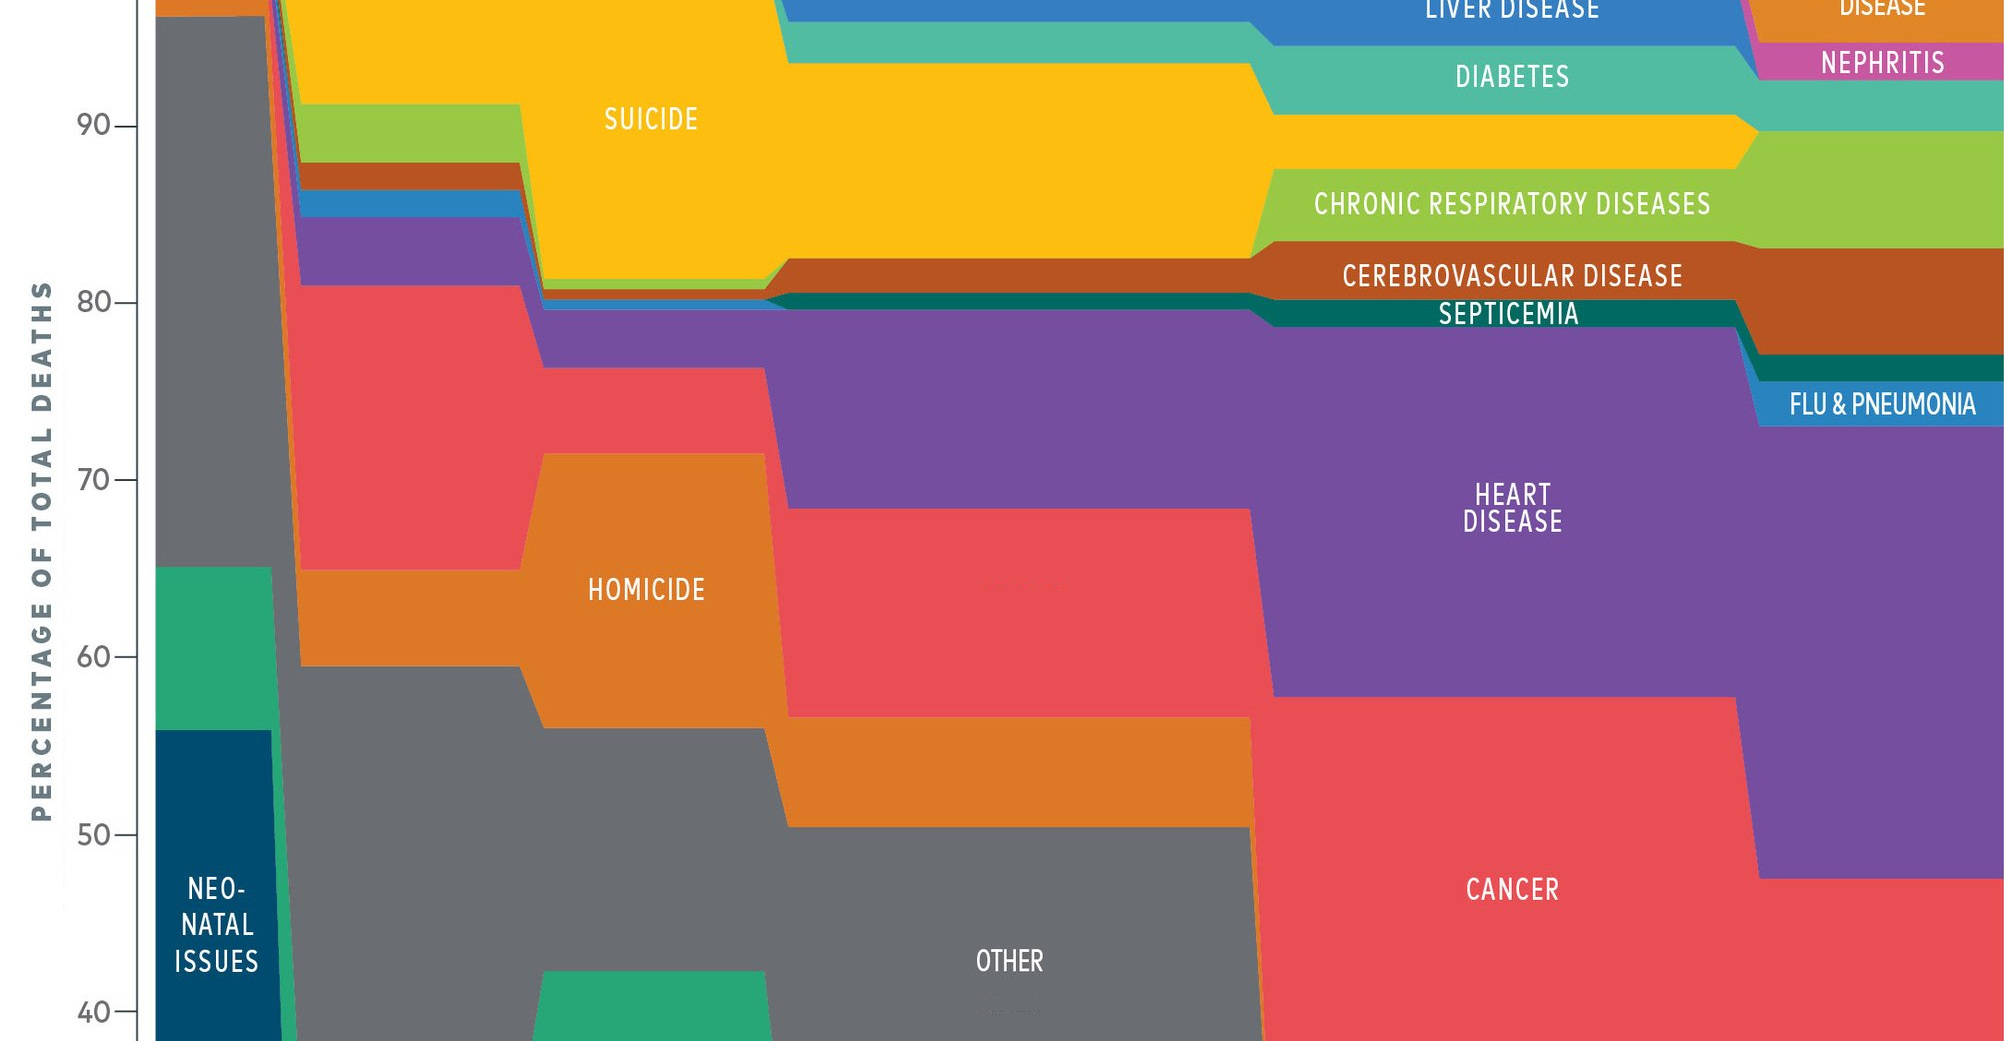
What causes of death do people worry the most about, and what types of death does media report on? It turns out both are very disproportionate...
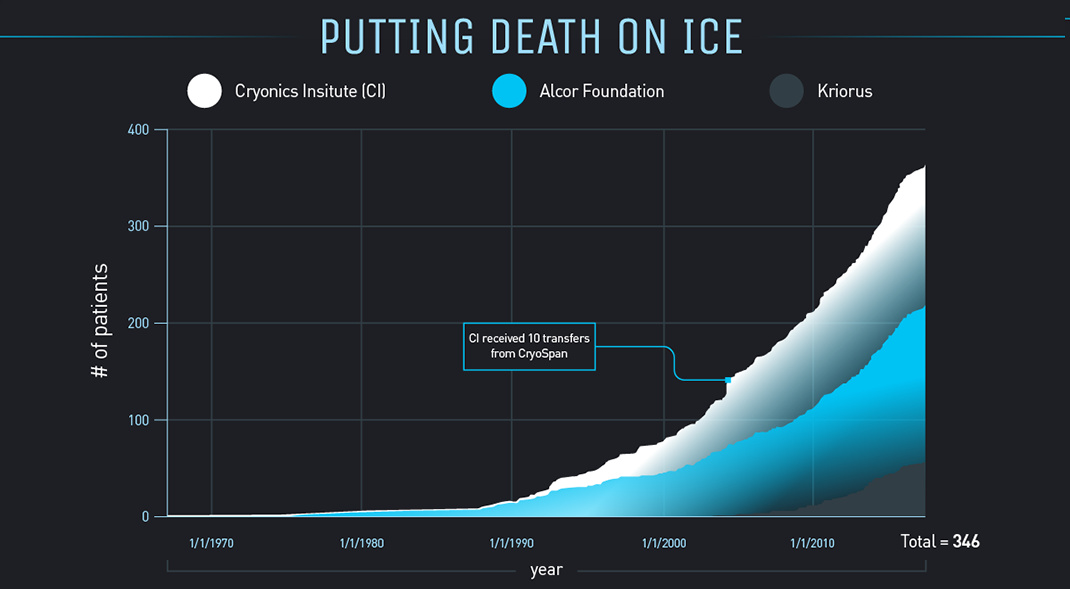
This infographic delves into the mechanics and feasibility of cryonics – a process that thousands of people are betting will give them a second shot at...