
In this graphic, we explore the projected generation capacity of different clean electricity technologies in the U.S. for 2023 and 2024.


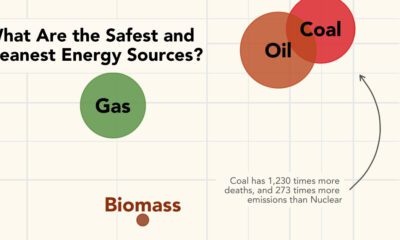
What are the safest energy sources? This graphic shows both GHG emissions and accidental deaths caused by different energy sources.


Metals are critical to the rollout of clean energy technologies like wind and solar, but just how much do they use?


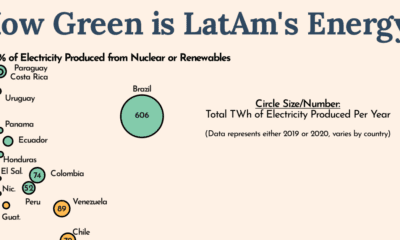
Countries around the world are looking to decarbonize, but Latin America is leading the charge in green energy usage.


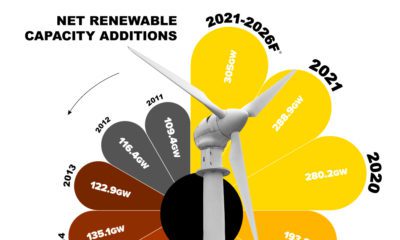
This infographic explores the exponential growth of the technologies that are shaping the new era of energy.


Wind is a great renewable energy source, but the spread of potential power is uneven. This graphic maps the average wind speed of the continental U.S.


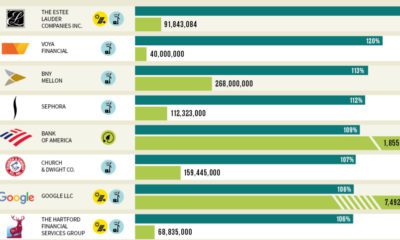
Which U.S. companies use the most green energy as a percentage of total energy used? Here are the 50 highest ranked companies according to the EPA.


For the last 50 years, fossil fuels have dominated energy consumption. This chart looks at how the energy mix is changing in over 60+ countries.